. 2014 Apr 15;116(8):1006-16.
doi: 10.1152/japplphysiol.01256.2013. Epub 2014 Feb 20.

Tracheal occlusion-evoked respiratory load compensation and inhibitory neurotransmitter expression in rats

Affiliations

Tracheal occlusion-evoked respiratory load compensation and inhibitory neurotransmitter expression in rats

Hsiu-Wen Tsai et al. J Appl Physiol (1985). .

Abstract

Respiratory load compensation is a sensory-motor reflex generated in the brain stem respiratory neural network. The nucleus of the solitary tract (NTS) is thought to be the primary structure to process the respiratory load-related afferent activity and contribute to the modification of the breathing pattern by sending efferent projections to other structures in the brain stem respiratory neural network. The sensory pathway and motor responses of respiratory load compensation have been studied extensively; however, the mechanism of neurogenesis of load compensation is still unknown. A variety of studies has shown that inhibitory interconnections among the brain stem respiratory groups play critical roles for the genesis of respiratory rhythm and pattern. The purpose of this study was to examine whether inhibitory glycinergic neurons in the NTS were activated by external and transient tracheal occlusions (ETTO) in anesthetized animals. The results showed that ETTO produced load compensation responses with increased inspiratory, expiratory, and total breath time, as well as elevated activation of inhibitory glycinergic neurons in the caudal NTS (cNTS) and intermediate NTS (iNTS). Vagotomized animals receiving transient respiratory loads did not exhibit these load compensation responses. In addition, vagotomy significantly reduced the activation of inhibitory glycinergic neurons in the cNTS and iNTS. The results suggest that these activated inhibitory glycinergic neurons in the NTS might be essential for the neurogenesis of load compensation responses in anesthetized animals.

Keywords: NTS; glycinergic neurons; load compensation; tracheal occlusion; vagotomy.


Figures
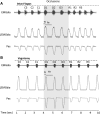
Fig. 1.
Fig. 1.
Effect of vagotomy on the respiratory load compensation responses. Breathing pattern results during control (C3–C1), occluded (O1–O3), and recovery (R1–R3) breaths. A and B: top traces are the raw diaphragm electromyography (EMGdia) signals, middle traces are the ∫EMGdia signals, and bottom traces are the esophageal pressure (Pes). A: breathing pattern in a group A rat with external and transient tracheal occlusions (ETTO) with intact vagi. B: breathing pattern in a group D rat with ETTO after bilateral cervical vagotomy. The inspiratory time (Ti) and expiratory time (Te) are shown in the trace of ∫EMGdia. Shadow area represents the period of ETTO.
Fig. 2.
Fig. 2.
ETTO elicited load compensation responses in anesthetized animals with intact vagi (group B). Normalized breath-timing values during control (C3, C2, C1), occluded (O1, O2, O3), and recovery (R1, R2, R3). A: the relationship between Ti and breath number. B: the relationship between Te and breath number. C: the relationship between total breath time (Ttot) and breath number. Significant difference, *P < 0.05.
Fig. 3.
Fig. 3.
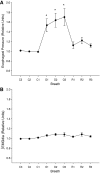
ETTO effect on Pes change (ΔPes) and ∫EMGdia amplitude in anesthetized animals with intact vagi (group B). Normalized Pes (A) and ∫EMGdia amplitude (B) during control (C3, C2, C1), occluded (O1, O2, O3), and recovery (R1, R2, R3) breaths. The ΔPes is plotted as a relative increased negative pressure. Significant difference, *P < 0.05.
Fig. 4.
Fig. 4.
Load compensation responses with ETTO after vagotomy in anesthetized animals (group D). Normalized breath-timing values during control (C3, C2, C1), occluded (O1, O2, O3), and recovery (R1, R2, R3). A: the relationship between Ti and breath number. B: the relationship between Te and breath number. C: the relationship between Ttot and breath number. Significant difference, *P < 0.05.
Fig. 5.
Fig. 5.
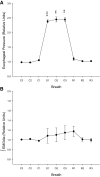
ETTO effect on ΔPes and ∫EMGdia amplitude in vagotomized animals (group D). Normalized ΔPes (A) and ∫EMGdia amplitude (B) during control (C3, C2, C1), occluded (O1, O2, O3), and recovery (R1, R2, R3) breaths. The ΔPes is plotted as a relative increased negative pressure. Significant difference, **P < 0.01; ***P < 0.001.
Fig. 6.
Fig. 6.
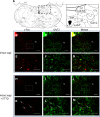
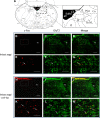
ETTO activated glycinergic neurons in the caudal nucleus of the solitary tract (cNTS) in anesthetized animals with intact vagi. Immunofluorescence double-staining of c-Fos (red) and glycine transporter 2 (GlyT2; green) in the cNTS (Bregma −13.8 mm) in group A animals without ETTO (B–G) and group B animals with ETTO (H–M). A: dashed box represents the area of the rat brain atlas corresponding to the regions in B–D and H–J. E–G and K–M: dashed areas in B–D and H–J, respectively. TS, solitary tract. Arrows represent immunoreactive cells. B–D and H–J: scale bars, 100 μm; E–G and K–M: scale bars, 50 μm. Abbreviations in Figs. 6 and 7: 10, dorsal motor nucleus of vagus; 12, hypoglossal nucleus; 12n, root of hypoglossal nerve; A1, A1 noradrenaline cells; A2, A2 noradrenaline cells; Amb, ambiguus nucleus; AP, area postrema; CC, central canal; Cop, copula of pyramis; Crus2, crus 2 of ansiform lobule; Cu, cuneate nucleus; cu, cuneate fasciculus; CVL, caudoventrolateral reticular nucleus; CVRG, caudoventral respiratory group; dsc, dorsal spinocerebellar tract; ECu, external cuneate nucleus; Ge5, gelatinous layer caudal spinal 5; Gr, gracile nucleus; gr, gracile fasciculus; ia, internal arcuate fibers; IOA, inferior olive, subnucleus A of medial nucleus; IOB, inferior olive, subnucleus B of medial nucleus; IOBe, inferior olive, β subnucleus; IOC, inferior olive, subnucleus C of medial nucleus; IOD, inferior olive, dorsal nucleus; IOK, inferior olive, cap of Kooy of medial nucleus; IRt, intermediate reticular nucleus; LRt, lateral reticular nucleus; LRtPC, lateral reticular nucleus, parvicell; LRtS5, lateral reticular nucleus, sub5 part; MdD, medullary reticular nucleus, dorsal; MdV, medullary reticular nucleus, ventral; ml, medial lemniscus; mlf, medial longitudinal fasciculus; pf, pyramidal fissure; PM, paramedian lobule; PMn, paramedian reticular nucleus; Py, pyramidal tract; Ro, nucleus of Roller; ROb, raphe obscurus nucleus; RPa, raphe pallidus nucleus; rs, rubrospinal tract; RVL, rostroventrolateral reticular nucleus; RVRG, rostral ventral respiratory group; sol, solitary tract; SolC, nucleus of solitary tract, commissural; SolDM, nucleus of solitary tract, dorsomedial; SolI, nucleus of solitary tract, interstitial; SolIM, nucleus of solitary, intermediate; SolM, nucleus of solitary tract, medial; SolVL, nucleus of solitary tract, ventrolateral; sp5, spinal trigeminal tract; Sp5C, spinal 5 nucleus, caudal part; Sp5I, spinal 5 nucleus, interpolar part; ts, tectospinal tract; vsc: ventral spinocerebellar tract.
Fig. 7.
Fig. 7.
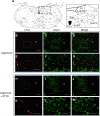
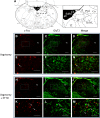
Vagotomy abolished the activation of inhibitory glycinergic neurons in the cNTS in anesthetized animals. Immunofluorescence staining of c-Fos (red) and GlyT2 (green) in the cNTS (Bregma −13.8 mm) in group C vagotomized animals without ETTO (B–G) and group D with ETTO (H–M). A: dashed box represents the area of the rat brain atlas corresponding to the regions in B–D and H–J. E–G and K–M: dashed areas in B–D and H–J, respectively. Arrows represent immunoreactive cells. B–D and H–J: scale bars, 100 μm; E–G and K–M: scale bars, 50 μm.
Fig. 8.
Fig. 8.
Immunofluorescence double-staining of c-Fos and GlyT2 in the cNTS in anesthetized animals with (groups A and B) or without (groups C and D) intact vagi. A: c-Fos-labeled cell number; B: colabeled c-Fos and GlyT2 cell number; C: percentage of c-Fos-positive cells colabeled with GlyT2. Significant difference, *P < 0.05; **P < 0.01; ***P < 0.001.
Fig. 9.
Fig. 9.
ETTO activated glycinergic neurons in the intermediate NTS (iNTS) in anesthetized animals with intact vagi. Immunofluorescence double-staining of c-Fos (red) and GlyT2 (green) in the iNTS (Bregma −13.2 mm) in group A animals without ETTO (B–G) and group B animals with ETTO (H–M). A: dashed box represents the area of the rat brain atlas corresponding to the regions in B–D and H–J. E–G and K–M: dashed areas in B–D and H–J, respectively. Arrows represent immunoreactive cells. B–D and H–J: scale bars, 100 μm; E–G and K–M: scale bars, 50 μm. Abbreviations in Figs. 9 and 10: 4V, 4th ventricle; C1, C1 adrenaline cells; C2, C2 adrenaline cells; chp, choroid plexus; Gi, gigantocellular reticular nucleus; icp, inferior cerebellar peduncle; IOPr, inferior olive, principal nucleus; IOVL, inferior olive, ventrolateral protrusion; oc, olivocerebellar tract; Pa5, paratrigeminal nucleus; PCRt, parvicellular reticular nucleus; PSol, parasolitary nucleus; R, red nucleus; SolCe, nucleus of solitary tract, central; SolG, nucleus of solitary tract, gelatinous; VL, ventrolateral thalamic nucleus.
Fig. 10.
Fig. 10.
Vagotomy partially abolished the activation of inhibitory glycinergic neurons in the iNTS in anesthetized animals. Immunofluorescence staining of c-Fos (red) and GlyT2 (green) in the iNTS (Bregma −13.2 mm) in group C vagotomized animals without ETTO (B–G) and group D vagotomized animals with ETTO (H–M). A: dashed box represents the area of the rat brain atlas corresponding to the regions in B–D and H–J. E–G and K–M: dashed area in B–D and H–J, respectively. Arrows represent immunoreactive cells. B–D and H–J: scale bars, 100 μm; E–G and K–M: scale bars, 50 μm.
Fig. 11.
Fig. 11.
Immunofluorescence double-staining of c-Fos and GlyT2 in the iNTS in anesthetized animals with intact vagi (groups A and B) and vagotomy (groups C and D). A: c-Fos-labeled cell number; B: colabeled c-Fos and GlyT2 cell number; C: percentage of c-Fos-positive cells colabeled with GlyT2. Significant difference, *P < 0.05; **P < 0.01; ***P < 0.001.

References

    1. Alheid GF, McCrimmon DR. The chemical neuroanatomy of breathing. Respir Physiol Neurobiol 164: 3–11, 2008 - PMC - PubMed
    1. Bianchi AL, Denavit-Saubie M, Champagnat J. Central control of breathing in mammals: neuronal circuitry, membrane properties, and neurotransmitters. Physiol Rev 75: 1–45, 1995 - PubMed
    1. Bonham AC, Coles SK, McCrimmon DR. Pulmonary stretch receptor afferents activate excitatory amino acid receptors in the nucleus tractus solitarii in rats. J Physiol 464: 725–745, 1993 - PMC - PubMed
    1. Bonham AC, McCrimmon DR. Neurones in a discrete region of the nucleus tractus solitarius are required for the Breuer-Hering reflex in rat. J Physiol 427: 261–280, 1990 - PMC - PubMed
    1. Campbell EJ, Dickinson CJ, Howell JB. The immediate effects of added loads on the inspiratory musculature of the rabbit. J Physiol 172: 321–331, 1964 - PMC - PubMed

Publication types

LinkOut - more resources