Comparative Study
. 2014 Apr 15;116(8):1096-104.
doi: 10.1152/japplphysiol.00027.2014. Epub 2014 Feb 20.

Thin-beam ultrasound overestimation of blood flow: how wide is your beam?

Affiliations
Comparative Study

Thin-beam ultrasound overestimation of blood flow: how wide is your beam?

Tahisha M Buck et al. J Appl Physiol (1985). .

Abstract

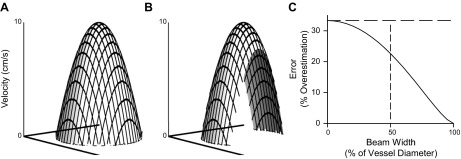
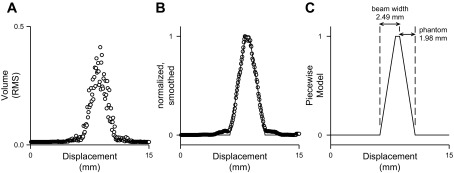
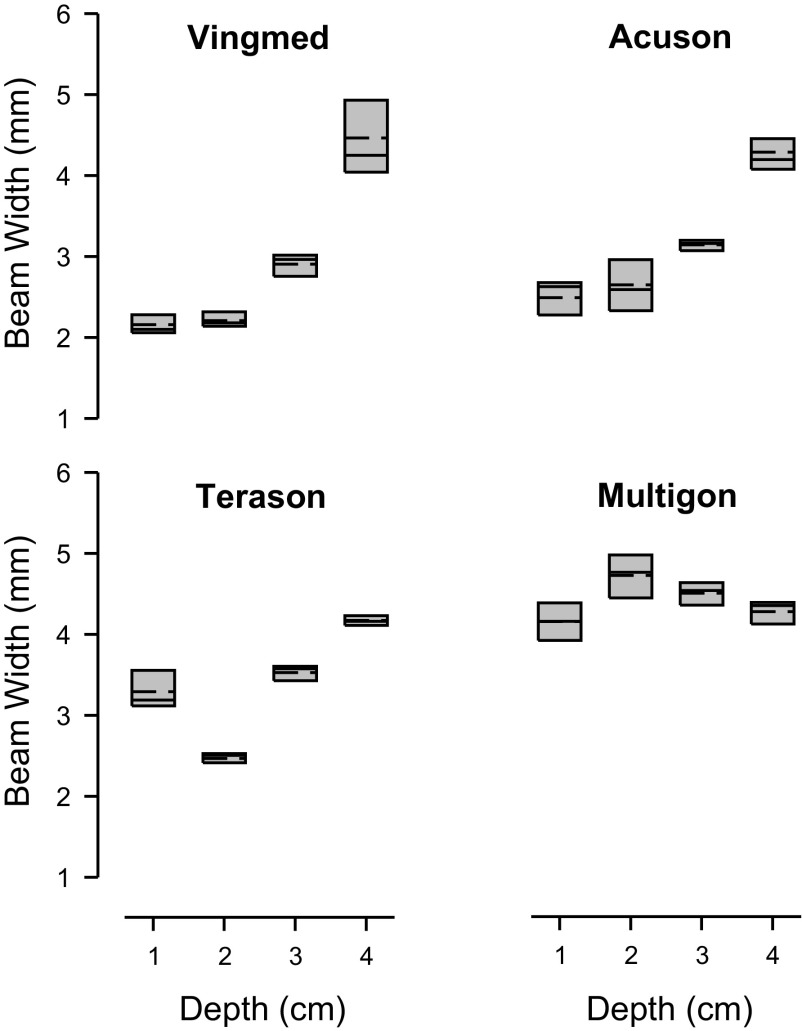
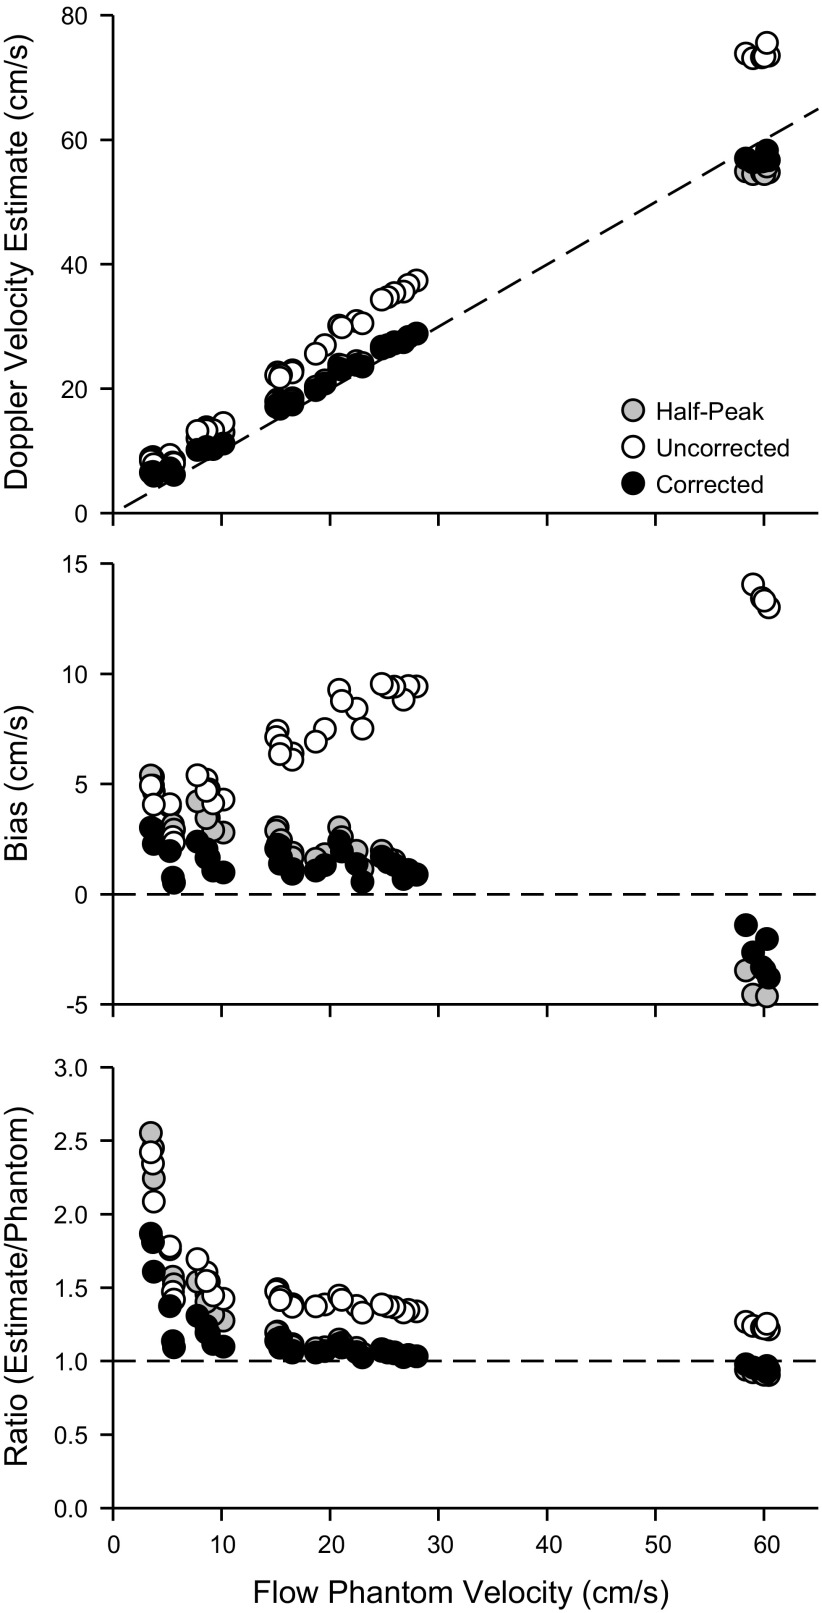
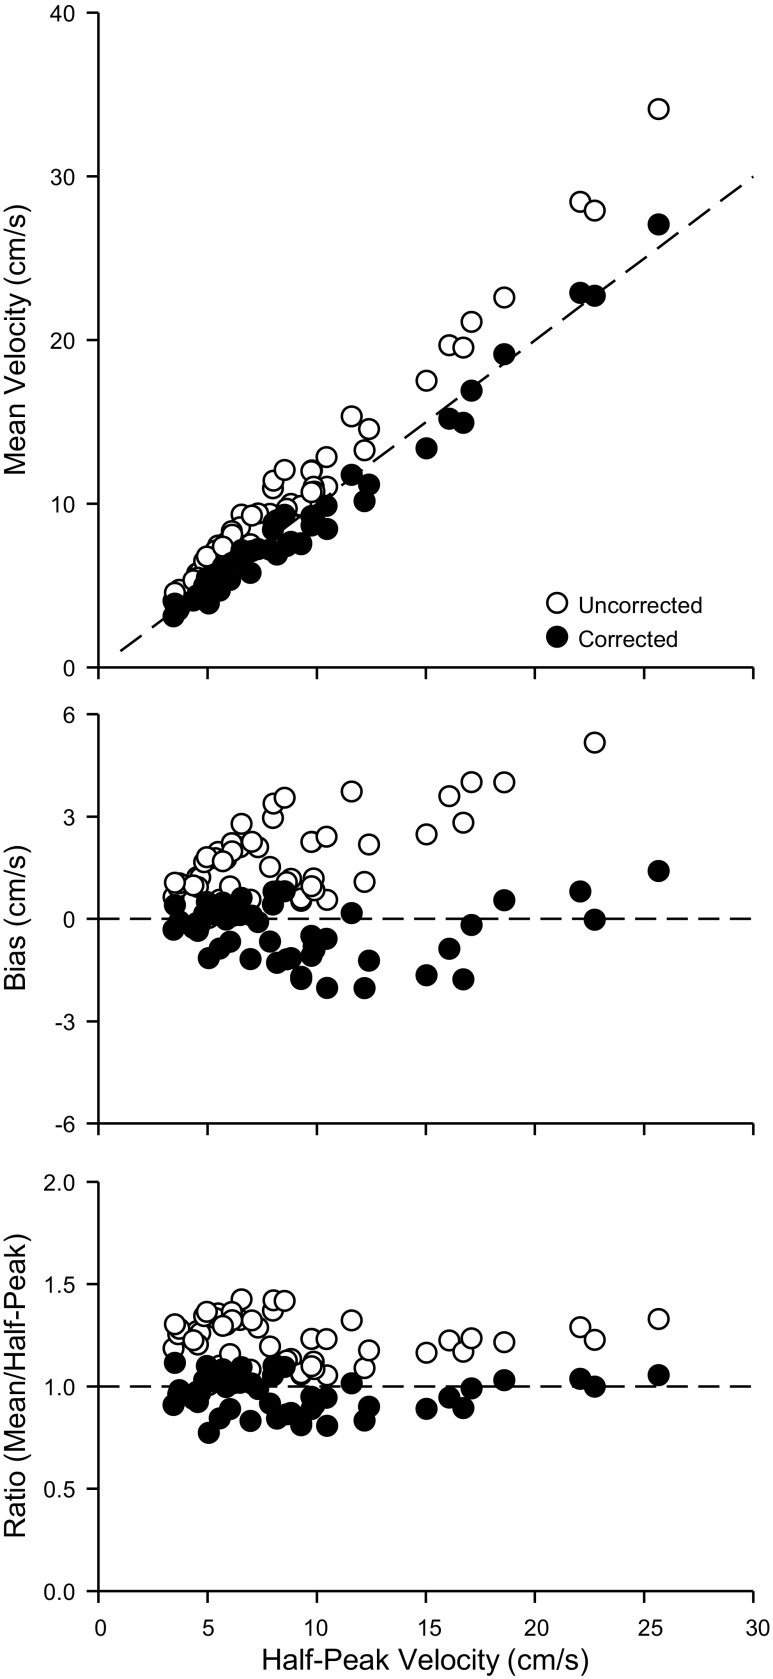
It has been predicted that the development of thin-beam ultrasound could lead to an overestimation of mean blood velocity by up to 33% as beam width approaches 0% of vessel diameter. If both beam and vessel widths are known, in theory, this overestimation may be correctable. Therefore, we updated a method for determining the beam width of a Doppler ultrasound system, tested the utility of this technique and the information it provides to reliably correct for the error in velocity measurements, and explored how error-corrected velocity estimates impact the interpretation of in vivo data. Using a string phantom, we found the average beam width of four different probes varied across probes from 2.93 ± 0.05 to 4.41 ± 0.06 mm (mean ± SD) and with depth of insonation. Using this information, we tested the validity of a calculated correction factor to minimize the thin-beam error in mean velocity observed in a flow phantom with known diameter. Use of a correction factor reduced the overestimation from 39 ± 11 to 7 ± 9% (P < 0.05). Lastly, in vivo we explored how knowledge of beam width improves understanding of physiological flow conditions. In vivo, use of a correction factor reduced the overestimation of mean velocity from 23 ± 11 to -4 ± 9% (P < 0.05). Thus this large source of error is real, has been largely ignored by the early adaptors of Doppler ultrasound for vascular physiology studies in humans, and is correctable by the described techniques.

Keywords: Doppler; blood flow velocity; duplex; hemodynamics; regional blood flow; ultrasonography.


Figures

Fig. 1.
Fig. 1.
Model of parabolic flow as assessed by a finite-width ultrasound beam. A: predicted parabolic velocity profile during steady-state laminar flow across a vessel with a 4-mm diameter, a mean velocity of 5 cm/s, and a peak velocity of 10 cm/s [velocity at position r = peak velocity (1 − r2/radius2)]. B: velocity profile observed by an ultrasound beam with a beam width of 2 mm. While peak velocity remains 10 cm/s, the observed mean velocity would be 6.36 cm/s, representing a 22.6% overestimation of the true mean velocity. C: error in measuring mean velocity that is predicted by the equation of Evans (5) as a function of beam width. The horizontal dashed line highlights that the overestimation approaches an asymptote at 33% overestimation as the beam width becomes infinitely narrow relative to the vessel diameter. The vertical dashed line indicates the overestimation for the example in B, where the beam width is one-half the vessel diameter.
Fig. 2.
Fig. 2.
Representative data for determination of beam width. A: raw data [the root mean square (RMS) volume of the returned signal] from one trial obtained during phase 1. B: the same data after normalization and smoothing, with the piecewise model solution superimposed. C: the piecewise model solution with the beam width and phantom width indicated.
Fig. 3.
Fig. 3.
Box plots of the beam width for four ultrasound systems. Bam width was determined at each of four depths as indicated. Boundary of the box closest to zero denotes 25th percentile, solid line within the box denotes median, dashed line denotes mean, and the boundary of the box farthest from zero denotes 75th percentile. Median beam width at each depth was used for subsequent correction of mean velocities.
Fig. 4.
Fig. 4.
In vitro Doppler mean velocity estimates. Top: uncorrected mean velocity (open circles), corrected mean velocity (solid circles), and half-peak velocity (shaded circles) vs. flow phantom mean velocity. Dashed line represents the line of identity. Middle: bias between uncorrected mean velocity, corrected mean velocity, and half-peak velocity relative to flow phantom mean velocity (calculated as Doppler estimate minus flow phantom mean velocity). Dashed line represents bias of 0. Bottom: ratio of the Doppler estimate to the flow phantom mean velocity. Dashed line represents a ratio of 1 to 1.
Fig. 5.
Fig. 5.
In vivo Doppler mean velocity estimates. Top: uncorrected mean velocity (open circles) and corrected mean velocity (solid circles) vs. half-peak velocity. Dashed line represents the line of identity. Middle: bias between uncorrected mean velocity and corrected mean velocity relative to half-peak velocity (calculated as corrected or uncorrected mean minus half-peak). Dashed line represents bias of 0. Bottom: ratio of the uncorrected or corrected mean velocity to the half-peak velocity. Dashed line represents a ratio of 1 to 1.

References

    1. Ade CJ, Broxterman RM, Wong BJ, Barstow TJ. Antegrade and retrograde blood velocity profiles in the intact human cardiovascular system. Exp Physiol 97: 849–860, 2012. - PubMed
    1. Barrett-O'Keefe Z, Ives SJ, Trinity JD, Morgan G, Rossman MJ, Donato AJ, Runnels S, Morgan DE, Gmelch BS, Bledsoe AD, Richardson RS, Wray DW. Taming the “sleeping giant”: the role of endothelin-1 in the regulation of skeletal muscle blood flow and arterial blood pressure during exercise. Am J Physiol Heart Circ Physiol 304: H162–H169, 2013. - PMC - PubMed
    1. Brothers RM, Haslund ML, Wray DW, Raven PB, Sander M. Exercise-induced inhibition of angiotensin II vasoconstriction in human thigh muscle. J Physiol 577: 727–737, 2006. - PMC - PubMed
    1. Evans DH, McDicken WN. Doppler Ultrasound: Physics, Instrumentation and Signal Processing (2nd Ed.). New York: Wiley, 2000.
    1. Evans DH. Some aspects of the relationship between instantaneous volumetric blood flow and continuous wave Doppler ultrasound recordings. I. The effect of ultrasonic beam width on the output of maximum, mean and RMS frequency processors. Ultrasound Med Biol 8: 605–609, 1982. - PubMed

Publication types

MeSH terms

LinkOut - more resources