. 2014 Mar 28;289(13):9380-95.
doi: 10.1074/jbc.M114.548602. Epub 2014 Feb 20.

Reticulon 4 is necessary for endoplasmic reticulum tubulation, STIM1-Orai1 coupling, and store-operated calcium entry

Affiliations

Reticulon 4 is necessary for endoplasmic reticulum tubulation, STIM1-Orai1 coupling, and store-operated calcium entry

Levente Jozsef et al. J Biol Chem. .

Abstract

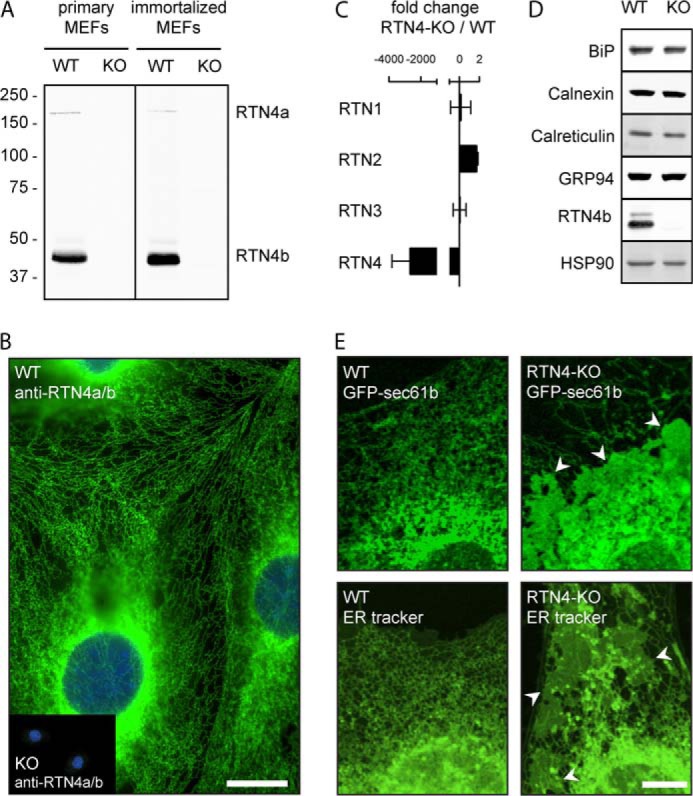
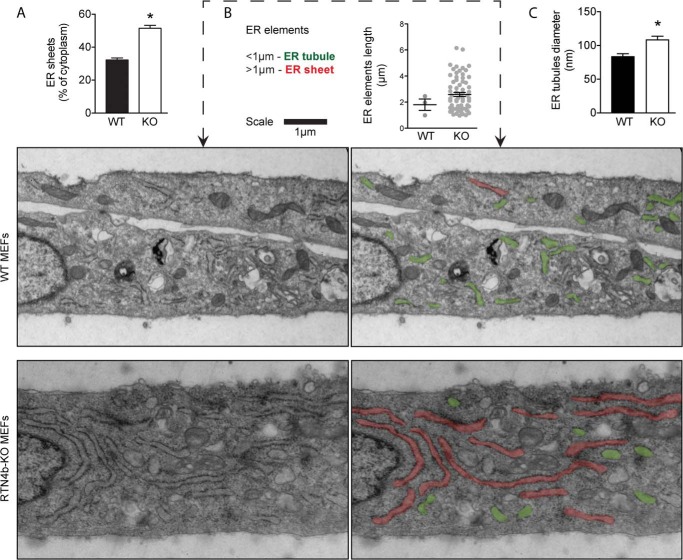
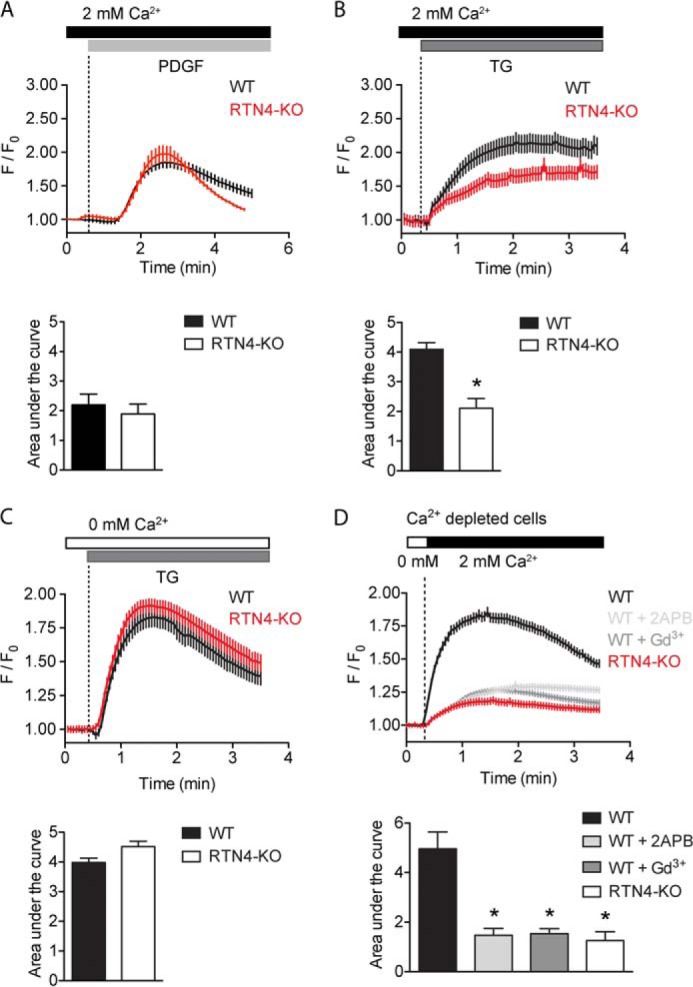
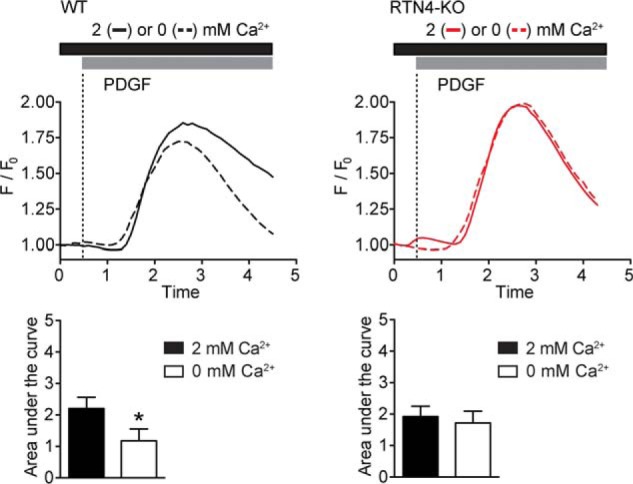
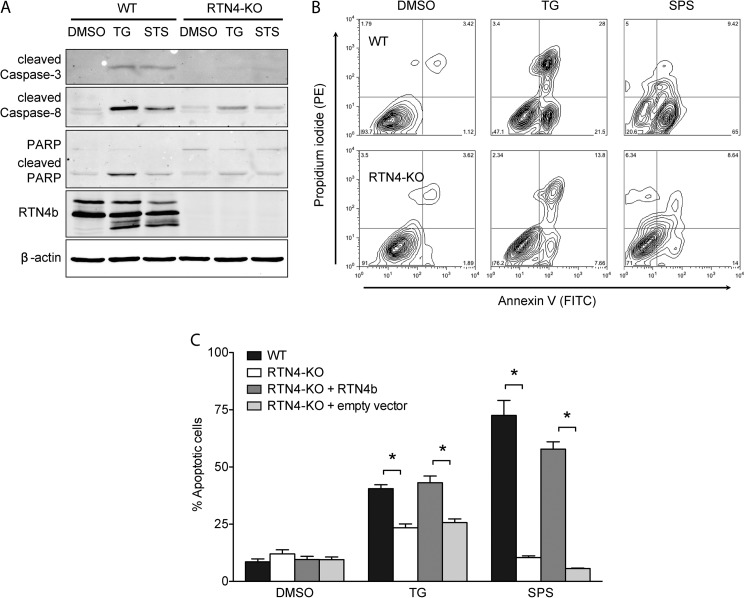
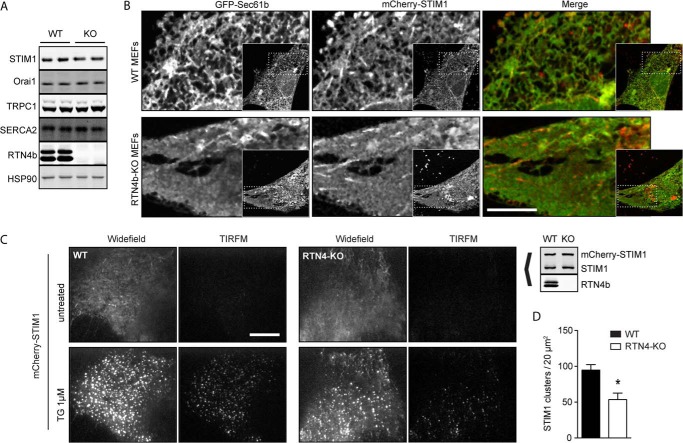
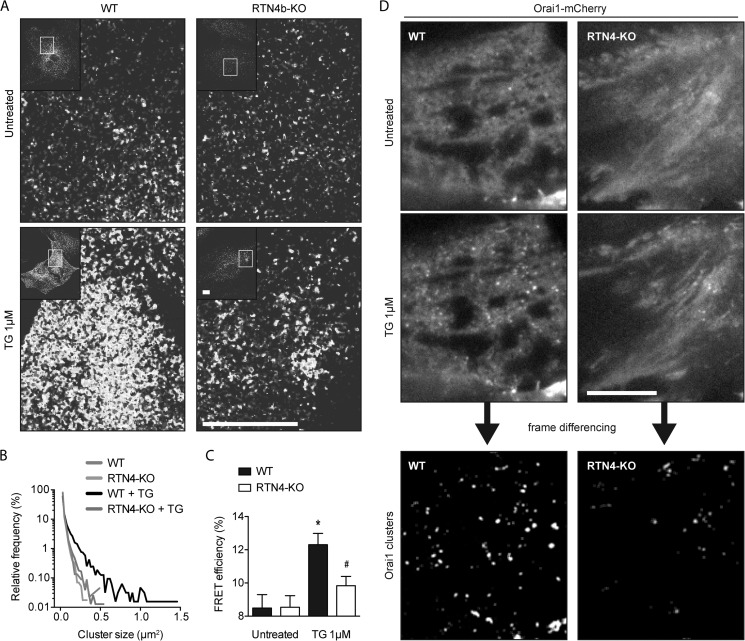
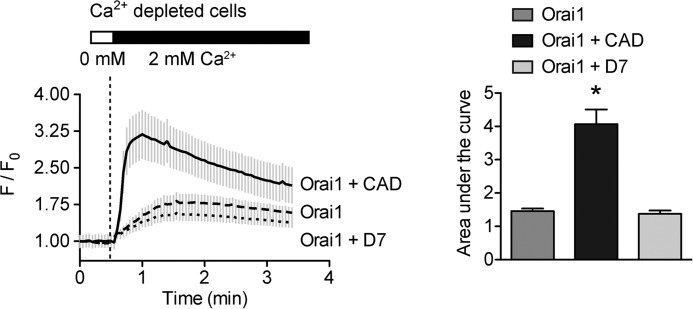
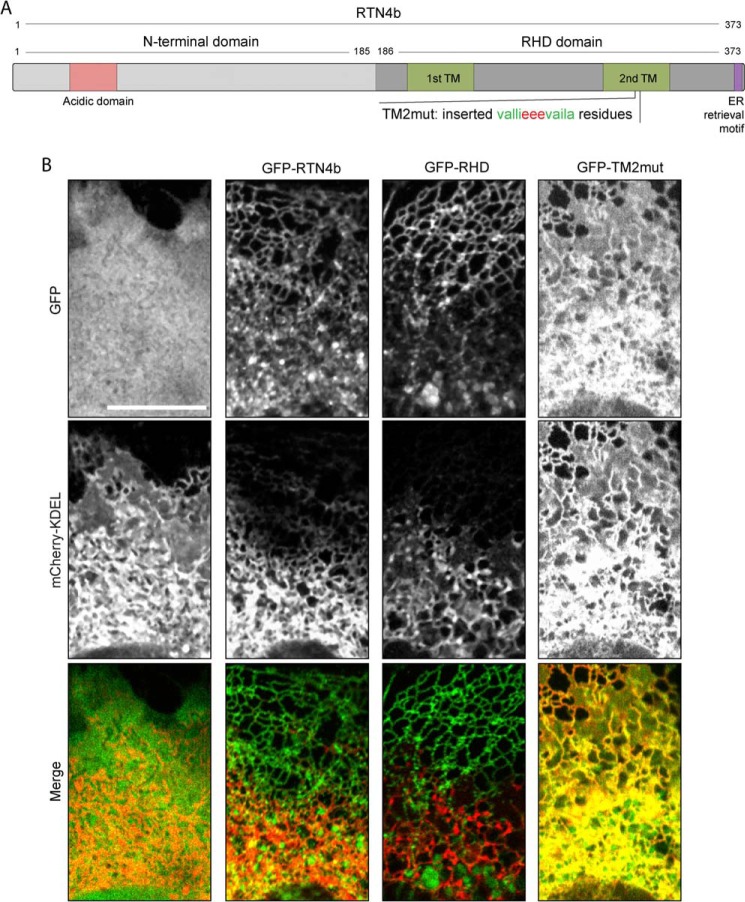
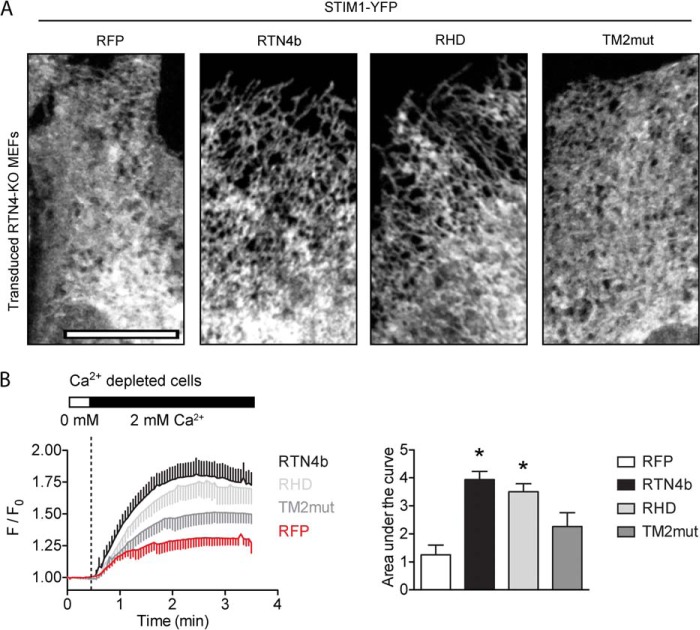
Despite recent advances in understanding store-operated calcium entry (SOCE) regulation, the fundamental question of how ER morphology affects this process remains unanswered. Here we show that the loss of RTN4, is sufficient to alter ER morphology and severely compromise SOCE. Mechanistically, we show this to be the result of defective STIM1-Orai1 coupling because of loss of ER tubulation and redistribution of STIM1 to ER sheets. As a functional consequence, RTN4-depleted cells fail to sustain elevated cytoplasmic Ca(2+) levels via SOCE and therefor are less susceptible to Ca(2+) overload induced apoptosis. Thus, for the first time, our results show a direct correlation between ER morphology and SOCE and highlight the importance of RTN4 in cellular Ca(2+) homeostasis.

Keywords: Apoptosis; Cell Signaling; Endoplasmic Reticulum (ER); Imaging; Membrane; reticulons.


Figures

FIGURE 1.
FIGURE 1.
Loss of RTN4a/b alters ER morphology. A, Western blots of primary (left) or immortalized (right) WT and RTN4-KO (referred to here as KO) MEFs probed with anti-RTN4a/b. B, epifluorescence imaging of WT and RTN4-KO (inset, referred to here as KO) MEFs fixed and immunostained for RTN4a/b and stained with DAPI. Scale bar, 20 μm. C, quantitative real-time PCR analysis of reticulon transcripts expression levels in RTN4-KO relative to WT MEFs, n = 3. D, Western blot analysis of ER markers in WT and RTN4-KO (referred to here as KO) MEFs. Cell extracts were probed for both luminal (BiP, calreticulin, and GRP94) and membrane-integral (calnexin) proteins. HSP90 and RTN4b were used for controls. E, WT or RTN4-KO MEFs were transfected with GFP-Sec61b (top panels) or stained with ER-tracker (bottom panels) and visualized by confocal microscopy. Scale bar, 10 μm.
FIGURE 2.
FIGURE 2.
Loss of RTN4a/b alters ER morphology and ER tubules diameter. A, quantification of ER sheets present in WT and RTN4-KO MEFs. ER-tracker was used to delineate ER sheets. ER sheet area was subtracted from cytosol area (cell area − nucleus area) and expressed as % of cytoplasm. Values are mean ± S.E. of data collected from 25–30 cells in each group from three independent experiments. B, thin section EM micrographs of Epon embedded WT (top panels) and RTN4-KO MEFs (bottom panels). ER elements shorter (green) and longer (red) than 1 μm are indicated. Dot graphs represent the length of ER elements (>1 μm) observed in 10 cell sections from WT and RTN4-KO MEFs. Mean ± S.E. is indicated for each group. C, ER tubules diameter in WT and RTN4-KO MEFs. Values are mean ± S.E. of data collected from 10 cell-sections in each group. *, p < 0.05 compared with WT MEFs, Student's t test.
FIGURE 3.
FIGURE 3.
Triglyceride synthesis and LD formation are unaffected in RTN4-KO MEFs. A, thin-layer chromatogram of triglycerides prepared from untreated or oleic acid-treated (24 h) WT and RTN4-KO MEFs. Lane 1 represents triacylglycerol from purified standards. Bar graphs represent the quantitative densitometry mean ± S.E. of three independent experiments. B, confocal analysis of LD in WT (top panels) and RTN4-KO (bottom panels) MEFs untreated or treated with oleic acid. LD were labeled with BODIPY 493/503 and cell nuclei with DAPI. C, quantification of LD in oleate-loaded WT and RTN4-KO MEFs based on BODIPY 493/503 fluorescence intensity in the cytoplasm. Values are mean ± S.E. of data collected from 10 cells in each experimental condition from three independent experiments.
FIGURE 4.
FIGURE 4.
The unfolded protein response is unaltered in RTN4-KO MEFs. A, representative immunoblot of proteolytic cleavage of full-length ATF6 during UPR induction with TG in WT and RTN4-KO MEFs. Bar graphs represent the cumulative quantitative densitometry from three independent experiments. B, Xbp1 and C, spliced Xbp1 mRNA expression in response to TG in WT and RTN4-KO MEFs analyzed by Q-PCR. D, representative immunoblot of JNK1/2 phosphorylation and E, eIF2α phosphorylation during UPR induction with TG in WT and RTN4-KO MEFs. Bar graphs represent the cumulative quantitative densitometry from three independent experiments. F, ATF4 mRNA expression in response to TG in WT and RTN4-KO MEFs analyzed by Q-PCR. Data presented as mean ± S.E.
FIGURE 5.
FIGURE 5.
Loss of RTN4a/b reduces SOCE. A and B, increase in cytosolic Ca2+ in response to 10 ng/ml PDGF (A) or 1 μm TG (B) in WT and RTN4-KO MEFs in the presence of extracellular Ca2+. C, increase in cytosolic Ca2+ in response to TG induced depletion of internal stores in the absence of extracellular Ca2+. D, SOCE assessed by re-addition of extracellular Ca2+ to stores-depleted cells. Inhibition of SOCE was carried out in WT MEFs exposed to vehicle or CRAC inhibitors 2APB (50 μm) or gadolinium (10 μm). A–D, calcium traces represent the average response of 25–30 cells per triplicate from a single experiment. F/F0, change in fluorescence intensity relative to baseline. Areas under the curve were calculated after treatment or re-addition of external Ca2+. Data represent the mean ± S.E. of 4–6 independent experiments. *, p < 0.05 compared with WT MEFs, Student's t test.
FIGURE 6.
FIGURE 6.
Absence of SOCE from PDGF-induced Ca2+ transient in RTN4-KO MEFs. Increase in cytosolic Ca2+ in response to 10 ng/ml PDGF in WT (left panels) and RTN4-KO (right panels) MEFs in the presence or absence of extracellular Ca2+. Calcium traces represent the average response of 25–30 cells per triplicate from a single experiment. F/F0, change in fluorescence intensity relative to baseline. Areas under the curve were calculated as an estimate of mobilized Ca2+. Data represent the mean ± S.E. of three independent experiments. *, p < 0.05 compared with response in presence of extracellular Ca2+, Student's t test.
FIGURE 7.
FIGURE 7.
RTN4-KO MEFs are resistant to Ca2+ overload triggered apoptosis. A, cells were treated with vehicle, 1 μm TG for 24 h, or 0.1 μm STS for 10 h, and lysates were probed for caspase-3, -8, and cleaved PARP. β-Actin and RTN4b were used as controls. B, representative flow cytometry density plots of WT (top panels) and RTN4-KO (bottom panels) cells assessed for apoptosis by annexin-V and PI staining after treatment with vehicle (left panels) or 1 μm TG for 24 h (middle panels) or 0.1 μm STS for 10 h (right panels). Bottom right quadrants are representative of early apoptotic and top right quadrants of late apoptotic cells. C, quantification of apoptosis (defined as annexin-V-positive cells) from measurements obtained in B for WT, RTN4-KO, and RTN4-KO MEFs reconstituted with empty vector or RTN4b. Data are presented as mean ± S.E. of four independent experiments. *, p < 0.05, two-way ANOVA followed by Tukey's post hoc test.
FIGURE 8.
FIGURE 8.
Loss of RTN4a/b alters STIM1 distribution and reduces STIM1 clustering. A, Western blot analysis of components of the store-operated calcium influx complex in WT and RTN4-KO (referred to here as KO) MEFs. Cell extracts were immunobloted for STIM1 and Orai1 as well as TRPC1 and SERCA. HSP90 and RTN4b were used for controls. B, live cell confocal images of WT (top panels) and RTN4-KO (bottom panels) MEFs expressing Sec61b-GFP and mCherry-STIM1. Scale bar, 10 μm. C, live cell imaging of mCherry-STIM1-transfected WT and RTN4-KO MEFs by TIRFM. Cells were incubated in Ca2+-free solution, and mCherry-STIM1-positive cells were imaged in widefield and TIRF mode before and after treatment with 1 μm TG. D, quantification of imaged acquired in C in TIRF mode for the number of STIM1 clusters in triplicate 20 μm2 areas per cell. Data are presented as mean ± S.E. of 10 cells. *, p < 0.05 compared with WT MEFs.
FIGURE 9.
FIGURE 9.
Endogenous STIM1 function is defective in RTN4-KO MEFs. A, confocal images of untreated or 1 μm TG-treated WT and RTN4-KO MEFs fixed and immunostained for endogenous STIM1. Scale bars, 20 μm. B, relative frequency distribution of STIM1 cluster size derived from images acquired in A using ImageJ particle analysis tool. C, Orai1-Orai1 FRET efficiency in fixed WT and RTN4-KO MEFs before and after store depletion. Transfected cells were either left untreated or incubated in Ca2+-free solution with 1 μm TG for 10 min and analyzed for FRET. 10 cells were analyzed in each experimental condition. Data are presented as mean ± S.E. of three independent experiments. *, p < 0.05 compared with untreated WT MEFs, #, p < 0.05 compared with treated WT MEFs; two-way ANOVA followed by Tukey's post hoc test. D, live cell imaging of Orai1-mCherry clustering in WT and RTN4-KO MEFs by TIRFM. Orai1-mCherry-positive cells were imaged in TIRF mode before and after treatment with 1 μm TG in the absence of extracellular Ca2+. Frame differencing was used to highlight the visual appearance of Orai1 clusters induced by TG.
FIGURE 10.
FIGURE 10.
Bypassing defective endogenous STIM1 rescues SOCE in RTN4-KO MEFs. RTN4-KO MEFs transiently overexpress Orai1 alone or in combination with the soluble CAD domain of STIM1 or an inactive form of that domain (referred to here as D7) were depleted of their internal Ca2+ stores and SOCE was measured upon re-addition of extracellular Ca2+. Calcium traces represent the average response of 10 transfected cells from a single experiment. F/F0, change in fluorescence intensity relative to baseline. Areas under the curve were calculated after re-addition of external Ca2+. Data are presented as mean ± S.E. of three independent experiments. *, p < 0.05 compared with WT MEFs, Student's t test.
FIGURE 11.
FIGURE 11.
Manipulation of ER morphology in RTN4-KO MEFs. A, schematic representation of full length RTN4b, and variants thereof, used in the present work. B, ER morphology of RTN4-KO MEFs transiently overexpressing constructs illustrated in A. RTN4-KO MEFs transiently overexpressing GFP, GFP-RTN4b, GFP-RHD, or GFP-TM2mut, in combination with mCherry-KDEL imaged by confocal microscopy.
FIGURE 12.
FIGURE 12.
Restoring ER tubulation rescues defective SOCE in RTN4-KO MEFs. A, STIM1-YFP distribution in RTN4-KO MEFs expressing various RTN4b constructs. Stable cell-lines of RTN4-KO MEFs expressing RFP, RTN4b, RHD, or TM2mut were transiently transfected with STIM1-YFP, and its distribution was visualized using confocal microscopy. B, SOCE in RTN4-KO lentivirally transduced with RFP, RTN4b, RHD, or TM2mut. SOCE assessed by re-addition of extracellular Ca2+ to stores-depleted cells. Calcium traces representing the average response of 25–30 cells from a single experiment. F/F0, change in fluorescence intensity relative to baseline. Areas under the curve were calculated after re-addition of external Ca2+. Data represent the mean ± S.E. of three independent experiments. *, p < 0.05 compared with RTN4-KO MEFs expressing RFP, Student's t test.

References

    1. Goyal U., Blackstone C. (2013) Untangling the web: Mechanisms underlying ER network formation. Biochim. Biophys. Acta 1833, 2492–2498 - PMC - PubMed
    1. Park S. H., Blackstone C. (2010) Further assembly required: construction and dynamics of the endoplasmic reticulum network. EMBO Rep. 11, 515–521 - PMC - PubMed
    1. Shibata Y., Shemesh T., Prinz W. A., Palazzo A. F., Kozlov M. M., Rapoport T. A. (2010) Mechanisms determining the morphology of the peripheral ER. Cell 143, 774–788 - PMC - PubMed
    1. Lee C., Chen L. B. (1988) Dynamic behavior of endoplasmic reticulum in living cells. Cell 54, 37–46 - PubMed
    1. West M., Zurek N., Hoenger A., Voeltz G. K. (2011) A 3D analysis of yeast ER structure reveals how ER domains are organized by membrane curvature. J. Cell Biol. 193, 333–346 - PMC - PubMed

MeSH terms