. 2014 May;28(5):2369-79.
doi: 10.1096/fj.13-248021. Epub 2014 Feb 20.

Progressive dysfunction of the retinal pigment epithelium and retina due to increased VEGF-A levels

Affiliations

Progressive dysfunction of the retinal pigment epithelium and retina due to increased VEGF-A levels

Zsolt Ablonczy et al. FASEB J. 2014 May.

Abstract

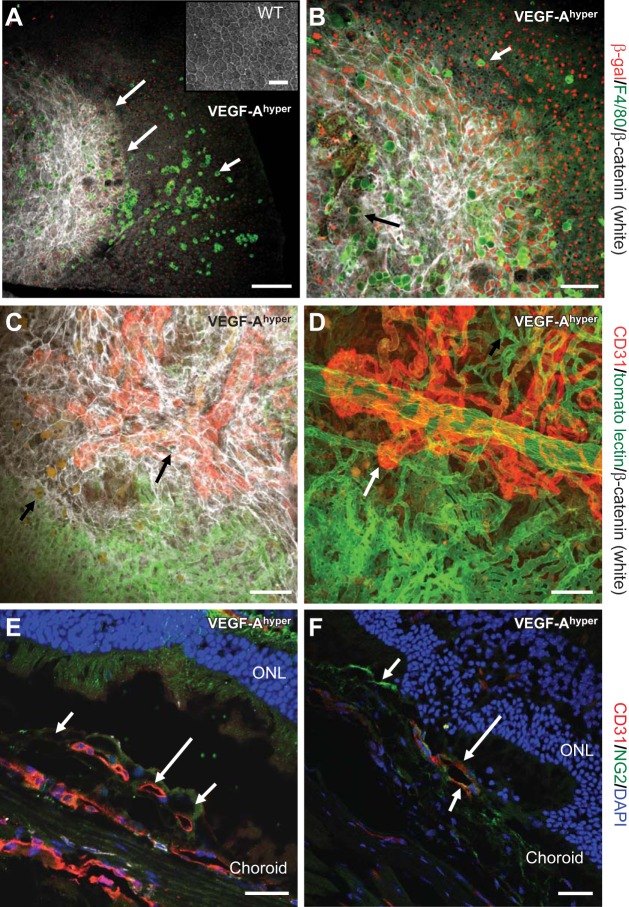
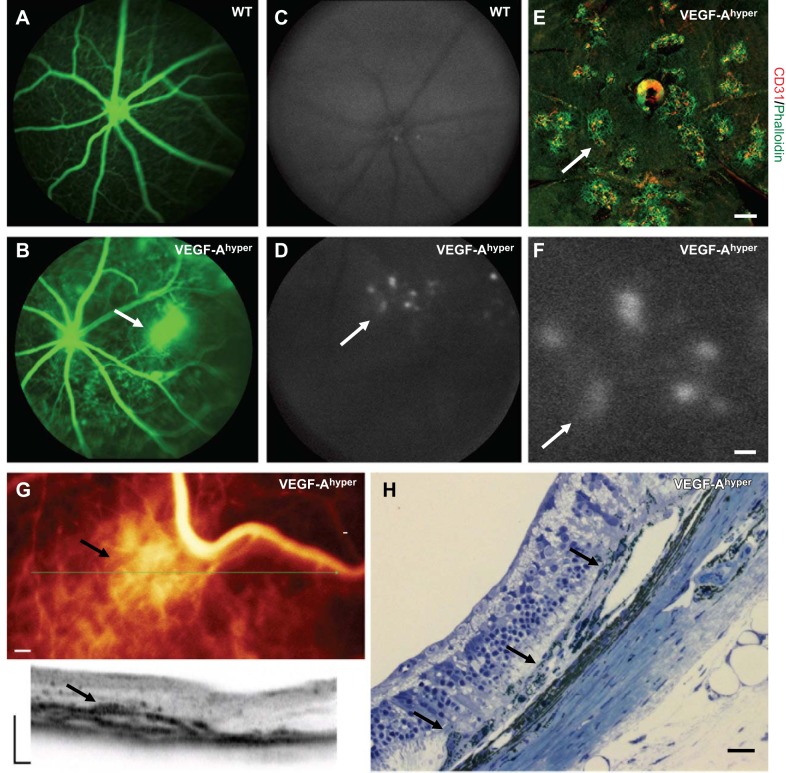
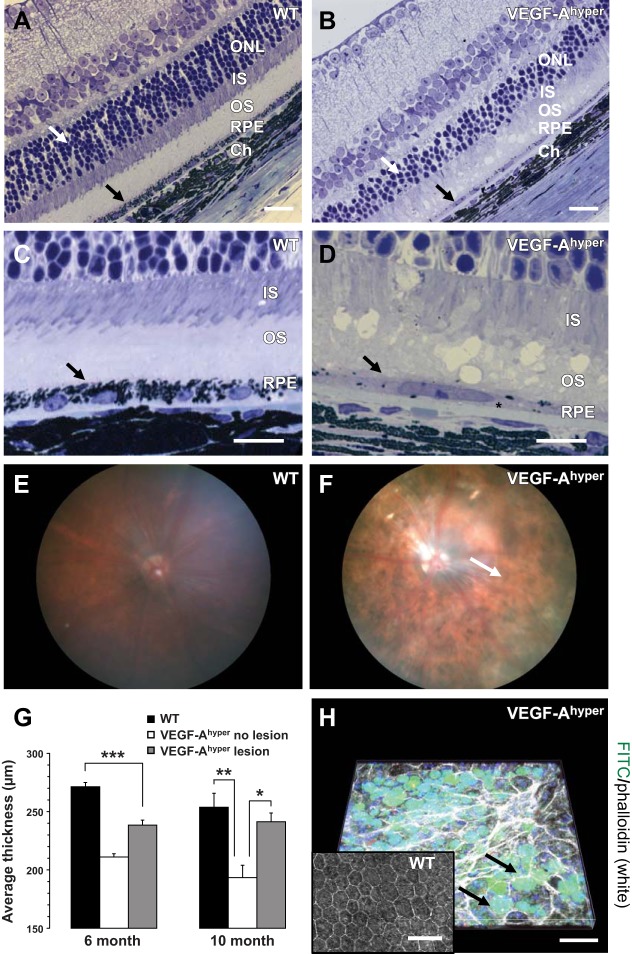
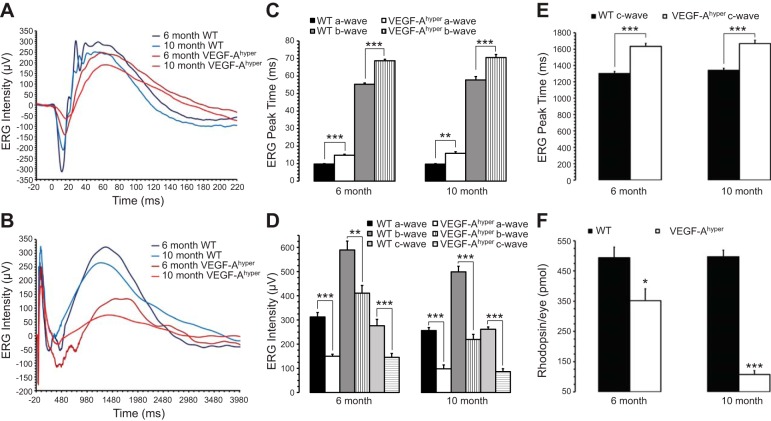
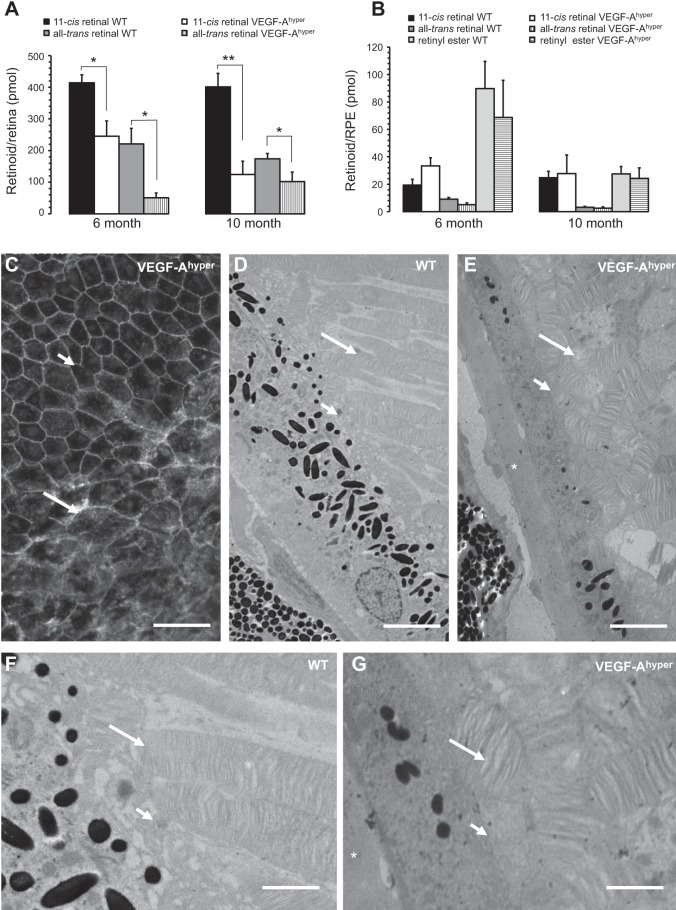
Patients with nonexudative ("dry") age-related macular degeneration (AMD) frequently also develop neovascular ("wet") AMD, suggesting a common pathomechanism. Increased vascular endothelial growth factor A (VEGF-A) has been implicated in the pathogenesis of choroidal neovascularization (CNV) in neovascular AMD, while its role in nonexudative AMD that manifests with progressive retinal pigment epithelium (RPE) and photoreceptor degeneration is not well defined. Mice with overall increased VEGF-A levels develop progressive morphological features of both forms of AMD, suggesting that an increase in VEGF-A has a direct age-dependent adverse effect on RPE and photoreceptor function independently of its CNV-promoting proangiogenic effect. Here we provide evidence for this hypothesis and show that morphological RPE abnormalities and retinal thinning in mice with increased VEGF-A levels correlate with progressive age-dependent attenuation of visual function with abnormal electroretinograms and reduced retinal rhodopsin levels. Retinoid profiling revealed a progressive reduction of 11-cis and all-trans retinal in the retinas of these mice, consistent with an impaired retinoid transport between the RPE and photoreceptors. These findings suggest that increased VEGF-A leads to an age-dependent RPE and retinal dysfunction that occurs also at sites where no CNV lesions form. The data support a central role of increased VEGF-A not only in the pathogenesis of neovascular but also of nonexudative AMD.

Keywords: age-related macular degeneration; choroidal neovascularization; retinoids; visual cycle.


Figures

Figure 1.
Figure 1.
Progressive RPE barrier breakdown and CNV lesion formation in mice with increased VEGF-A levels. A, B) Choroidal flat mount of a 21-mo-old black VEGF-Ahyper mouse. RPE barrier breakdown (indicated as increased β-catenin labeling in white, demarcated by long arrows in A) in VEGF-Ahyper mice is shown with loss of the regular honeycomb RPE cell morphology and by increased cytoplasmic β-catenin labeling (white). In this mouse, almost the entire posterior central fundus shows RPE barrier breakdown with increased β-catenin labeling. F4/80+ macrophages (bright green, short arrow) infiltrate the subretinal space at the site of RPE barrier breakdown. Round autofluorescent sub-RPE deposits (dim green, black arrow in B) are observed at sites of RPE barrier breakdown as well. Red nuclear staining shows labeling for β-galactosidase in these mice, representing VEGF-A expression in pigmented RPE cells (VEGF-Ahyper mice express β-galactosidase from the endogenous VEGF-A locus). Notably, F4/80+ macrophages are β-galactosidase negative. Inset: WT choroidal flat mount with regular honeycomb appearance of RPE cells. C) CNV lesion formation in VEGF-Ahyper mice with neovascularization evolving from choroidal vessels. White VEGF-Ahyper mouse perfused with FITC-tomato lectin and subsequently immunolabeled for CD31 (red) and β-catenin (white). Green vessels represent perfused normal choroidal vasculature, while CD31+ red neovessels originate from the normal choroidal vasculature and form CNV lesions. This CNV lesion formation (red, CD31+vessels, long arrow) occurs at sites of RPE barrier breakdown (white, increased β-catenin). Bottom part of image shows normal choroidal vasculature (green) covered by normal RPE (regular β-catenin labeling); top part shows neovessels (CD31+ in red) covered by irregular RPE cells with increased β-catenin labeling. Autofluorescent sub-RPE deposits appear at sites of RPE barrier breakdown (short arrow). D) Strongly CD31 expressing neovessels (red, long arrow), originating from underlying choroidal vessels (green, FITC-tomato lectin perfusion). White VEGF-Ahyper mouse, age 15 mo, with nonpigmented RPE cells. E) CNV lesions in black VEGF-Ahyper mice protrude into the subretinal space and are CD31+. Frozen section shows CD31+ (red) CNV into the subretinal space (long arrow). Pigmented RPE cells indicated by short arrows. ONL, outer nuclear layer of photoreceptors. F) Vessels in CNV lesions are CD31+ (red, CD31, long arrow) and surrounded in part by NG2+ cells (NG2, green; short arrows). Nuclei labeled blue with DAPI. Black VEGF-Ahyper mouse, age 12 mo. Scale bars = 200 μm (A); 100 μm (B–D); 50 μm (E, F).
Figure 2.
Figure 2.
Fundus imaging in VEGF-Ahyper mice shows CNV resembling findings in neovascular AMD. A, B) Fluorescence angiography shows a neovascular lesion (B, arrow) with fluorescein leakage in a 6-mo-old VEGF-Ahyper mouse, which is not observed in WT control littermate mice (A). C, D) Increased multifocal fundus autofluorescence (arrow) is noticed in VEGF-Ahyper mice (D), but not in WT control mice (C). E) Multifocal CNV lesions (arrow) can be seen in choroidal flat-mount stainings in VEGF-Ahyper mice. CNV lesions show strong staining for neovessels with CD31 (red) at sites of RPE barrier breakdown (phalloidin, green). F) Higher magnification of fundus image shown in D (arrows indicate same lesion with increased fluorescence). Area of increased fluorescence is about the same size as CNV lesions observed by choroidal flat-mount staining (as in E). G) OCT imaging of the fundus of a 10-mo-old VEGF-Ahyper mouse shows a CNV lesion (arrow). Representative image section through this lesion is shown (plane of section through green line indicated, arrow), while adjacent RPE/retina appear normal. H) The in vivo OCT findings reflect the histological findings in these mice that show neovascular CNV membranes with RPE abnormalities (arrows). Scale bars = 200 μm (E–G); 20 μm (H).
Figure 3.
Figure 3.
Generalized RPE and retinal abnormalities in aged VEGF-Ahyper mice. A–D) Retinal thinning in aged (21-mo-old) VEGF-Ahyper mice is primarily due to loss of photoreceptors with attenuation of the outer nuclear layer (ONL; A, B; white arrows) and the photoreceptor outer segment (OS) and inner segment (IS). Notably, RPE atrophy with loss of pigment granules is noticed in mutant mice (B, black arrow). Sub-RPE deposits in mutant mice resemble basal laminar deposits (D, asterisk). Black arrows indicate RPE. C, D) Higher-magnification images from same eyes as shown in A and B, respectively. Ch, choroid. E, F) Fundus imaging of WT (E) and VEGF-Ahyper (F) mice reveals generalized pigmentary abnormalities of the RPE with patchy areas of hypopigmentation in VEGF-Ahyper mice (F). Areas of hypopigmentation (white arrow) in the fundus images correlate well with the microscopic findings of RPE cell atrophy and focal pigment loss in RPE cells of VEGF-Ahyper mice. G) Measuring retinal thickness in a paracentral location (adjacent to the optic nerve area) by OCT shows a significant thinning of the overall retina in VEGF-Ahyper mice compared to matched control mice, particularly at sites devoid of CNV lesions. Bars represent means ± sd. *P < 0.05, **P < 0.01, ***P < 0.001. H) Confocal microscopy reveals round autofluorescent sub-RPE deposits (appearing as green round deposits when acquired with the fluorescein channel, 488 nm, under the RPE that is apparent by the phalloidin staining in white on top of those deposits) in VEGF-Ahyper mice (arrows). These deposits are not present in WT littermate control mice (inset). Scale bars = 20 μm (A, B); 10 μm (C, D); 50 μm (H).
Figure 4.
Figure 4.
VEGF-Ahyper mice show abnormal ERGs and reduced retinal rhodopsin levels. A, B) Representative ERG traces of 6- and 10-mo-old VEGF-Ahyper mice and WT control mice show delayed peak times and attenuated a-, b-, and c-wave amplitudes in VEGF-Ahyper mice. These differences increase with progressive age and are more pronounced in groups of 10-mo-old mice compared to groups of 6-mo-old mice. C–E) Quantitative measurements of peak times (C, E) and a-, b-, and c-wave amplitudes (D) in 6- and 10-mo-old VEGF-Ahyper mice and WT control mice show consistent statistically significant differences between VEGF-Ahyper and control mice. F) Rhodopsin quantification shows a progressive age-dependent reduction of rhodopsin levels in the retinas of VEGF-Ahyper mice. Loss of rhodopsin accelerates between 6 and 10 mo of age in VEGF-Ahyper mice. Bars represent means ± sd. *P < 0.05, **P < 0.01, ***P < 0.001.
Figure 5.
Figure 5.
Retinoid profiling reveals a defect in the visual cycle with reduction of 11-cis and all-trans retinal levels in the retinas of VEGF-Ahyper mice. A) Retinas of VEGF-Ahyper mice show a reduction of 11-cis and all-trans retinal, which is more pronounced in 10-mo-old mutant mice compared to 6-mo-old mice. Bars represent means ± sd. *P < 0.05, **P < 0.01. B) Retinyl esters in the RPE (RPE/choroid) do not show a significant difference between VEGF-Ahyper mice and control mice. Bars represent means ± sd. C) VEGF-Ahyper mice with these visual cycle defects show an RPE barrier breakdown, demonstrated here by cytoplasmic accumulation of β-catenin staining and loss of typical RPE cell honeycomb morphology (long arrow). Adjacent nonlesional RPE cells (short arrow) maintain normal RPE cell morphology in young (2-mo-old) VEGF-Ahyper mice. Adapted from ref. . D–G). Defects in visual cycle correlate with abnormalities in the interdigitation of apical RPE cell membranes with photoreceptor outer segments in aged (15-mo-old) VEGF-Ahyper mice, shown by electron microscopy. Photoreceptor outer segments in mutant mice (E, G) are highly disorganized and shortened, compared to WT mice (D, F). Long arrows show photoreceptor outer segments. Short arrows show apical RPE cell membranes. Asterisks indicate electron-dense basal laminar sub-RPE deposits. Panels F and G are magnifications of images in D and E, respectively. Scale bars = 75 μm (C); 3 μm (D, E); 1.5 μm (F, G).

Similar articles

Cited by

References

    1. Friedman D. S., O'Colmain B. J., Munoz B., Tomany S. C., McCarty C., de Jong P. T., Nemesure B., Mitchell P., Kempen J. (2004) Prevalence of age-related macular degeneration in the United States. Arch. Ophthalmol. 122, 564–572 - PubMed
    1. Van Leeuwen R., Klaver C. C., Vingerling J. R., Hofman A., de Jong P. T. (2003) The risk and natural course of age-related maculopathy: follow-up at 6 1/2 years in the Rotterdam study. Arch. Ophthalmol. 121, 519–526 - PubMed
    1. Ablonczy Z., Dahrouj M., Tang P. H., Liu Y., Sambamurti K., Marmorstein A. D., Crosson C. E. (2011) Human retinal pigment epithelium cells as functional models for the RPE in vivo. Invest. Ophthalmol. Vis. Sci. 52, 8614–8620 - PMC - PubMed
    1. Marneros A. G. (2013) NLRP3 inflammasome blockade inhibits VEGF-A-induced age-related macular degeneration. Cell Rep. 4, 945–958 - PMC - PubMed
    1. Bird A. C., Bressler N. M., Bressler S. B., Chisholm I. H., Coscas G., Davis M. D., de Jong P. T., Klaver C. C., Klein B. E., Klein R., et al. (1995) An international classification and grading system for age-related maculopathy and age-related macular degeneration. The International ARM Epidemiological Study Group. Surv. Ophthalmol. 39, 367–374 - PubMed

Publication types

MeSH terms

LinkOut - more resources