. 2014 Feb 18;9(2):e81186.
doi: 10.1371/journal.pone.0081186. eCollection 2014.

Genome-wide binding patterns of thyroid hormone receptor beta

Affiliations

Genome-wide binding patterns of thyroid hormone receptor beta

Stephen Ayers et al. PLoS One. .

Abstract

Thyroid hormone (TH) receptors (TRs) play central roles in metabolism and are major targets for pharmaceutical intervention. Presently, however, there is limited information about genome wide localizations of TR binding sites. Thus, complexities of TR genomic distribution and links between TRβ binding events and gene regulation are not fully appreciated. Here, we employ a BioChIP approach to capture TR genome-wide binding events in a liver cell line (HepG2). Like other NRs, TRβ appears widely distributed throughout the genome. Nevertheless, there is striking enrichment of TRβ binding sites immediately 5' and 3' of transcribed genes and TRβ can be detected near 50% of T3 induced genes. In contrast, no significant enrichment of TRβ is seen at negatively regulated genes or genes that respond to unliganded TRs in this system. Canonical TRE half-sites are present in more than 90% of TRβ peaks and classical TREs are also greatly enriched, but individual TRE organization appears highly variable with diverse half-site orientation and spacing. There is also significant enrichment of binding sites for TR associated transcription factors, including AP-1 and CTCF, near TR peaks. We conclude that T3-dependent gene induction commonly involves proximal TRβ binding events but that far-distant binding events are needed for T3 induction of some genes and that distinct, indirect, mechanisms are often at play in negative regulation and unliganded TR actions. Better understanding of genomic context of TR binding sites will help us determine why TR regulates genes in different ways and determine possibilities for selective modulation of TR action.


Conflict of interest statement

Competing Interests: The authors have declared that no competing interests exist.

Figures

Figure 1
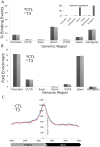
Figure 1. Characterization of genomic binding events.
A. Distributions of TRβ binding peaks across specific genomic regions in the absence (black) and presence (grey) of T3. B. Bar graph representing relative enrichment of TRβ-bound regions within genomic intervals specified. Gene-proximal regions, including promoter regions, 5′UTR regions and downstream regions were highly enriched in TRβ-bound regions of the genome. C. Frequency distribution plot of binding events in regions proximal to transcriptional start sites (TSS) +/−T3 (blue and red, respectively). The x-axis represents nucleotides upstream and downstream of the TSS, y-axis represents numbers of binding events.
Figure 2
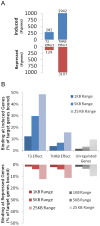
Figure 2. Links between TRβ Binding and regulatory events.
A. Bar graph representing numbers of genes that display positive regulation (upper panel) or negative regulation (lower panel) that met statistical significance and an arbitrary +/−1.7-fold cut-off in an array-based analysis of TRβ-BioChIP cells +/−T3 or in TRβ-BioChIP cells versus parental cells that lack TRβ (THRB effect). B. Bar graph representing percentages of TRβ binding events within 1 KB, 5 KB or 25 KB of the TSS of T3 induced, TRβ induced or unaffected genes (upper panel) or T3 or TRβ repressed genes (lower panel). Progressively lighter shading in the bar graph columns represents increasing distance from the TSS.
Figure 3
Figure 3. Patterns of TRβ binding and transcriptional regulation.
Heatmap depicting log2-transformed expression levels (left) and TRβ binding events within 1 KB, 5 KB or 25 KB of TSS (right) of genes that met statistical significance and an arbitrary +/−2.55-fold cut-off of gene induction in TRβ-BioChIP cells +/−T3. Columns reflect the average of three experimental samples. Expression values in heatmap are as indicated by color scale (bottom, green indicating −5.7-fold repression, red indicating 13-fold induction), and location of binding events within the indicated ranges are depicted by the presence or absence of black bars in the three right-most columns.
Figure 4
Figure 4. Characterization of TRβ binding near induced genes.
A. Patterns of TRβ binding depicted at representations of individual target gene loci (LDLR, BCL3, NCOR2,ADSSL1 and SOX7). Blue bars represent genomic binding regions, and the vertical red lines represent peaks, as classified by QuEST. The horizontal black bars are regions analyzed by ChIP-PCR (locations of primer amplification). Observed binding patterns included 5′, 3′ and intronic binding events, as shown in genomic data tracks (UCSC Genome Browser). Putative regulatory elements, identified through sequence analysis of the genomic regions indicated, are depicted below bound regions in which they occur. B. QPCR of ChIP analysis confirming DNA binding in regulatory regions of genes. C. Realtime PCR analysis depicting enhancement of transcription of individual loci in Fig. 4A by T3 in the presence of TRβ. (*P<0.05 by Student's T-Test).
Figure 5
Figure 5. Definition of TRE Consensus.
A. Consensus sequence with similarity to the classic TRβ binding half-site discovered by analysis of top 150 peaks in BioChIP analysis. B. The previously defined TRβ consensus obtained from analysis of more than 30 published target gene regulatory elements is shown for comparison at right.
Figure 6
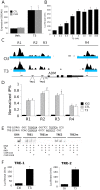
Figure 6. Links between TR Binding and Adm Transcription.
A. Graph showing results of realtime PCR analysis of adm transcription in the B7B cells after six hours of T3 treatment +/−10 µg/ml CHX cotreatment of B7B cells. B. Patterns of TRβ binding peaks at the adm locus (UCSC Genome Browser), in similar format to Fig. 4. TRβ binding events clustered into four regions (R1, R2, R3, R4), upstream and downstream of this transcript, as well as a substantial amount of binding immediately proximal to the transcriptional start site. C. Binding of TRβ was confirmed by realtime ChIP PCR analysis in B7B cells at the regions indicated (ChIP primers are depicted by horizontal bars in B). D. The proximal promoter region of adm (corresponding to R2) conferred T3-dependent increases in luciferase activity upon a standard reporter after transfection into B7B. E. Results of gel shift confirming direct TRβ binding to two putative response elements, designated TRE-1 and TRE-2 that were found in R2 at positions marked in Fig. 6B. Individual lanes show shifts obtained with elements and RXRα-TRβ +/− competitor DNA or mutated versions of both elements. F. Luciferase reporter assays confirming that TRE-1 and TRE-2 confer T3 responsiveness on a reporter gene. (*P<0.05 by Student's T-Test).
Figure 7
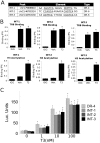
Figure 7. Intergenic binding events.
A. Three intergenic binding peaks were selected and analyzed for the presence of recognizable TR binding motifs (sequences of motifs listed). B. Results of qPCR ChIP analysis confirming binding of TRβ to the intergenic regions depicted in Fig. 7A (top panels) and induction of H3 acetylation near sites (bottom panels). C. Results of luciferase reporter assays, with indicated constructs containing intergenic elements described in Fig. 7A, confirming that each element confers T3 induction. (*P<0.05 by Student's T-Test).

Similar articles

Cited by

References

    1. Kininis M, Chen BS, Diehl AG, Isaacs GD, Zhang T, et al. (2007) Genomic analyses of transcription factor binding, histone acetylation, and gene expression reveal mechanistically distinct classes of estrogen-regulated promoters. Molecular and cellular biology 27 (14) 5090–104. - PMC - PubMed
    1. Welboren WJ, van Driel MA, Janssen-Megens EM, van Heeringen SJ, Sweep FC, et al. (2009) ChIP-Seq of ERalpha and RNA polymerase II defines genes differentially responding to ligands. The EMBO journal 28 (10) 1418–28. - PMC - PubMed
    1. Lefterova MI, Steger DJ, Zhuo D, Qatanani M, Mullican SE, et al. (2010) Cell-specific determinants of peroxisome proliferator-activated receptor gamma function in adipocytes and macrophages. Molecular and cellular biology 30 (9) 2078–89. - PMC - PubMed
    1. Nielsen R, Pedersen TA, Hagenbeek D, Moulos P, Siersbaek R, et al. (2008) Genome-wide profiling of PPARgamma:RXR and RNA polymerase II occupancy reveals temporal activation of distinct metabolic pathways and changes in RXR dimer composition during adipogenesis. Genes & development 22 (21) 2953–67. - PMC - PubMed
    1. Adhikary T, Kaddatz K, Finkernagel F, Schonbauer A, Meissner W, et al. (2000) Genomewide Analyses Define Different Modes of Transcriptional Regulation by Peroxisome Proliferator-Activated Receptor-beta/delta (PPARbeta/delta). PloS One 6 (1) e16344. - PMC - PubMed

Publication types

LinkOut - more resources