. 2014 Feb 18;9(2):e88796.
doi: 10.1371/journal.pone.0088796. eCollection 2014.

Mir-184 post-transcriptionally regulates SOX7 expression and promotes cell proliferation in human hepatocellular carcinoma

Affiliations

Mir-184 post-transcriptionally regulates SOX7 expression and promotes cell proliferation in human hepatocellular carcinoma

Geng-Gang Wu et al. PLoS One. .

Abstract

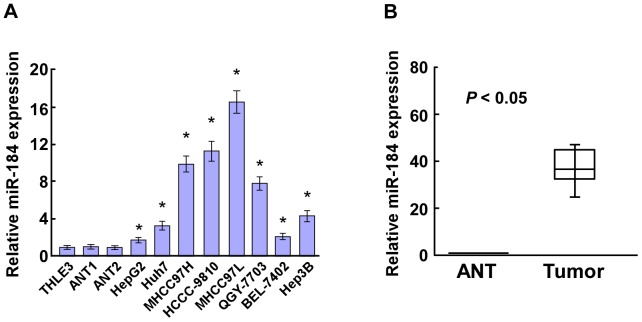
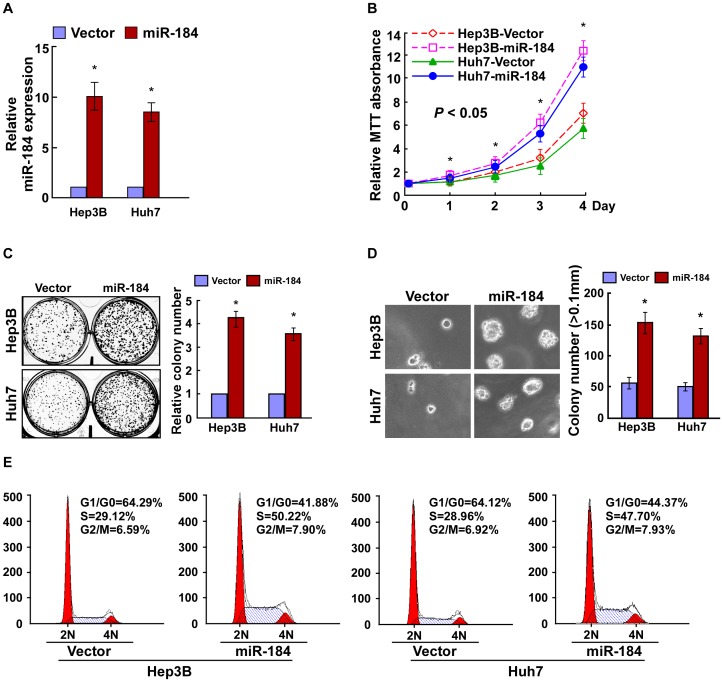
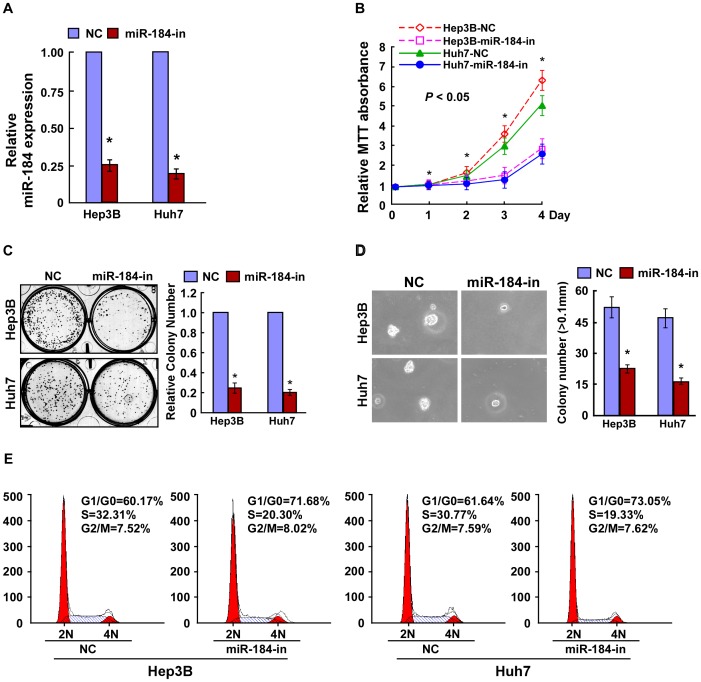
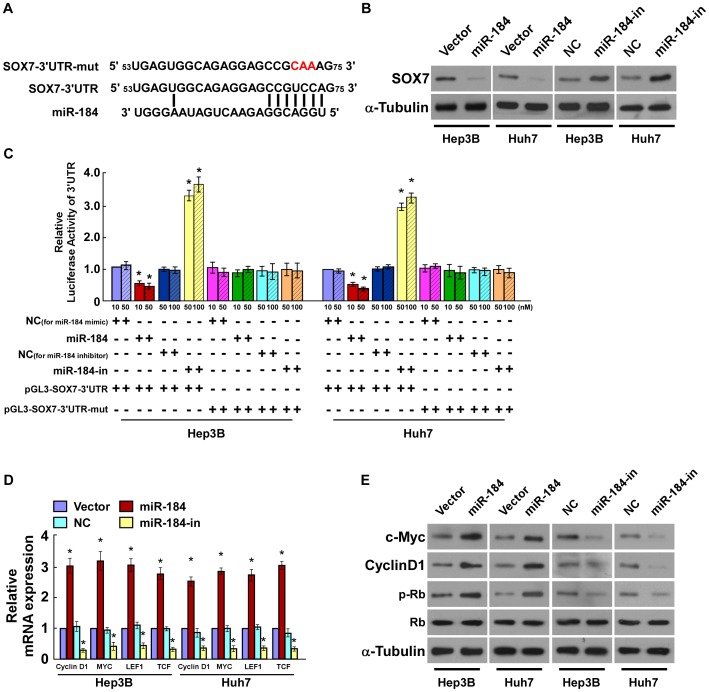
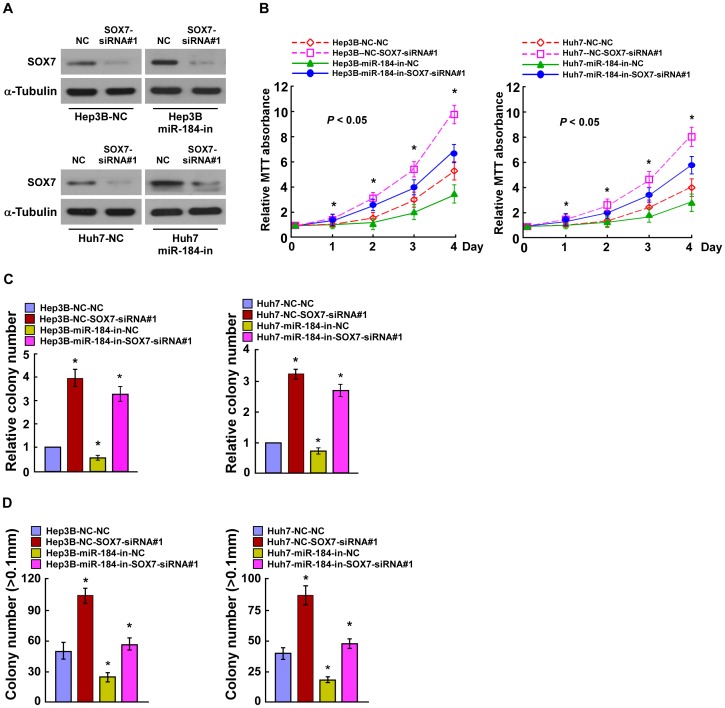
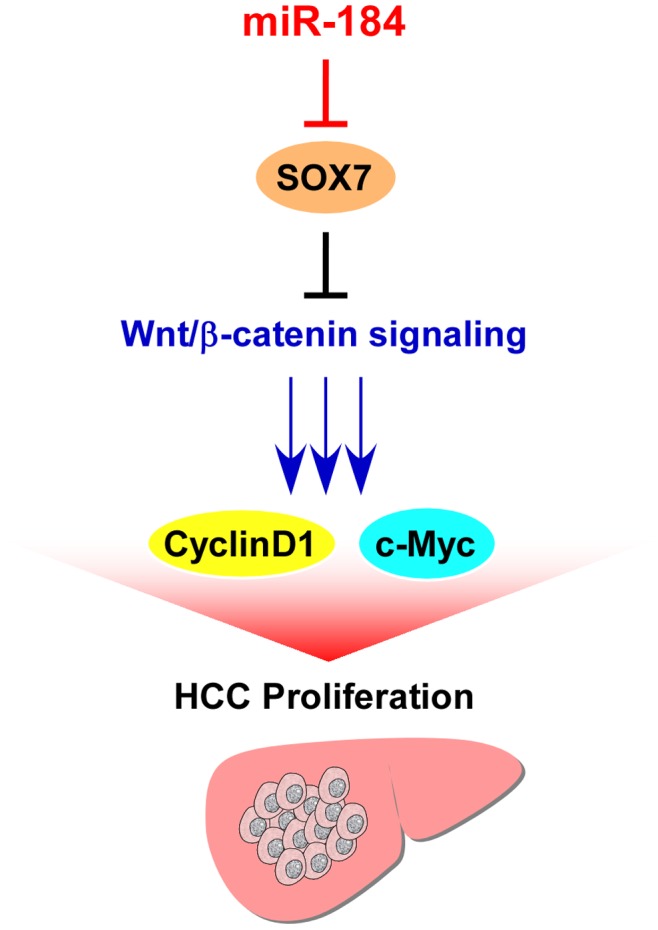
Hepatocellular carcinoma (HCC) is one of the most common human malignancies and the third leading cause of cancer mortality worldwide. The development and progression of HCC is a complicated process, involving the deregulation of multiple genes that are essential to cell biological processes. Recently, microRNAs (miRNAs) have been suggested to be closely associated with tumorigenesis. Our study showed that miR-184 is upregulated in HCC cell lines and tissues. Overexpression of miR-184 in HCC cells increased cell proliferation, tumorigenicity, and cell cycle progression, whereas inhibition of miR-184 reduced cell proliferation, tumorigenicity, and cell cycle progression. Additionally, we identified SOX7 as a direct target of miR-184. Ectopic expression of miR-184 led to downregulation of the SOX7 protein, resulting in upregulation of c-Myc, Cyclin D1, and phosphorylation of Rb. Our findings suggested that miR-184 represents a potential onco-miR and plays an important role in HCC progression by suppressing SOX7 expression.


Conflict of interest statement

Competing Interests: The authors have declared that no competing interests exist.

Figures

Figure 1
Figure 1. Expression of miR-184 is elevated in HCC.
A. Real-time PCR analysis of miR-184 expression in hepatocellular carcinoma cell lines (Hep3B, BEL-7402, MHCC97H, HCCC-9810, MHCC97L, Huh7, QGY-7703 and HepG2), compared with normal liver epithelial THLE3 cells and two noncancerous hepatic tissues (ANT1 and ANT2). B. The expression of miR-184 was examined in eight paired cancerous tissues (T) and their adjacent noncancerous hepatic tissues (ANT), showed in a boxplot. The average miR-184 expression was normalized using U6 expression. Each bar represents the mean ± SD of three independent experiments. *P<0.05.
Figure 2
Figure 2. Ectopic miR-184 promotes the proliferation of HCC cells.
A. Real-time PCR analysis of miR-184 expression in Hep3B and Huh7 cells stably overexpressing miR-184. B. Effects of ectopic miR-184 on the proliferation of the indicated HCC cell lines, as analyzed by the MTT assay. C. Representative micrographs (left) and quantifications (right) of crystal violet stained cell colonies formed by the indicated HCC cell lines, 10 days after inoculation. D. Effects of ectopic miR-184 on the tumorigenicity of the indicated HCC cell lines, as determined by anchorage-independent growth ability assay. Colonies larger than 0.1 mm were scored. E. Effects of ectopic miR-184 on the cell cycle progression of the indicated HCC cells, as measured by flow cytometry analysis. Each bar represents the mean ± SD of three independent experiments. *P<0.05.
Figure 3
Figure 3. Inhibition of miR-184 reduces the proliferation of HCC cells.
A. Real-time PCR analysis of miR-184 expression in Hep3B and Huh7 cells transfected with miR-184 inhibitor. B. The proliferation ability of HCC cells transfected with an miR-184 inhibitor or negative control (NC), analyzed by the MTT assay. C. Representative micrographs (left) and quantifications (right) of crystal violet stained cell colonies formed by indicated HCC cell lines, 10 days after inoculation. D. The tumorigenicity of HCC cells transfected with miR-184 inhibitor or NC, as determined by an anchorage-independent growth ability assay. Colonies larger than 0.1 mm were scored. E. Flow cytometry analysis of indicated HCC cells transfected with miR-184-inhibitor or NC. Each bar represents the mean ± SD of three independent experiments. *P<0.05.
Figure 4
Figure 4. MiR-184 directly targets the 3′-UTR of SOX7 mRNA.
A. Schematic representation of the mature miR-184 sequence, miR-184 target site in the 3′-UTR of SOX7 mRNA and a 3′-UTR mutant of SOX7 mRNA containing three altered nucleotides in the putative target site (SOX7-3′UTR-mut). B. The expression levels of SOX7 protein in HCC cells overexpressing miR-184 or transfected with miR-184 inhibitor, compared with control cells, by western blotting 48 hours after transfection; α-Tubulin served as the loading control. C. Luciferase assay of pGL3-SOX7-3′UTR or pGL3-SOX7-3′UTR-mut reporter cotransfected with different amounts (10, 50 nM) of miR-184 mimic in indicated cells, or different amounts (50, 100 nM) of miR-184 inhibitor, compared with negative control (NC). D. Real-time PCR analysis of the mRNA expression of genes, MYC, CyclinD1, LEF1 and TCF, in indicated HCC cells. E. Expression of c-Myc, CyclinD1, phosphorylated Rb, and Rb protein, as measured by western blotting in indicated HCC cells; α-Tubulin served as the loading control. Each bar represents the mean ± SD of three independent experiments. *P<0.05.
Figure 5
Figure 5. MiR-184 promotes HCC proliferation by inhibiting SOX7.
A. The expression levels of SOX7 in miR-184-inhibitor transfected HCC cells that were transfected with SOX7-siRNA#1, as measured by western blotting; α-Tubulin served as the loading control. B. The growth rates in SOX7-silenced cells, as indicated by the MTT assay. C. Quantifications of crystal violet stained cell colonies formed by indicated HCC cell lines, 10 days after inoculation. D. Quantifications of colony numbers of indicated cells determined by an anchorage-independent growth assay. Colonies larger than 0.1 mm in diameter were scored. Error bars represent the mean ± SD from three independent experiments. *P<0.05.
Figure 6
Figure 6. Proposed model.
Upregulation of miR-184 represses SOX7 and promotes cell proliferation in HCC.

Similar articles

Cited by

References

    1. Willatt JM, Francis IR, Novelli PM, Vellody R, Pandya A, et al. (2012) Interventional therapies for hepatocellular carcinoma. Cancer Imaging 12: 79–88. - PMC - PubMed
    1. Jemal A, Bray F (2011) Center MM, Ferlay J, Ward E, et al (2011) Global cancer statistics. CA Cancer J Clin 61: 69–90. - PubMed
    1. Lei J, Yan L (2012) Comparison between living donor liver transplantation recipients who met the Milan and UCSF criteria after successful downstaging therapies. J Gastrointest Surg 16: 2120–2125. - PubMed
    1. Takayama T (2011) Surgical treatment for hepatocellular carcinoma. Jpn J Clin Oncol 41: 447–454. - PubMed
    1. Ambros V (2004) The functions of animal microRNAs. Nature 431: 350–355. - PubMed

Publication types