

Highly sensitive quantitative imaging for monitoring single cancer cell growth kinetics and drug response
- PMID: 24558461
- PMCID: PMC3928317
- DOI: 10.1371/journal.pone.0089000
Highly sensitive quantitative imaging for monitoring single cancer cell growth kinetics and drug response
Abstract
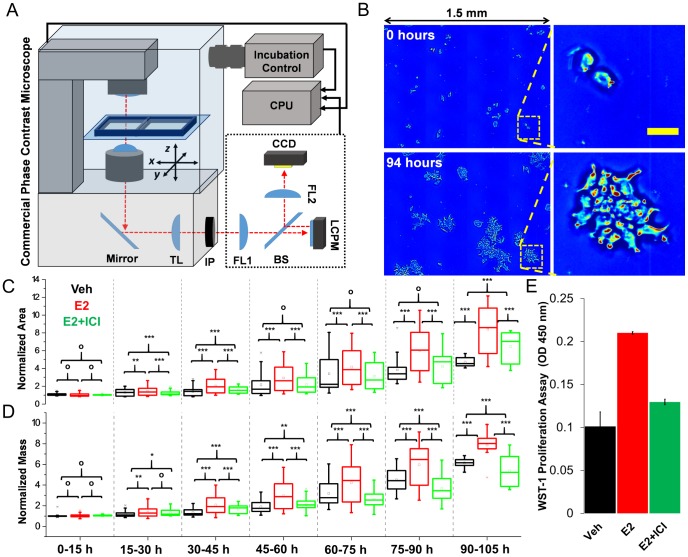
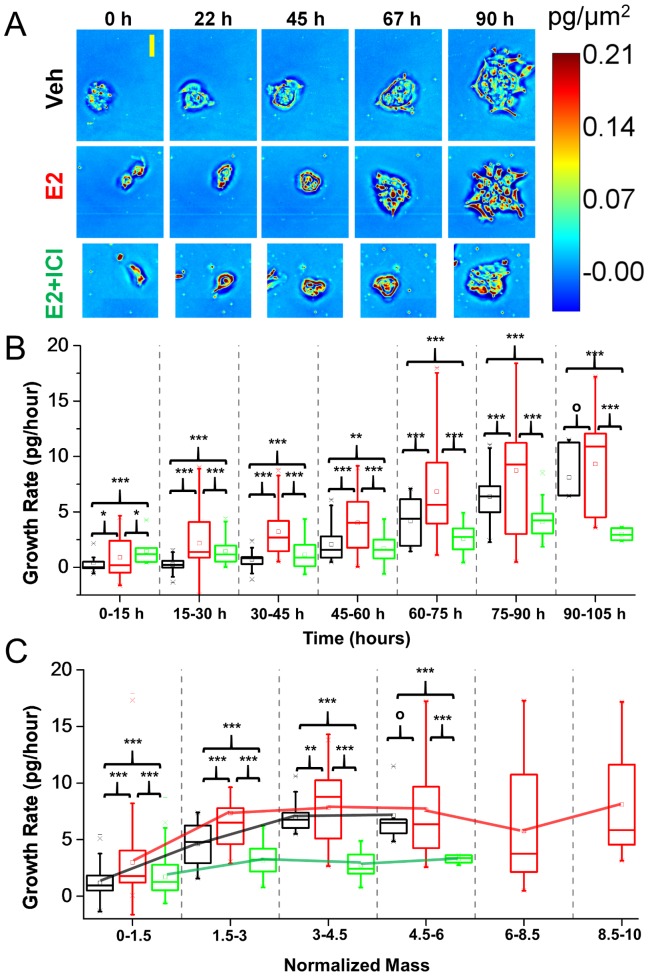
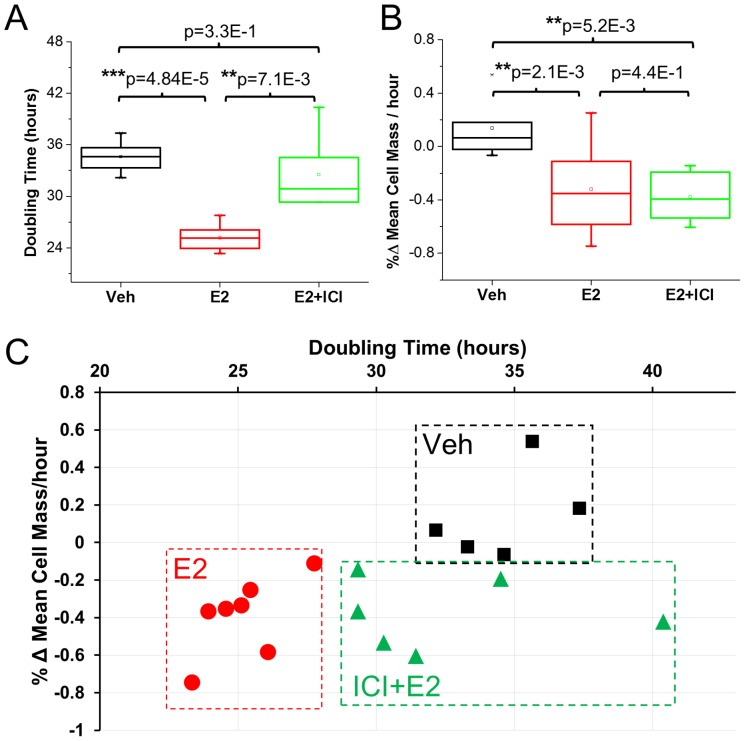
The detection and treatment of cancer has advanced significantly in the past several decades, with important improvements in our understanding of the fundamental molecular and genetic basis of the disease. Despite these advancements, drug-screening methodologies have remained essentially unchanged since the introduction of the in vitro human cell line screen in 1990. Although the existing methods provide information on the overall effects of compounds on cell viability, they are restricted by bulk measurements, large sample sizes, and lack capability to measure proliferation kinetics at the individual cell level. To truly understand the nature of cancer cell proliferation and to develop personalized adjuvant therapies, there is a need for new methodologies that provide quantitative information to monitor the effect of drugs on cell growth as well as morphological and phenotypic changes at the single cell level. Here we show that a quantitative phase imaging modality known as spatial light interference microscopy (SLIM) addresses these needs and provides additional advantages over existing proliferation assays. We demonstrate these capabilities through measurements on the effects of the hormone estradiol and the antiestrogen ICI182,780 (Faslodex) on the growth of MCF-7 breast cancer cells. Along with providing information on changes in the overall growth, SLIM provides additional biologically relevant information. For example, we find that exposure to estradiol results in rapidly growing cells with lower dry mass than the control population. Subsequently blocking the estrogen receptor with ICI results in slower growing cells, with lower dry masses than the control. This ability to measure changes in growth kinetics in response to environmental conditions provides new insight on growth regulation mechanisms. Our results establish the capabilities of SLIM as an advanced drug screening technology that provides information on changes in proliferation kinetics at the cellular level with greater sensitivity than any existing method.
Conflict of interest statement
Figures

Similar articles
-
A kinase inhibitor screen identifies Mcl-1 and Aurora kinase A as novel treatment targets in antiestrogen-resistant breast cancer cells.Oncogene. 2015 Aug 6;34(32):4199-210. doi: 10.1038/onc.2014.351. Epub 2014 Nov 3. Oncogene. 2015. PMID: 25362855
-
TIMP1 overexpression mediates resistance of MCF-7 human breast cancer cells to fulvestrant and down-regulates progesterone receptor expression.Tumour Biol. 2013 Dec;34(6):3839-51. doi: 10.1007/s13277-013-0969-7. Epub 2013 Jul 24. Tumour Biol. 2013. PMID: 23881388
-
Estrogen and pure antiestrogen fulvestrant (ICI 182 780) augment cell-matrigel adhesion of MCF-7 breast cancer cells through a novel G protein coupled estrogen receptor (GPR30)-to-calpain signaling axis.Toxicol Appl Pharmacol. 2014 Mar 1;275(2):176-81. doi: 10.1016/j.taap.2014.01.005. Epub 2014 Jan 17. Toxicol Appl Pharmacol. 2014. PMID: 24440569
-
Preclinical and clinical experience with fulvestrant (Faslodex) in postmenopausal women with hormone receptor-positive advanced breast cancer.Cancer Invest. 2005;23(2):173-81. doi: 10.1081/cnv-50480. Cancer Invest. 2005. PMID: 15813510 Review.
-
Faslodex (ICI 182, 780), a novel estrogen receptor downregulator--future possibilities in breast cancer.J Steroid Biochem Mol Biol. 2001 Dec;79(1-5):209-12. doi: 10.1016/s0960-0760(01)00138-8. J Steroid Biochem Mol Biol. 2001. PMID: 11850227 Review.
Cited by
-
Digital holographic microscopy evaluation of dynamic cell response to electroporation.Biomed Opt Express. 2021 Mar 31;12(4):2519-2530. doi: 10.1364/BOE.421959. eCollection 2021 Apr 1. Biomed Opt Express. 2021. PMID: 33996245 Free PMC article.
-
Cell viscoelasticity is linked to fluctuations in cell biomass distributions.Sci Rep. 2020 May 4;10(1):7403. doi: 10.1038/s41598-020-64259-y. Sci Rep. 2020. PMID: 32366921 Free PMC article.
-
Spatiotemporal characterization of a fibrin clot using quantitative phase imaging.PLoS One. 2014 Nov 11;9(11):e111381. doi: 10.1371/journal.pone.0111381. eCollection 2014. PLoS One. 2014. PMID: 25386701 Free PMC article.
-
A Time-lapse, Label-free, Quantitative Phase Imaging Study of Dormant and Active Human Cancer Cells.J Vis Exp. 2018 Feb 16;(132):57035. doi: 10.3791/57035. J Vis Exp. 2018. PMID: 29553530 Free PMC article.
-
Reagent-Free and Rapid Assessment of T Cell Activation State Using Diffraction Phase Microscopy and Deep Learning.Anal Chem. 2019 Mar 5;91(5):3405-3411. doi: 10.1021/acs.analchem.8b04895. Epub 2019 Feb 22. Anal Chem. 2019. PMID: 30741527 Free PMC article.
References
Publication types
MeSH terms
Substances
Grants and funding
LinkOut - more resources
Full Text Sources
Other Literature Sources
Research Materials
Miscellaneous
