

Which is more generalizable, powerful and interpretable in meta-analyses, mean difference or standardized mean difference?
- PMID: 24559167
- PMCID: PMC3936842
- DOI: 10.1186/1471-2288-14-30
Which is more generalizable, powerful and interpretable in meta-analyses, mean difference or standardized mean difference?
Abstract
Background: To examine empirically whether the mean difference (MD) or the standardised mean difference (SMD) is more generalizable and statistically powerful in meta-analyses of continuous outcomes when the same unit is used.
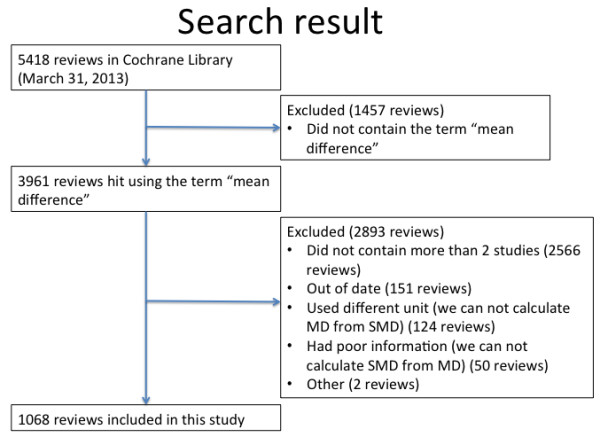
Methods: From all the Cochrane Database (March 2013), we identified systematic reviews that combined 3 or more randomised controlled trials (RCT) using the same continuous outcome. Generalizability was assessed using the I-squared (I2) and the percentage agreement. The percentage agreement was calculated by comparing the MD or SMD of each RCT with the corresponding MD or SMD from the meta-analysis of all the other RCTs. The statistical power was estimated using Z-scores. Meta-analyses were conducted using both random-effects and fixed-effect models.
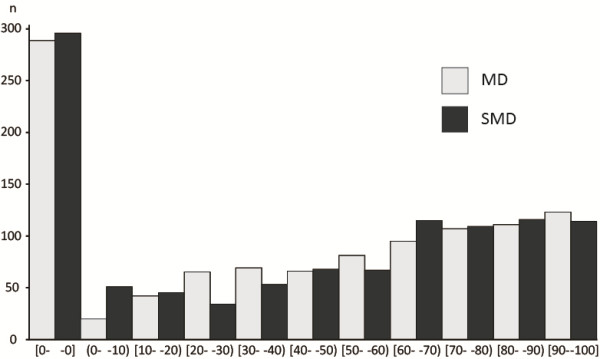
Results: 1068 meta-analyses were included. The I2 index was significantly smaller for the SMD than for the MD (P < 0.0001, sign test). For continuous outcomes, the current Cochrane reviews pooled some extremely heterogeneous results. When all these or less heterogeneous subsets of the reviews were examined, the SMD always showed a greater percentage agreement than the MD. When the I2 index was less than 30%, the percentage agreement was 55.3% for MD and 59.8% for SMD in the random-effects model and 53.0% and 59.8%, respectively, in the fixed effect model (both P < 0.0001, sign test). Although the Z-scores were larger for MD than for SMD, there were no differences in the percentage of statistical significance between MD and SMD in either model.
Conclusions: The SMD was more generalizable than the MD. The MD had a greater statistical power than the SMD but did not result in material differences.
Figures
References
-
- Higgins JPT, Green S, editor. Cochrane Handbook for Systematic Reviews of Interventions Version 5.1.0 [updated March 2011]. The Cochrane Collaboration, 2011. Available from http://www.cochrane-handbook.org.
-
- Cohen J. Statistical Power Analysis for the Behavioral Sciences. Hillsdale, New Jersey: Lawrence Erlbaum Associates: Routledge; 1988.
-
- Glass GV. Primary, secondary, and meta-analysis of research. Educ Res. 1976;5(10):3–8.
-
- Hedges LV, Olkin I, Statistiker M, Olkin I, Olkin I. Statistical Methods for Meta-Analysis. New York: Academic Press; 1985.
-
- Wilkinson L. Statistical methods in psychology journals: guidelines and explanations. Am Psychol. 1999;54(8):594.
Publication types
MeSH terms
LinkOut - more resources
Full Text Sources
Other Literature Sources
