. 2014 May 17;383(9930):1739-47.
doi: 10.1016/S0140-6736(13)62566-0. Epub 2014 Feb 20.

The changing risk of Plasmodium falciparum malaria infection in Africa: 2000-10: a spatial and temporal analysis of transmission intensity

Affiliations

The changing risk of Plasmodium falciparum malaria infection in Africa: 2000-10: a spatial and temporal analysis of transmission intensity

Abdisalan M Noor et al. Lancet. .

Abstract

Background: Over a decade ago, the Roll Back Malaria Partnership was launched, and since then there has been unprecedented investment in malaria control. We examined the change in malaria transmission intensity during the period 2000-10 in Africa.

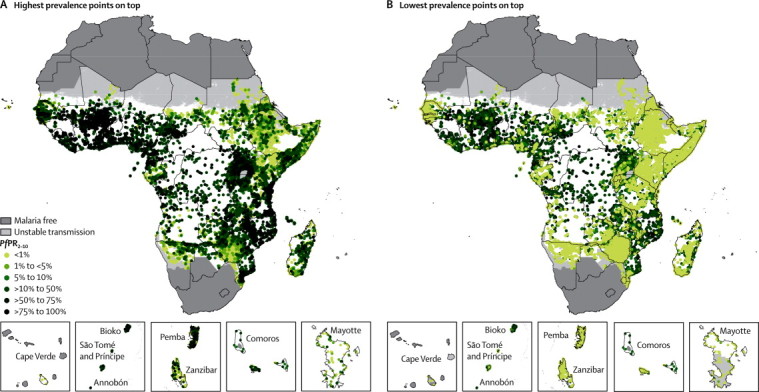
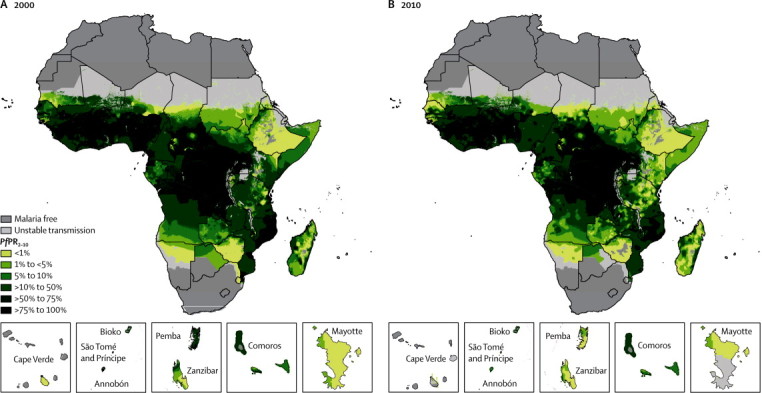
Methods: We assembled a geocoded and community Plasmodium falciparum parasite rate standardised to the age group 2-10 years (PfPR2-10) database from across 49 endemic countries and territories in Africa from surveys undertaken since 1980. The data were used within a Bayesian space-time geostatistical framework to predict PfPR2-10 in 2000 and 2010 at a 1 × 1 km spatial resolution. Population distribution maps at the same spatial resolution were used to compute populations at risk by endemicity class and estimate population-adjusted PfPR2-10 (PAPfPR2-10) for each of the 44 countries for which predictions were possible for each year.

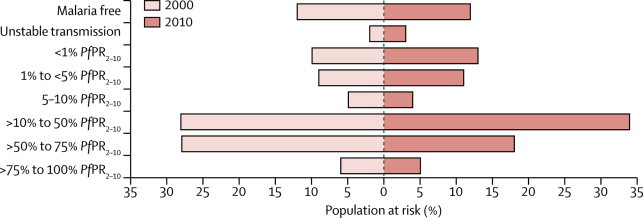
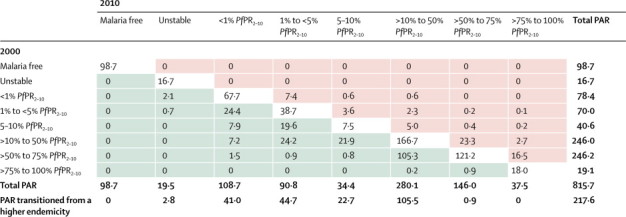
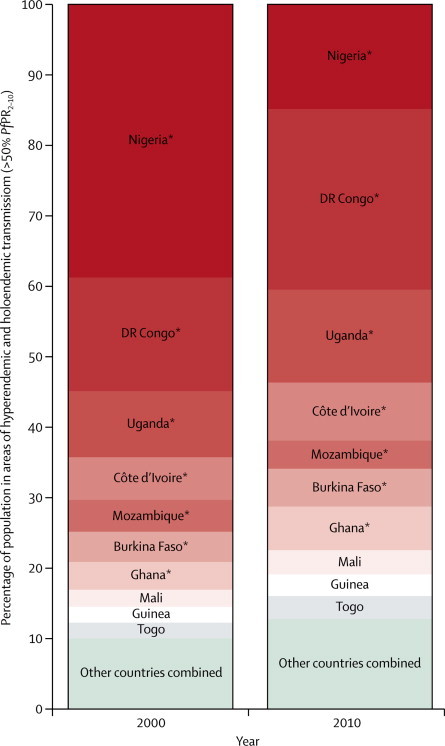
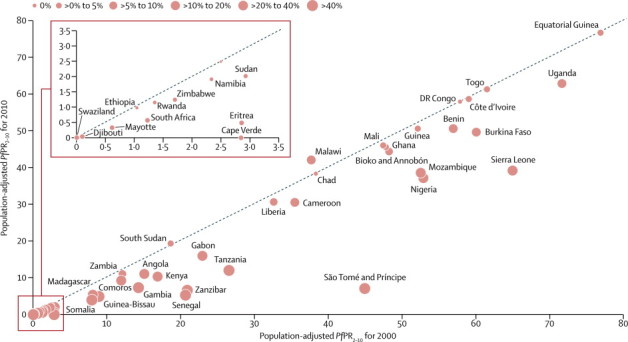
Findings: Between 2000 and 2010, the population in hyperendemic (>50% to 75% PfPR2-10) or holoendemic (>75% PfPR2-10) areas decreased from 218·6 million (34·4%) of 635·7 million to 183·5 million (22·5%) of 815·7 million across 44 malaria-endemic countries. 280·1 million (34·3%) people lived in areas of mesoendemic transmission (>10% to 50% PfPR2-10) in 2010 compared with 178·6 million (28·1%) in 2000. Population in areas of unstable or very low transmission (<5% PfPR2-10) increased from 131·7 million people (20·7%) in 2000 to 219·0 million (26·8%) in 2010. An estimated 217·6 million people, or 26·7% of the 2010 population, lived in areas where transmission had reduced by at least one PfPR2-10 endemicity class. 40 countries showed a reduction in national mean PAPfPR2-10. Only ten countries contributed 87·1% of the population living in areas of hyperendemic or holoendemic transmission in 2010.

Interpretation: Substantial reductions in malaria transmission have been achieved in endemic countries in Africa over the period 2000-10. However, 57% of the population in 2010 continued to live in areas where transmission remains moderate to intense and global support to sustain and accelerate the reduction of transmission must remain a priority.

Funding: Wellcome Trust.


Figures

Figure 1
Figure 1
Distribution of 26 746 community Plasmodium falciparum parasite rate space–time survey datapoints in Africa for the period 1980–2012 (A) Highest prevalence points on top and (B) lowest prevalence points on top. The dark grey, light grey, and white areas are malaria free and the limits of unstable and stable transmission, respectively, for the year 2000 in Africa. PfPR2–10=community Plasmodium falciparum parasite rate standardised to the age group 2–10 years.
Figure 2
Figure 2
Predicted 1 × 1 km spatial resolution Plasmodium falciparum parasite rate endemicity class maps of Africa Prevalence in (A) 2000 and (B) 2010. The dark grey, light grey, and white areas are malaria free and the limits of unstable and stable transmission, respectively, for each year. PfPR2–10 predictions were made to areas within the stable limits of transmission. PfPR2–10=community Plasmodium falciparum parasite rate standardised to the age group 2–10 years.
Figure 3
Figure 3
Percentage of population by Plasmodium falciparum parasite rate malaria endemicity class in endemic countries in Africa for the years 2000 and 2010 These estimates do not include Burundi, Central African Republic, Congo, Mauritania, and Niger, for which we did not have sufficient data to predict change. PfPR2–10=community Plasmodium falciparum parasite rate standardised to the age group 2–10 years.
Figure 4
Figure 4
The 2010 population (millions) in malaria-endemic countries in Africa by their Plasmodium falciparum parasite rate endemicity class in 2000 and 2010 The green shaded cells show the number of people (millions) in 2010 who lived in areas where malaria endemicity had reduced by at least one level from that of 2000. The pink shaded areas are those where endemicity had increased by at least one level from that of 2000. These estimates do not include Burundi, Central African Republic, Congo, Mauritania, and Niger, for which we did not have sufficient data to predict change. PAR=populations at risk. PfPR2–10=community Plasmodium falciparum parasite rate standardised to the age group 2–10 years.
Figure 5
Figure 5
Bar charts of the population at risk in areas of hyperendemic and holoendemic transmission (>50% Plasmodium falciparum parasite rate) in 2000 and 2010 The ten countries shown here contribute to 87·1% of all populations living in hyperendemic and holoendemic areas in Africa in 2010. *Countries that are part of the ten countries in the WHO Malaria Situation Room.PfPR2–10=community Plasmodium falciparum parasite rate standardised to the age group 2–10 years.
Figure 6
Figure 6
Bubble scatter plot comparing estimates of national mean Plasmodium falciparum parasite rate within the limits of stable transmission by country in 2000 and 2010 The size of the bubble dot shows the relative percentage change in national mean PAPfPR2–10 between 2000 and 2010. Countries below the 45 degrees line are those where national mean PAPfPR2–10 has declined whereas those above the line are those where it has risen. Points on the line are those with no change. These estimates do not include Burundi, Central African Republic, Congo, Mauritania, and Niger, for which we did not have sufficient data to predict change. The inset shows change in those countries in which national mean PAPfPR2–10 in 2000 was less than 5%. Estimates for Cape Verde were those of Santiago Island only because the other Islands were already of unstable transmission by 2000.

Comment in

References

    1. Nabarro D, Tayler EM. The Roll Back Malaria campaign. Science. 1998;280:2067–2068. - PubMed
    1. Snow RW, Amratia P, Kabaria CW, Noor AM, Marsh K. The changing limits and incidence of malaria in Africa: 1939–2009. Adv Parasitol. 2012;78:169–262. - PMC - PubMed
    1. Snow RW, Marsh K. Malaria in Africa: progress and prospects in the decade since the Abuja Declaration. Lancet. 2010;376:137–139. - PMC - PubMed
    1. WHO . World malaria report 2012. World Health Organization; Geneva: 2012. http://www.who.int/malaria/publications/world_malaria_report_2012/en/ind... (accessed July 15, 2013)
    1. Snow RW, Craig M, Deichmann U, Marsh K. Estimating mortality, morbidity and disability due to malaria among Africa's non-pregnant population. Bull World Health Organ. 1999;77:624–640. - PMC - PubMed

Publication types

LinkOut - more resources