. 2014 Feb 19;81(4):888-900.
doi: 10.1016/j.neuron.2013.12.026.

A local glutamate-glutamine cycle sustains synaptic excitatory transmitter release

Affiliations

A local glutamate-glutamine cycle sustains synaptic excitatory transmitter release

Hiroaki Tani et al. Neuron. .

Abstract

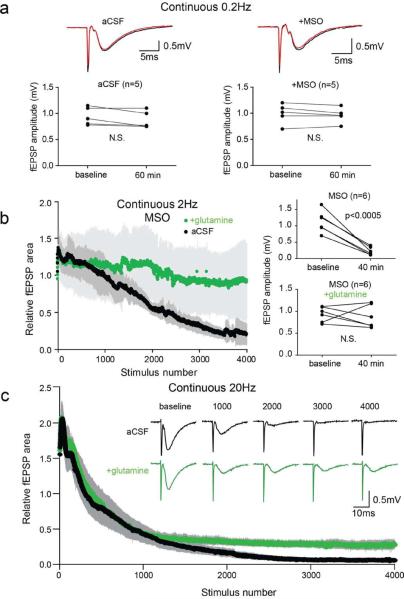
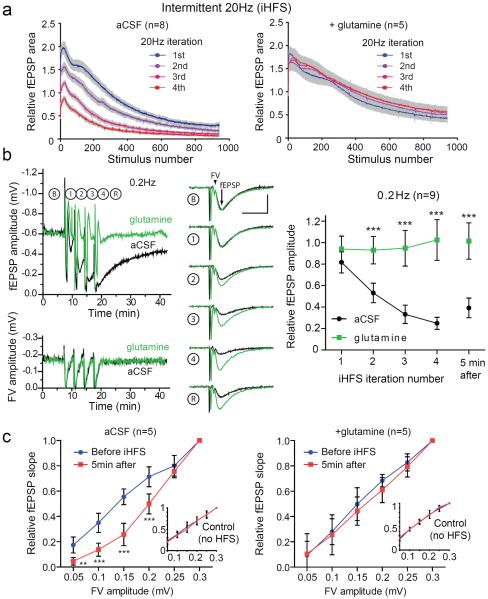
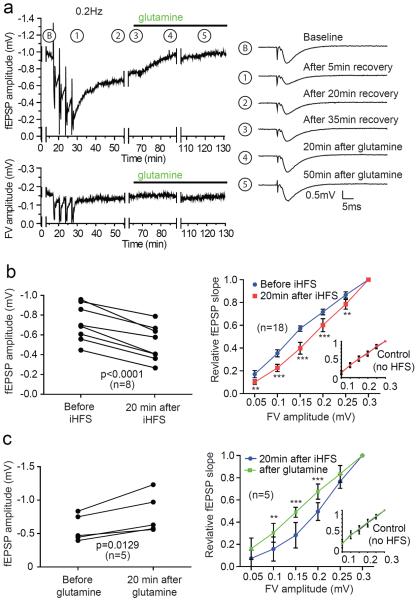
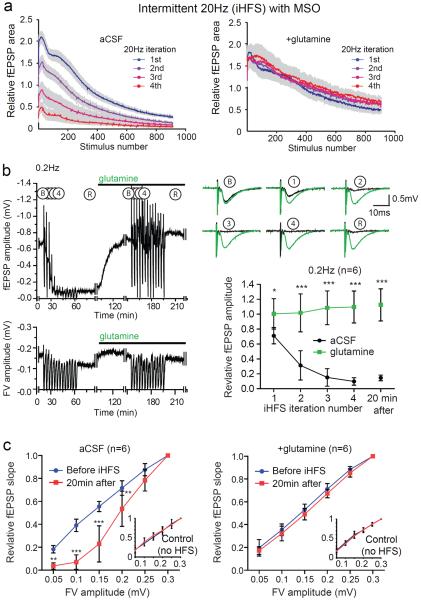
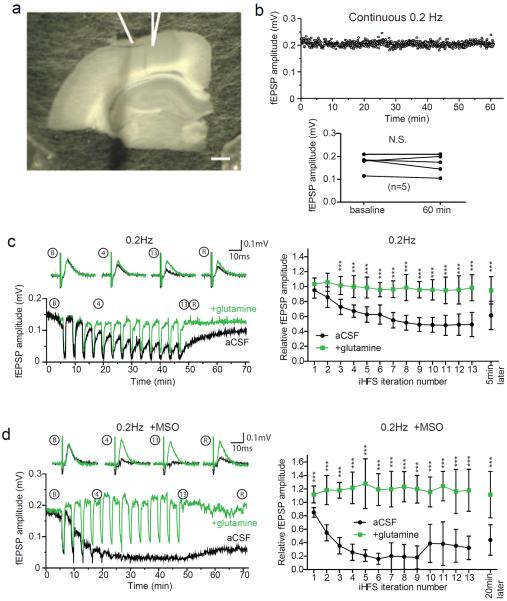
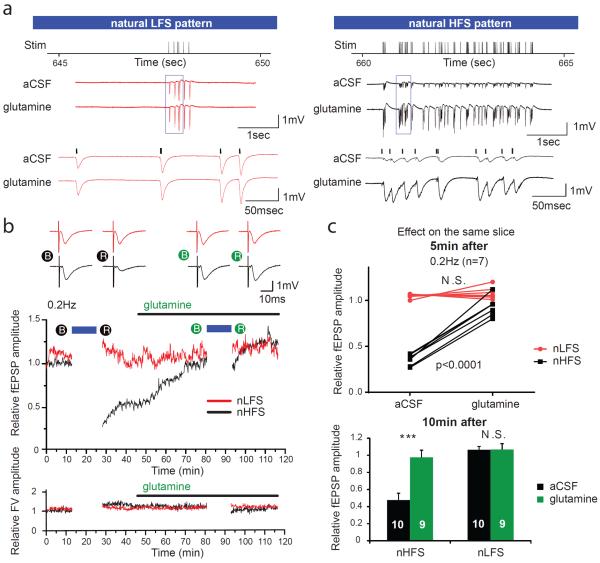
Biochemical studies suggest that excitatory neurons are metabolically coupled with astrocytes to generate glutamate for release. However, the extent to which glutamatergic neurotransmission depends on this process remains controversial because direct electrophysiological evidence is lacking. The distance between cell bodies and axon terminals predicts that glutamine-glutamate cycle is synaptically localized. Hence, we investigated isolated nerve terminals in brain slices by transecting hippocampal Schaffer collaterals and cortical layer I axons. Stimulating with alternating periods of high frequency (20 Hz) and rest (0.2 Hz), we identified an activity-dependent reduction in synaptic efficacy that correlated with reduced glutamate release. This was enhanced by inhibition of astrocytic glutamine synthetase and reversed or prevented by exogenous glutamine. Importantly, this activity dependence was also revealed with an in-vivo-derived natural stimulus both at network and cellular levels. These data provide direct electrophysiological evidence that an astrocyte-dependent glutamate-glutamine cycle is required to maintain active neurotransmission at excitatory terminals.


Figures

Figure 1
Figure 1. Glutamine prevents fEPSP depression during high frequency repetitive stimulation of the Schaffer collaterals
(a) Example traces at baseline (black) and after 60 min (red) of continuous 0.2 Hz stimulation (upper) and paired plot of fEPSP amplitudes (lower) for untreated slices (left) and slices pretreated with MSO to inhibit glutamine synthetase (right). (b) Time course of relative fEPSP area during continuous 2 Hz stimulation (4000 stimuli; 33.3 min) of the Schaffer collaterals (left panel) in slices treated with MSO in aCSF (black; n=6) and with addition of 500 μM glutamine (green; n=6). Evoked fEPSP amplitudes during 0.2 Hz stimulation at baseline and at 40 min (~6 min after 2 Hz stimulation) shows significant fEPSP depression (Student's t-test, p<0.0005) in MSO treated slices but not in glutamine (right panel). (c) Time course of continuous 20 Hz stimulation of Schaffer collaterals in aCSF (black; n=6) and with glutamine (green, n=4). Inset: example traces at indicated stimulus numbers. Gray bars indicate SEM.
Figure 2
Figure 2. iHFS causes use-dependent fEPSP depression that is prevented by glutamine
(a) Evoked fEPSP amplitudes during intermittent 20 Hz stimulation with four iterations of 1000 pulses at 20 Hz separated by 200 sec of recovery at 0.2 Hz in aCSF (left panel; n=8) and aCSF with 500 μM glutamine (right panel; n=5). (b) Time course of fEPSP amplitude (upper left) and FV amplitude (lower left) during iHFS protocol on slices in aCSF (black) and aCSF with glutamine (green). Traces of evoked fEPSP during 0.2 Hz stimulation at baseline (B), after successive iterations of 1000 pulses at 20Hz (1–4), and after a subsequent 5 min recovery period (R) of 0.2Hz stimulation (middle panel) and summary (right panel; n=9, 2-way repeated measures ANOVA with Bonferroni post test, ***P<0.001, error bars represent 95% CI) demonstrate activity-dependent reduction in fEPSP amplitude. FV and fEPSP are indicated by the arrowhead and arrow respectively in baseline sample tracings in (b). Scale bars=10ms, 0.5mV. (c) Graphs of input (FV amplitude in mV) and output (relative fEPSP slope) are plotted for stimulated (iHFS) electrodes with control stimulation pathway (continuous 0.2 Hz stimulation) shown in insets. I/O curves before iHFS (blue) and after (red) in the absence (left) and presence (right) of glutamine (2-way repeated measures ANOVA with Bonferroni post test, **p<0.01, ***P<0.001, error bars represent 95% CI). The same recording electrode was used for iHFS and control stimulating electrodes.
Figure 3
Figure 3. Glutamine reverses iHFS induced fEPSP amplitude reduction
(a) Time course of fEPSP amplitude (upper trace) and FV (lower trace) with standard iHFS protocol followed by addition of glutamine. Traces during collection of data for I/O relationship were removed (and depicted by gaps) for clarity. Example traces during 0.2 Hz stimulation at indicated time points are depicted on right. (b) Paired plot of fEPSP amplitude measurement before and after iHFS protocol (left panel) shows significant depression at 20 min after the iHFS (student's t-test, p<0.0001) and a corresponding rightward shift in the I/O curve (right panel). There is no change in the I/O curve for the control pathway (inset). (c) Addition of glutamine 20 min after iHFS protocol significantly increases fEPSP amplitude 20 min later (left panel; student's t-test, p=0.0129). There is also a corresponding leftward shift of the I/O curve (right panel). Note glutamine does not affect the I/O curve of the control pathway (inset). For statistical analyses of the I/O curves 2-way repeated measures ANOVA with Bonferroni post test was applied (**p<0.01, ***p<0.001).
Figure 4
Figure 4. Inhibiting glutamine synthesis with MSO enhances iHFS induced fEPSP depression
(a) Evoked fEPSP amplitudes for MSO treated slices during four iterations of 1000 pulses at 20 Hz separated by 200 sec of recovery at 0.2 Hz in aCSF (left panel; n=8) and aCSF with 500 μM glutamine (right panel; n=5). (b) Representative time course of evoked fEPSPs (upper) and fiber volleys (lower) in MSO treated slice. Note that adding glutamine after iHFS was associated with recovery that persisted during an additional 13 HFS iterations. Gaps represent time periods during which data for the I/O relationship were being collected. Traces of evoked fEPSP during 0.2 Hz stimulation at baseline (B), after successive iterations of 1000 pulses at 20 Hz (1–4), and after a subsequent 5 min recovery period (R) of 0.2 Hz stimulation (upper right panel) and summary (lower right panel; n=6, 2-way repeated measures ANOVA with Bonferroni post test, *p<0.05, ***p<0.001, error bars represent 95% CI) demonstrate the reduction in fEPSP in the MSO treated slices and the recovery with addition of glutamine. (c) I/O curves before iHFS (blue) and after (red) for MSO treated slices in the absence (left) and presence (right) of glutamine (2-way repeated measures ANOVA with Bonferroni post test, **p<0.01, ***p<0.001, error bars represent 95% CI). Insets: I/O curves for laterally displaced control electrodes that were stimulated continuously at 0.2 Hz.
Figure 5
Figure 5. Reduction in evoked glutamate release after iHFS is prevented by addition of glutamine
(a) Representative heat maps of glutamate biosensor FRET change (ΔFRET) for regions of interest adjacent to stimulating electrodes in the Schaffer collaterals overlayed on a bright-field image. Baseline signal (top panel) was obtained during an initial period of 0.2Hz stimulation at both electrodes. After the left electrode was subjected to iHFS protocol (bottom panel) there was a marked decrease in the signal, while there was little change in the signal at control electrode stimulated continuously at 0.2 Hz (right electrode). Scale bars=200μm. (b) Representative time course of evoked FRET signal change by iHFS stimulated electrode in aCSF (upper) and in glutamine (lower) at baseline (black) and after iHFS (red); scale bars=100ms, 0.005 ΔFRET. Summary of the reduction in evoked peak ΔFRET 5min after iHFS with and without glutamine (n=4 aCSF, n=7 glutamine, 1-way ANOVA, **p=0.002). There were no significant differences at the control electrode stimulated with continuous 0.2 Hz in presence and absence of glutamine (data not shown). (c–e) Effect of low-affinity, fast equilibrating AMPA receptor antagonist γ-DGG. Example traces and corresponding paired sample data (analyzed by student's t-test) showing the effect of 1 mM γ-DGG applied for 6 min (indicated as black bars in traces) before and after iHFS (left traces) compared to control electrode (right traces) in the same slice in (c) aCSF, (d) MSO pretreated slices, and (e) MSO pretreated slices to which glutamine was added. The bottom number represents the evoked amplitude 5min after addition of γ-DGG, and the top number represents the evoked amplitude in the absence of γ-DGG, derived from the evoked amplitudes immediately before and after γ-DGG wash-in. R is the ratio of the amplitude of γ-DGG effect to the baseline amplitude (equal to the bottom number divided by the top number). The change in effect of γ-DGG was calculated by determining the change in ratio of amplitude reduction caused by γ-DGG before and after iHFS.
Figure 6
Figure 6. Glutamine prevents fEPSP depression during repetitive stimulation of Layer I cortical afferents
(a) Bright field image of rat brain slice in which Layer I cortical axons have been transected and separated from on column deeper layers. Positions of stimulating (left) and recording electrode (right; in Layer III where Layer V apical dendrites project) are depicted by line drawings. (b) Representative time course of evoked fEPSP amplitude during continuous 0.2Hz stimulation protocol (upper) and plot of paired fEPSP amplitude measurements at 5 min and 60 min for 5 slices stimulated continuously at 0.2 Hz (lower; student's t-test, no significant difference). (c) Representative time course of evoked fEPSP amplitudes recorded during 0.2 Hz stimulation period during baseline (B), after 4th (4) and 13th (13) HFS iteration, and during recovery (R) with sample traces above (black trace, aCSF; green trace, glutamine). Summary of fEPSP amplitude after each HFS iteration (right panel; n=5, 2-way repeated measures ANOVA with Bonferroni post test, ***p<0.001, error bars represent 95% CI). (d) As in (c) with slices preincubated with glutamine synthetase inhibitor MSO.
Figure 7
Figure 7. In vivo-derived natural stimulus pattern reveals glutamine-dependent reduction in evoked fEPSPs
Twelve minutes of in vivo-derived neuronal firing patterns were replayed as a natural low frequency stimulus (nLFS) or high frequency stimulus (nHFS) on parallel Schaffer collateral fibers in the absence or presence of glutamine. (a) Five seconds of representative field recording traces near the end of 12 min of nLFS and nHFS shows no difference between aCSF and glutamine treatment on the same slice with nLFS, but a significant depression in fEPSP amplitudes with nHFS that is prevented by glutamine. Stimulus artifacts were removed for clarity. (b) Traces of evoked fEPSPs (upper panel) during 0.2 Hz stimulation at baseline (B) and after 5 min recovery (R) from natural stimulus patterns for slices perfused first with aCSF (black filled circles, left) and then with aCSF plus glutamine (green filled circles, right). Traces of nLFS protocol electrode are in red and those of nHFS protocol electrode in black. Sample time course of relative fEPSP amplitude (middle panel) and FV amplitude (lower panel) evoked at 0.2 Hz during baseline acquisition and after recovery from nLFS (red) and nHFS (black) protocols initially in aCSF and then with addition of glutamine. Blue bars indicate duration of nLFS/nHFS. (c) Paired analysis of evoked fEPSP amplitudes in aCSF and aCSF with glutamine 5 min after natural stimulus protocols (top) revealed no difference in evoked fEPSP amplitudes after nLFS, but fEPSP amplitude depression with nHFS in aCSF that was markedly attenuated in the presence of glutamine (n=7, 2-way repeated measures ANOVA with Bonferroni post test, P<0.0001). Relative fEPSP amplitudes remained significantly depressed 10 min after nHFS in aCSF (0.478+/−0.079; student's t-test, ***p<0.0001), but almost completely recovered in the presence of glutamine (0.975+/−0.084).
Figure 8
Figure 8. Minimally-evoked natural stimulus pattern reveals glutamine-dependent reduction in evoked synaptic EPSCs
EPSC amplitudes were analyzed from intracellular recordings of CA1 cells in which the Schaffer collaterals were minimally-stimulated with natural patterns in the absence or presence of glutamine. (a) Representative example of averaged minimally-evoked EPSC amplitudes (upper panel) during 0.2 Hz stimulation from a CA1 cell over 5 min during baseline (left), the first 5 min post-nLFS (middle) and 10–15 minutes post nLFS (right). Red dotted line represents mean baseline amplitude. Relative amplitudes of evoked EPSCs from 13 individual cells (middle panel) during baseline, the first 5 min post-nLFS (Post-Stim) and 10–15 minutes post nLFS (recovery). Red continuous line depicts representative median response corresponding to the representative traces. Time course of evoked EPSC amplitudes from a representative cell normalized to the median of the baseline (bottom panel). Blue bar represents duration of natural stimulus. (b–d) same as above but with (b) nLFS in glutamine (n=11), (c) nHFS in aCSF (n=13) and (d) nHFS in glutamine (n=11). A significant reduction of evoked EPSCs was seen with nHFS in aCSF during post-stim (0.65 median, **p<0.05) and recovery (0.58 median, **p<0.05), but not in glutamine (One way ANOVA; aCSF p=0.0134, glutamine p=0.9125 for difference within groups). There was no significant difference in evoked EPSCs with nLFS with or without glutamine.

Comment in

  • Good housekeeping.
    Overstreet-Wadiche L, Wadiche JI. Overstreet-Wadiche L, et al. Neuron. 2014 Feb 19;81(4):715-7. doi: 10.1016/j.neuron.2014.02.004. Neuron. 2014. PMID: 24559665 Free PMC article.

References

    1. Aoki C, Kaneko T, Starr A, Pickel VM. Identification of mitochondrial and non-mitochondrial glutaminase within select neurons and glia of rat forebrain by electron microscopic immunocytochemistry. J Neurosci Res. 1991;28:531–548. - PubMed
    1. Bacci A, Sancini G, Verderio C, Armano S, Pravettoni E, Fesce R, Franceschetti S, Matteoli M. Block of glutamate-glutamine cycle between astrocytes and neurons inhibits epileptiform activity in hippocampus. J Neurophysiol. 2002;88:2302–2310. - PubMed
    1. Balkrishna S, Broer A, Kingsland A, Broer S. Rapid downregulation of the rat glutamine transporter SNAT3 by a caveolin-dependent trafficking mechanism in Xenopus laevis oocytes. Am J Physiol Cell Physiol. 2010;299:C1047–1057. - PubMed
    1. Bergles DE, Jahr CE. Glial contribution to glutamate uptake at Schaffer collateral-commissural synapses in the hippocampus. The Journal of neuroscience : the official journal of the Society for Neuroscience. 1998;18:7709–7716. - PMC - PubMed
    1. Berke JD, Hetrick V, Breck J, Greene RW. Transient 23–30 Hz oscillations in mouse hippocampus during exploration of novel environments. Hippocampus. 2008;18:519–529. - PubMed

Publication types