. 2014 Feb 18;106(4):824-33.
doi: 10.1016/j.bpj.2013.12.041.

FKBP12.6 activates RyR1: investigating the amino acid residues critical for channel modulation

Affiliations

FKBP12.6 activates RyR1: investigating the amino acid residues critical for channel modulation

Elisa Venturi et al. Biophys J. .

Abstract

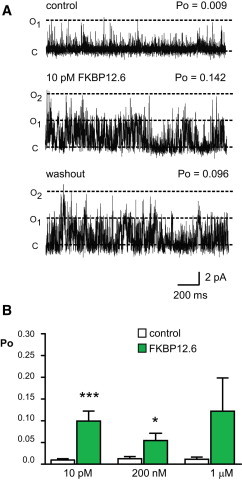
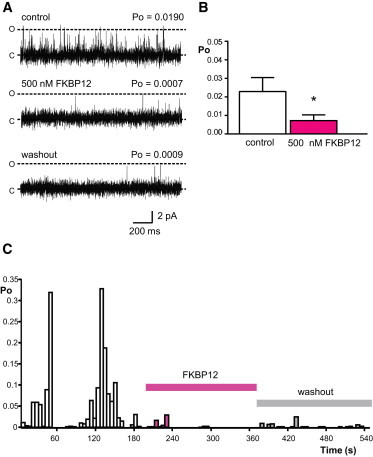
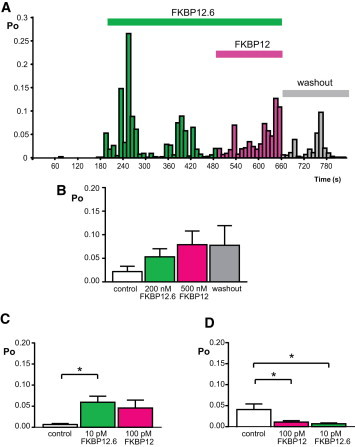
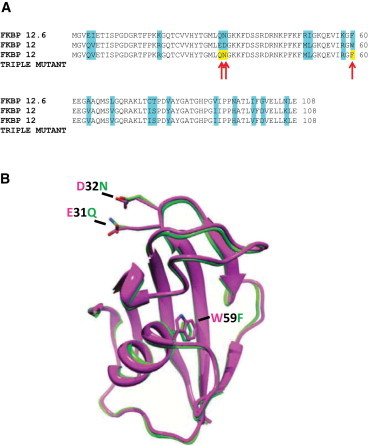
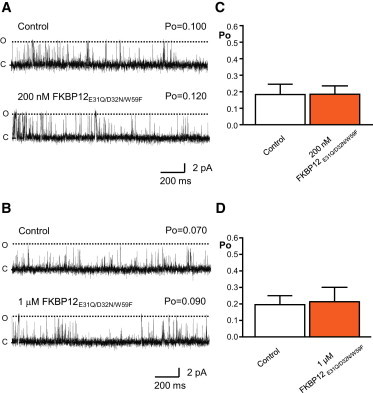
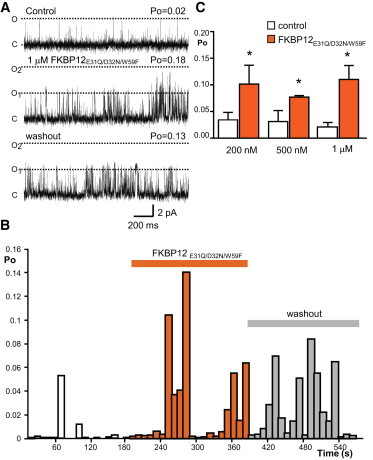
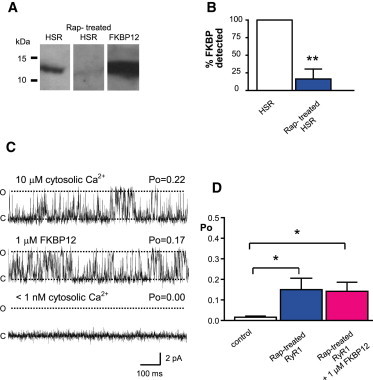
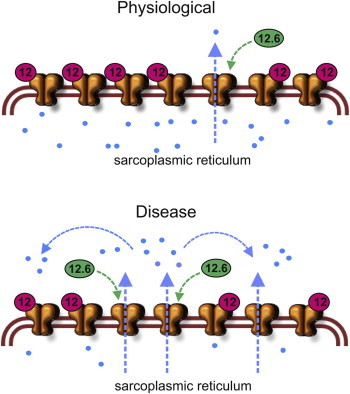
We have previously shown that FKBP12 associates with RyR2 in cardiac muscle and that it modulates RyR2 function differently to FKBP12.6. We now investigate how these proteins affect the single-channel behavior of RyR1 derived from rabbit skeletal muscle. Our results show that FKBP12.6 activates and FKBP12 inhibits RyR1. It is likely that both proteins compete for the same binding sites on RyR1 because channels that are preactivated by FKBP12.6 cannot be subsequently inhibited by FKBP12. We produced a mutant FKBP12 molecule (FKBP12E31Q/D32N/W59F) where the residues Glu(31), Asp(32), and Trp(59) were converted to the corresponding residues in FKBP12.6. With respect to the functional regulation of RyR1 and RyR2, the FKBP12E31Q/D32N/W59F mutant lost all ability to behave like FKBP12 and instead behaved like FKBP12.6. FKBP12E31Q/D32N/W59F activated RyR1 but was not capable of activating RyR2. In conclusion, FKBP12.6 activates RyR1, whereas FKBP12 activates RyR2 and this selective activator phenotype is determined within the amino acid residues Glu(31), Asp(32), and Trp(59) in FKBP12 and Gln(31), Asn(32), and Phe(59) in FKBP12.6. The opposing but different effects of FKBP12 and FKBP12.6 on RyR1 and RyR2 channel gating provide scope for diversity of regulation in different tissues.


Figures

Figure 1
Figure 1
FKBP12.6 activates rabbit skeletal RyR1. (A) A typical single-channel experiment showing marked activation of RyR1 by 10 pM FKBP12.6. The bottom trace shows washout of FKBP12.6 from the cytosolic chamber. Po values are indicated. Dashed lines indicate open (O1, O2) and closed (C) channel levels, respectively. (B) Mean Po data obtained before and after addition of 10 pM, 200 nM, and 1 μM FKBP12.6 (SE; n = 5–11; ∗∗∗p < 0.001; p < 0.05). Each concentration represents a set of independent experiments. To see this figure in color, go online.
Figure 2
Figure 2
Inhibitory effects of FKBP12 on rabbit skeletal RyR1. (A) A representative experiment showing that RyR1 Po is reduced by 500 nM FKBP12. The bottom trace shows that perfusion of the cis chamber back to control solutions did not reverse the reduction in Po. The dashed lines indicate open (O) and closed (C) channel levels, respectively. Po values are indicated above each trace. (B) Mean data showing that 500 nM FKBP12 inhibits RyR1 activity (SE; n = 8; p < 0.05). (C) Diary plot showing RyR1 Po in the presence of 10 μM cytosolic Ca2+ (control), after addition of 500 nM FKBP12 and after cis chamber perfusion back to control solutions. Single-channel traces were subdivided into 10 s sections and Po was measured for each section and plotted against time. Note that even during control periods, RyR1 channels display marked variability of gating over time with random switching between low and high Po modes. The bars indicate the times of incubation with FKBP12 and washout of FKBP12. To see this figure in color, go online.
Figure 3
Figure 3
Preaddition of FKBP12.6 prevents the inhibition of rabbit skeletal RyR1 by FKBP12. (A) A representative diary plot of RyR1 Po changes following preincubation with 200 nM FKBP12.6 and subsequent addition of 500 nM FKBP12 (incubation periods are shown by the bars). Control solutions contained 10 μM cytosolic Ca2+ as the sole channel activator. Subsequent addition of 500 nM FKBP12 did not override the activating effects of FKBP12.6. After washout of the cis chamber, Po was not completely reversed to control values. (B) Bar chart showing the mean Po data for control, preaddition of 200 nM FKBP12.6, subsequent addition of 500 nM FKBP12, and washout to control solutions (SE; n = 4). Pretreatment with picomolar levels of FKBP12.6 (C) or FKBP12 (D) at the 10:1 ratio of FKBP12:FKBP12.6 that is expected in situ, was able to block the subsequent addition of the other FKBP isoform (SE; n = 10–11; p < 0.05). To see this figure in color, go online.
Figure 4
Figure 4
Comparison of FKBP12 and FKBP12.6 proteins to highlight the amino acid substitutions of the FKBP12E31Q/D32N/W59F mutant. (A) Amino acid sequence alignments of human FKBP12, human FKBP12.6, and FKBP12E31Q/D32N/W59F. The residues of FKBP12 and FKBP12.6 that differ are highlighted in blue. The red arrows indicate the three amino acid residues that were substituted into the FKBP12E31Q/D32N/W59F mutant. (B) Overlaid ribbon diagrams of human FKBP12 and human FKBP12.6 based on their crystal structures (RCSB PDB accession codes 2DG3 and 1C9H, respectively) showing the three residues highlighted as most likely relevant amino acid substitutions between the two proteins. The dashes indicate these residues: Glu31 in FKBP12 is replaced by Gln31 from FKBP12.6 (E31Q); Asp32 in FKBP12 is replaced by Asn32 from FKBP12.6 (D32N); Trp59 in FKBP12 is replaced by Phe59 from FKBP12.6 (W59F). Mammalian FKBP12 and FKBP12.6 are highly conserved and Fig. S3 shows sequence alignment of several species demonstrating that the three residues that we chose to mutate were absolutely conserved in FKBP12 and were different but, again, absolutely conserved in FKBP12.6.
Figure 5
Figure 5
Effects of FKBP12E31Q/D32N/W59F on sheep cardiac RyR2 gating. A and B are typical examples of single-channel experiments demonstrating that neither 200 nM (A) or 1 μM (B) FKBP12E31Q/D32N/W59F cause any observable effects on RyR2 activity. Dashed lines indicate open (O) and closed (C) channel levels, respectively. Po values are indicated. C and D illustrate mean Po before and after addition of 200 nM (C) and 1 μM (D) FKBP12E31Q/D32N/W59F, respectively (SE; n = 5). To see this figure in color, go online.
Figure 6
Figure 6
FKBP12E31Q/D32N/W59F activates rabbit skeletal RyR1. (A) A typical experiment showing that 1 μM FKBP12E31Q/D32N/W59F activates RyR1. The effects were not reversed after washout of the cis chamber (bottom trace). Open (O1, O2) and closed (C) channel levels are marked with dashed lines. (B) Diary plot of a typical RyR1 single-channel experiment. After washout of the cis chamber, Po did not reverse to control values. The bars indicate the incubation time with the mutant protein and subsequent washout of the protein from the cis chamber. (C) Mean Po values before and after addition of 200 nM, 500 nM, and 1 μM FKBP12E31Q/D32N/W59F (SE; n = 7–11; p < 0.05). Each concentration represents a set of independent experiments. To see this figure in color, go online.
Figure 7
Figure 7
Rapamycin irreversibly activates rabbit skeletal RyR1. (A) Immunochemical detection of FKBP associated with skeletal HSR before (left lane) and after (middle lane) rapamycin treatment (as described in Methods). HSR was loaded at a protein concentration of 25 μg. Recombinant purified FKBP12 was loaded at 500 ng as a positive control (right lane). (B) The percentage of FKBP detected in HSR after rapamycin treatment (Rap-treated HSR) is compared to control levels (HSR) (SD, n = 3, ∗∗p < 0.01). (C) Shows a representative example of a rapamycin pretreated RyR1 channel reconstituted into a bilayer. (O) and (C) indicate the open and the closed channel levels, respectively. Addition of 1 μM FKBP12 to the cytosolic side of the channel (second trace) did not lower Po. Lowering the cytosolic [Ca2+] to <1 nM (by addition of 10 mM EGTA) shut the channel (bottom trace). (D) Mean Po values for control channels (untreated), rapamycin-treated channels (Rap-treated RyR1), and Rap-treated channels after addition of 1 μM FKBP12 (Rap-treated RyR1 + 1 μM FKBP12) are illustrated (SE; n = 3–7; p < 0.05). To see this figure in color, go online.
Figure 8
Figure 8
Proposed model of FKBP regulation of SR Ca2+ release in skeletal muscle. Under normal conditions, evidence suggests that RyR1 is predominantly bound by FKBP12, which maintains RyR1 in a low Po mode. The occasional binding of FKBP12.6 to RyR1 would lead to a minority of channels with increased Po. In disease or aging, it is reported that less FKBP12 is associated with RyR1. We speculate that a greater fraction of RyR1 channels may be bound by FKBP12.6, which would increase the numbers of leaky RyR1 channels. To see this figure in color, go online.

Similar articles

Cited by

References

    1. Marx S.O., Reiken S., Marks A.R. PKA phosphorylation dissociates FKBP12.6 from the calcium release channel (ryanodine receptor): defective regulation in failing hearts. Cell. 2000;101:365–376. - PubMed
    1. Wehrens X.H., Lehnart S.E., Marks A.R. Enhancing calstabin binding to ryanodine receptors improves cardiac and skeletal muscle function in heart failure. Proc. Natl. Acad. Sci. USA. 2005;102:9607–9612. - PMC - PubMed
    1. Reiken S., Lacampagne A., Marks A.R. PKA phosphorylation activates the calcium release channel (ryanodine receptor) in skeletal muscle: defective regulation in heart failure. J. Cell Biol. 2003;160:919–928. - PMC - PubMed
    1. Bellinger A.M., Mongillo M., Marks A.R. Stressed out: the skeletal muscle ryanodine receptor as a target of stress. J. Clin. Invest. 2008;118:445–453. - PMC - PubMed
    1. Bellinger A.M., Reiken S., Marks A.R. Hypernitrosylated ryanodine receptor calcium release channels are leaky in dystrophic muscle. Nat. Med. 2009;15:325–330. - PMC - PubMed

Publication types

MeSH terms

Substances

LinkOut - more resources