

Stochastic fusion simulations and experiments suggest passive and active roles of hemagglutinin during membrane fusion
- PMID: 24559987
- PMCID: PMC3944606
- DOI: 10.1016/j.bpj.2013.12.048
Stochastic fusion simulations and experiments suggest passive and active roles of hemagglutinin during membrane fusion
Abstract
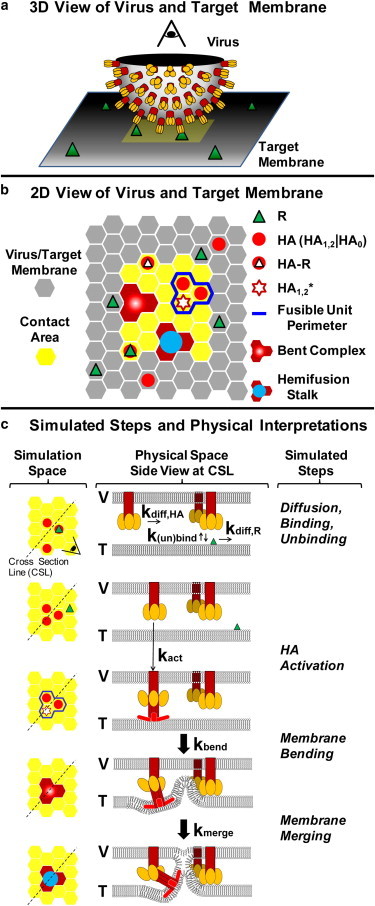
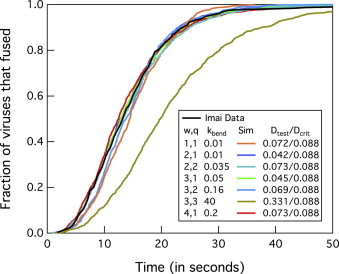
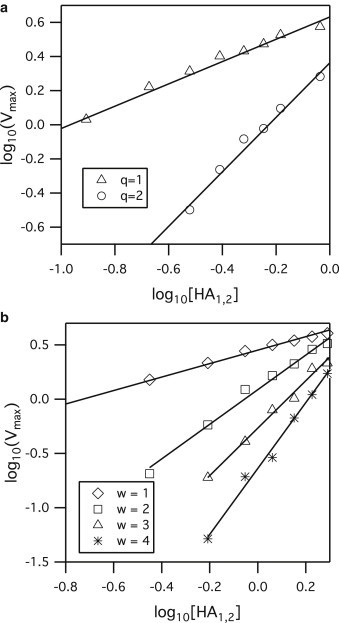
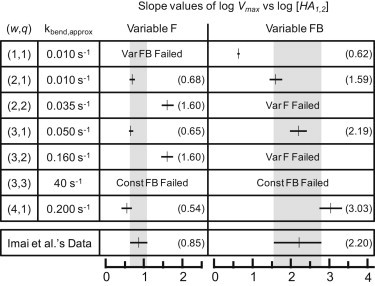
Influenza enters the host cell cytoplasm by fusing the viral and host membrane together. Fusion is mediated by hemagglutinin (HA) trimers that undergo conformational change when acidified in the endosome. It is currently debated how many HA trimers, w, and how many conformationally changed HA trimers, q, are minimally required for fusion. Conclusions vary because there are three common approaches for determining w and q from fusion data. One approach correlates the fusion rate with the fraction of fusogenic HA trimers and leads to the conclusion that one HA trimer is required for fusion. A second approach correlates the fusion rate with the total concentration of fusogenic HA trimers and indicates that more than one HA trimer is required. A third approach applies statistical models to fusion rate data obtained at a single HA density to establish w or q and suggests that more than one HA trimer is required. In this work, all three approaches are investigated through stochastic fusion simulations and experiments to elucidate the roles of HA and its ability to bend the target membrane during fusion. We find that the apparent discrepancies among the results from the various approaches may be resolved if nonfusogenic HA participates in fusion through interactions with a fusogenic HA. Our results, based on H3 and H1 serotypes, suggest that three adjacent HA trimers and one conformationally changed HA trimer are minimally required to induce membrane fusion (w = 3 and q = 1).
Copyright © 2014 Biophysical Society. Published by Elsevier Inc. All rights reserved.
Figures
Similar articles
-
Influenza-virus membrane fusion by cooperative fold-back of stochastically induced hemagglutinin intermediates.Elife. 2013 Feb 19;2:e00333. doi: 10.7554/eLife.00333. Elife. 2013. PMID: 23550179 Free PMC article.
-
Minimal aggregate size and minimal fusion unit for the first fusion pore of influenza hemagglutinin-mediated membrane fusion.Biophys J. 2000 Jan;78(1):227-45. doi: 10.1016/S0006-3495(00)76587-8. Biophys J. 2000. PMID: 10620288 Free PMC article.
-
Influenza virus-mediated membrane fusion: determinants of hemagglutinin fusogenic activity and experimental approaches for assessing virus fusion.Viruses. 2012 Jul;4(7):1144-68. doi: 10.3390/v4071144. Epub 2012 Jul 24. Viruses. 2012. PMID: 22852045 Free PMC article. Review.
-
Membrane fusion by single influenza hemagglutinin trimers. Kinetic evidence from image analysis of hemagglutinin-reconstituted vesicles.J Biol Chem. 2006 May 5;281(18):12729-35. doi: 10.1074/jbc.M600902200. Epub 2006 Feb 27. J Biol Chem. 2006. PMID: 16505474
-
Architecture of the influenza hemagglutinin membrane fusion site.Biochim Biophys Acta. 2003 Jul 11;1614(1):24-35. doi: 10.1016/s0005-2736(03)00160-3. Biochim Biophys Acta. 2003. PMID: 12873763 Review.
Cited by
-
Single-Virus Fusion Measurements Reveal Multiple Mechanistically Equivalent Pathways for SARS-CoV-2 Entry.J Virol. 2023 May 31;97(5):e0199222. doi: 10.1128/jvi.01992-22. Epub 2023 May 3. J Virol. 2023. PMID: 37133381 Free PMC article.
-
Viral fusion efficacy of specific H3N2 influenza virus reassortant combinations at single-particle level.Sci Rep. 2016 Oct 18;6:35537. doi: 10.1038/srep35537. Sci Rep. 2016. PMID: 27752100 Free PMC article.
-
Modeling the Role of Epitope Arrangement on Antibody Binding Stoichiometry in Flaviviruses.Biophys J. 2016 Oct 18;111(8):1641-1654. doi: 10.1016/j.bpj.2016.09.003. Biophys J. 2016. PMID: 27760352 Free PMC article.
-
Image Restoration and Analysis of Influenza Virions Binding to Membrane Receptors Reveal Adhesion-Strengthening Kinetics.PLoS One. 2016 Oct 3;11(10):e0163437. doi: 10.1371/journal.pone.0163437. eCollection 2016. PLoS One. 2016. PMID: 27695072 Free PMC article.
-
Influenza virus-mediated membrane fusion: Structural insights from electron microscopy.Arch Biochem Biophys. 2015 Sep 1;581:86-97. doi: 10.1016/j.abb.2015.04.011. Epub 2015 May 6. Arch Biochem Biophys. 2015. PMID: 25958107 Free PMC article. Review.
References
-
- Doms R.W., Helenius A., White J. Membrane fusion activity of the influenza virus hemagglutinin. The low pH-induced conformational change. J. Biol. Chem. 1985;260:2973–2981. - PubMed
-
- Skehel J.J., Wiley D.C. Receptor binding and membrane fusion in virus entry: the influenza hemagglutinin. Annu. Rev. Biochem. 2000;69:531–569. - PubMed
Publication types
MeSH terms
Substances
LinkOut - more resources
Full Text Sources
Other Literature Sources
