. 2014 Feb 18;106(4):895-904.
doi: 10.1016/j.bpj.2013.12.004.

Self crowding of globular proteins studied by small-angle x-ray scattering

Affiliations

Self crowding of globular proteins studied by small-angle x-ray scattering

David P Goldenberg et al. Biophys J. .

Abstract

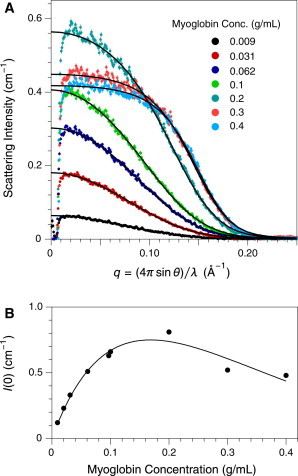
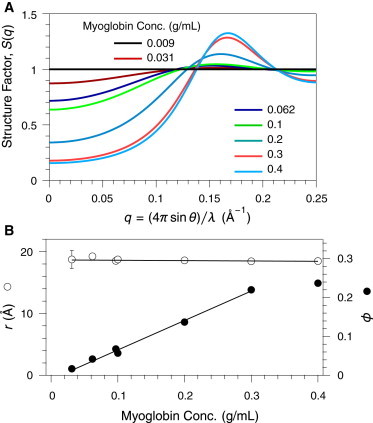
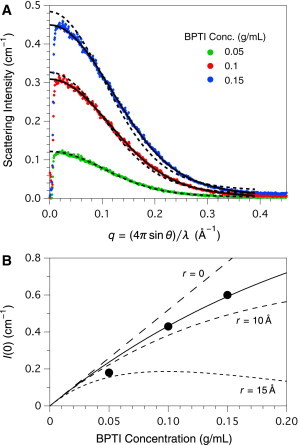
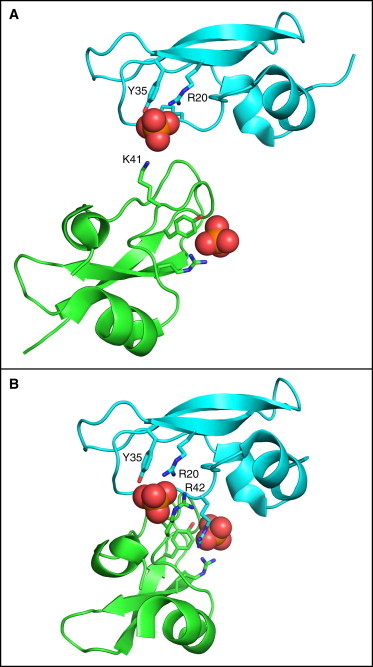
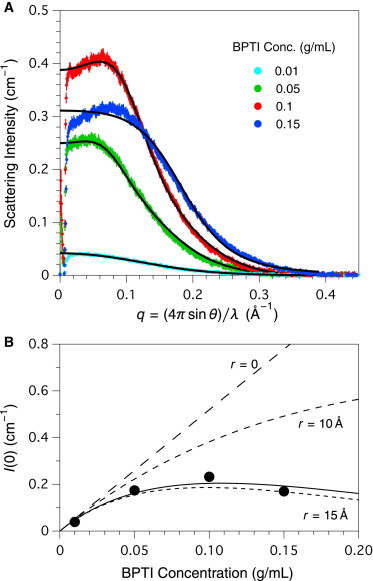
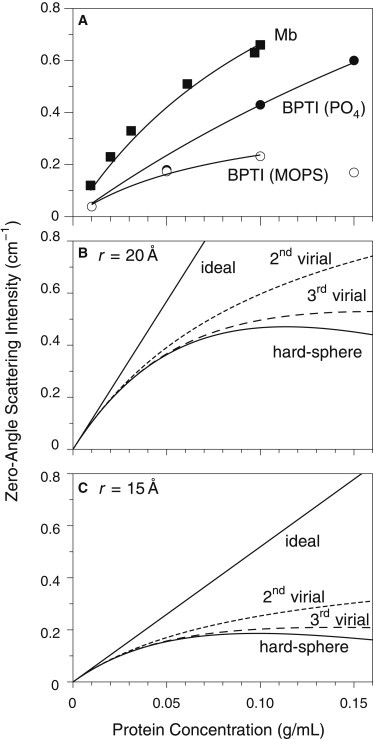
Small-angle x-ray scattering (SAXS) was used to study the behavior of equine metmyoglobin (Mb) and bovine pancreatic trypsin inhibitor (BPTI) at concentrations up to 0.4 and 0.15 g/mL, respectively, in solutions also containing 50% D2O and 1 M urea. For both proteins, significant effects because of interference between x-rays scattered by different molecules (interparticle interference) were observed, indicating nonideal behavior at high concentrations. The experimental data were analyzed by comparison of the observed scattering profiles with those predicted by crystal structures of the proteins and a hard-sphere fluid model used to represent steric exclusion effects. The Mb scattering data were well fit by the hard-sphere model using a sphere radius of 18 Å, only slightly smaller than that estimated from the three-dimensional structure (20 Å). In contrast, the scattering profiles for BPTI in phosphate buffer displayed substantially less pronounced interparticle interference than predicted by the hard-sphere model and the radius estimated from the known structure of the protein (15 Å). Replacing the phosphate buffer with 3-(N-morpolino)propane sulfonic acid (MOPS) led to increased interparticle interference, consistent with a larger effective radius and suggesting that phosphate ions may mediate attractive intermolecular interactions, as observed in some BPTI crystal structures, without the formation of stable oligomers. The scattering data were also used to estimate second virial coefficients for the two proteins: 2.0 ×10(-4) cm(3)mol/g(2) for Mb in phosphate buffer, 1.6 ×10(-4) cm(3)mol/g(2) for BPTI in phosphate buffer and 9.2 ×10(-4) cm(3)mol/g(2) for BPTI in MOPS. The results indicate that the behavior of Mb, which is nearly isoelectric under the conditions used, is well described by the hard-sphere model, but that of BPTI is considerably more complex and is likely influenced by both repulsive and attractive electrostatic interactions. The hard-sphere model may be a generally useful tool for the analysis of small-angle scattering data from concentrated macromolecular solutions.


Figures

Figure 1
Figure 1
Small angle x-ray scattering from horse metmyoglobin in 50% D2O, 1 M urea and 50 mM Na-phosphate, pH 7.0. (A) SAXS data were recorded using a line-collimated x-ray beam, and the experimental data are uncorrected for smearing. The decrease in intensity below q0.01Å1 is attributable to absorption by the semi-transparent beam stop. Error bars represent relative uncertainties proportional to the square root of the measured intensities. The experimental data for 0.009 g/mL Mb were fit to the form factor predicted from the Mb crystal structure (PDB entry 1ymb), after numerically convolving the predicted profile with the beam profile. For the higher Mb concentrations, the SAXS data were fit using a model incorporating the Mb form factor and the structure factor, S(q,c), for a solution of hard spheres, as described in the text. (B) Scattering intensities at zero angle were estimated by extrapolation of Guinier plots of numerically desmeared data. The curve represents a fit of the experimental data to Eq. 7, which is derived from the model for a solution of hard spheres, yielding an estimate of 18 Å for the particle radius, as described in the text. To see this figure in color, go online.
Figure 2
Figure 2
Structure factors for myoglobin solutions, determined by fitting to the SAXS data of Fig. 1A, assuming a solution of hard spheres. (A) S(q,c) plotted as a function of q at the indicated myoglobin concentrations. (B) Fit values of the parameters defining the hard-sphere solution structure factor, r the sphere radius, and ϕ the concentration expressed as the fraction volume occupied by the spheres. The lines represent least-squares fits to the data (excluding the value for ϕ at 0.4 g/mL myoglobin). To see this figure in color, go online.
Figure 3
Figure 3
Small angle x-ray scattering from BPTI in 50% D2O, 1 M urea and 50 mM Na-phosphate, pH 7.0. (A) SAXS data were recorded and processed as described in the text and the legend to Fig. 1. The experimental data were fit to the scattering profile predicted from the crystal structure of BPTI (PDB entry 4pti), after numerically convolving the predicted profile with the beam profile. The dashed curves represent fits to the predicted form factor for BPTI, without incorporation of a structure factor. The solid curves represent fits to the BPTI form factor and the structure factor for a hard-sphere solution, with the fit parameters listed in Table 1. (B) The scattering intensities at zero angle were estimated by extrapolation of Guinier plots of numerically-desmeared data. The solid curve represents the fit of Eq. 7 to the experimental data, with a fixed value of the constant K = 5.2 cm2/g, and the fit sphere volume corresponding to a radius of 8.4 Å. The dashed curves are predicted from Eq. 7 using the same value of K and the indicated sphere radii. To see this figure in color, go online.
Figure 4
Figure 4
Phosphate-mediated intermolecular interactions in form II (A) and form III (B) crystals of BPTI. In each panel, the backbones of the two BPTI molecules are shown in a ribbon representation, and atoms of the phosphate ion are shown as spheres. The side-chains from each molecule that interact most directly with the phosphate are labeled and represented as sticks. Drawn from the atomic coordinates of PDB entries 5pti (A) and 6pti (B), using the program PyMOL (50) To see this figure in color, go online.
Figure 5
Figure 5
Small angle x-ray scattering from BPTI in 50% D2O, 1 M urea and 50 mM MOPS, pH 7.0. SAXS data were recorded and processed as described in the text and the legend to Fig. 1. The experimental data for 0.01 g/mL BPTI were fit to the form factor predicted from the crystal structure of BPTI, after numerically convolving the predicted profile with the beam profile. The data for the higher BPTI concentrations were fit to the predicted profile incorporating the BPTI form factor and the structure factor for a solution of hard spheres. The fit values for the sphere radius and volume fraction are listed in Table 1. (B) The scattering intensities at zero angle were estimated by linear extrapolation of numerically desmeared data. The solid curve represents the fit of Eq. 7 to the experimental data, with a fixed value of the constant K = 5.2 cm2/g and the fit sphere volume corresponding to a radius of 14.5 Å. The dashed curves are predicted from Eq. 7 using the same value of K and the indicated sphere radii. To see this figure in color, go online.
Figure 6
Figure 6
Analysis of zero-angle scattering intensities using the second-order virial representation. (A) The measured scattering intensities for Mb and BPTI were fit to Eq. 10, with the values of K fixed to those predicted by Eq. 3 and the molecular parameters specified in Materials and Methods. In each case, the curve indicates the range of concentrations used for the fit. The fit values for A2, the second virial coefficient, were 2.0 ×10-4, 1.6 ×10-4, and 9.2 ×10-4 cm3mol/g2 for Mb, BPTI in phosphate buffer and BPTI in MOPS, respectively. (B) Predicted dependence of I (0) for myoglobin, assuming ideal behavior, the analytic form of the hard-sphere structure factor (Eq. 7) or second- or third-order virial representations of S (0) (Eq. 9). In each case, a sphere radius of 20 Å was used, and K was assumed to have the value calculated from the molecular properties of Mb. (C) Predicted dependence of I (0) for BPTI, using the same representations as in panel B. For these calculations a sphere radius of 15 Å was used, and K was assumed to have the value calculated from the molecular properties of BPTI.

Comment in

Similar articles

Cited by

References

    1. Saluja A., Kalonia D.S. Nature and consequences of protein-protein interactions in high protein concentration solutions. Int. J. Pharm. 2008;358:1–15. - PubMed
    1. Shire S.J. Formulation and manufacturability of biologics. Curr. Opin. Biotechnol. 2009;20:708–714. - PubMed
    1. Wiencek J.M. New strategies for protein crystal growth. Annu. Rev. Biomed. Eng. 1999;1:505–534. - PubMed
    1. George A., Wilson W.W. Predicting protein crystallization from a dilute solution property. Acta Crystallogr. D Biol. Crystallogr. 1994;50:361–365. - PubMed
    1. Bonneté F., Finet S., Tardieu A. Second virial coefficient: variations with lysozyme crystallization conditions. J. Cryst. Growth. 1999;196:403–414.

Publication types

LinkOut - more resources