Review
. 2014 May:207:223-39.
doi: 10.1016/j.cis.2014.01.015. Epub 2014 Jan 28.

Comparison between the behavior of different hydrophobic peptides allowing membrane anchoring of proteins

Affiliations
Review

Comparison between the behavior of different hydrophobic peptides allowing membrane anchoring of proteins

Mustapha Lhor et al. Adv Colloid Interface Sci. 2014 May.

Abstract

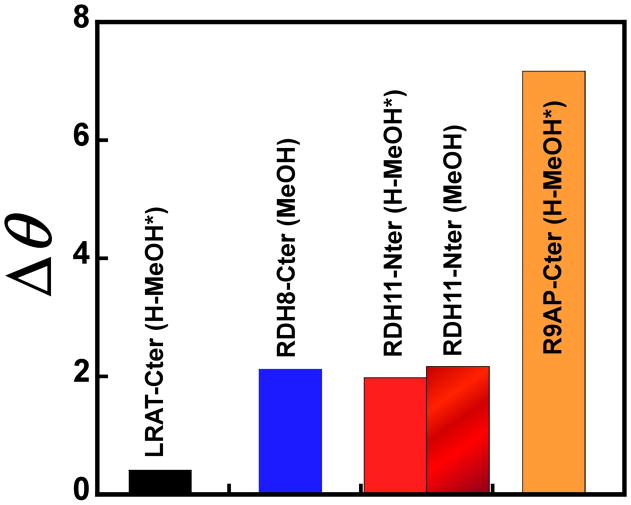
Membrane binding of proteins such as short chain dehydrogenase reductases or tail-anchored proteins relies on their N- and/or C-terminal hydrophobic transmembrane segment. In this review, we propose guidelines to characterize such hydrophobic peptide segments using spectroscopic and biophysical measurements. The secondary structure content of the C-terminal peptides of retinol dehydrogenase 8, RGS9-1 anchor protein, lecithin retinol acyl transferase, and of the N-terminal peptide of retinol dehydrogenase 11 has been deduced by prediction tools from their primary sequence as well as by using infrared or circular dichroism analyses. Depending on the solvent and the solubilization method, significant structural differences were observed, often involving α-helices. The helical structure of these peptides was found to be consistent with their presumed membrane binding. Langmuir monolayers have been used as membrane models to study lipid-peptide interactions. The values of maximum insertion pressure obtained for all peptides using a monolayer of 1,2-dioleoyl-sn-glycero-3-phospho-ethanolamine (DOPE) are larger than the estimated lateral pressure of membranes, thus suggesting that they bind membranes. Polarization modulation infrared reflection absorption spectroscopy has been used to determine the structure and orientation of these peptides in the absence and in the presence of a DOPE monolayer. This lipid induced an increase or a decrease in the organization of the peptide secondary structure. Further measurements are necessary using other lipids to better understand the membrane interactions of these peptides.

Keywords: Circular dichroism and infrared spectroscopy; Lecithin retinol acyltransferase; Monolayer; R9AP; Retinol dehydrogenase; Transmembrane hydrophobic peptide.


Figures

Fig 1
Fig 1. Predicted secondary structure of the peptides obtained using the I-TASSER server
Each sequence has been analyzed using two online tools: I-TASSER [73, 75] and Proteinprediction [76]. The two predictions resulted in similar data except for the LRAT-Cter peptide. In the case of this peptide, three additional online tools were used: Sspro [77], SSpro8 [77] and PSIPRED [78], resulting in consistent data with the I-TASSER prediction. The secondary structure presented is that obtained with the highest confidence score (Conf.Score). The confidence scores range from 0 to 9 which correspond respectively to the lowest and the highest confidence. H, helix; S, strand or β-sheet; C, coil.
Fig 2
Fig 2. Circular dichroism and infrared spectra of the RDH8-Cter (A-B), RDH11-Nter (C–D), LRAT-Cter (E–F) and R9AP-Cter (G–H) peptides in different solvents
The RDH8-Cter, RDH11-Nter and R9AP-Cter peptides were purchased from Peptide 2.0 (Chantilly, VA) whereas the LRAT-Cter peptide was from Anaspec (Fremont, CA). The purity of the peptides was tested by mass spectroscopy and HPLC: 97% purity for RDH8-Cter, 93% for RDH11-Nter, >70% for LRAT-Cter and 92% for R9AP-Cter. Circular dichroic spectra were collected on a Jasco spectropolarimeter (Model J-815, Jasco, Easton, MD) at a peptide concentration of 150 μM. The spectra have been normalized to take into account the number of amino acids of each individual peptide. Indeed, the molar ellipticity is expressed in degree cm2 dmol−1 × 10⁴. The concentration in dmol−1 is obtained as follows: protein concentration (g/mL) × number of amino acids/molar mass of each individual peptide. The spectra have been measured in different solvents depending on their solubility: Methanol (MeOH, black curves), HFIP (blue curves) and H-MeOH* (solubilized first in HFIP and evaporation of HFIP and then solubilized in MeOH; pink curves). The buffer contribution was subtracted and the corrected spectra were analyzed in the 190–260 nm range. Infrared spectra were recorded using a Nicolet Magna 850 Fourier transform infrared spectrometer from Thermo Scientific (Madison, WI) equipped with a liquid nitrogen cooled narrow-band mercury cadmium telluride detector and a Golden Gate ATR accessory. Infrared spectra were recorded using a peptide concentration of 150 μM for RDH8-Cter (B), RDH11-Nter (D) and LRAT-Cter (F) and R9AP-Cter (H) in the same solvents as those used in circular dichroism. Infrared spectra are the result of a subtraction of the spectrum of the appropriate solvent from that of the peptide in solution. The infrared spectrum of each peptide powder (orange curves) is also presented in this figure. The maximum of the amide I bands has been determined by performing a second derivative (or Fourier deconvolution) of the spectra with the software Omnic which is available with the spectrometer. A 3D structural model of the RDH8-Cter, RDH11-Nter, LRAT-Cter and R9AP-Cter peptides obtained using the I-TASSER server is shown in inset of figures B, D, F and H, respectively. These models are built based on multiple-threading alignments by LOMETS and interactive TASSER simulations; function insights are then derived by matching the predicted models with protein function databases [73]. Several models were uploaded from the I-TASSER online server for the peptides, but a single 3D model has been selected for each peptide because of its consistency with the secondary structure prediction and the analysis of the infrared spectra.
Fig. 3
Fig. 3. Comparison between the difference in molar ellipticity of the RDH8-Cter, RDH11-Nter, LRAT-Cter and R9AP-Cter peptides calculated from the circular dichroism spectra shown in Fig. 2
The difference in molar ellipticity (Δθ) between the maximum at ~190–199 nm and the minima at ~204–208 nm (Δθ = [θ]max(190-199) − [θ]min(204-208)) is shown for each peptide. The peptides were solubilized as described in the legend of Fig. 2. The comparison is made with MeOH because the RDH8-Cter peptide is only soluble in this solvent.
Fig. 4
Fig. 4. Instrument and procedure to prepare lipid monolayers and to study peptide binding using the Langmuir model membrane system
A) Picture of the microtroughs sold by the company Kibron (Helsinki, Finland) which have been used for the measurement of peptide binding to lipid monolayers. B) Schematic diagram of the adsorption of peptides at the lipid/water interface. All surface pressure measurements in monolayer were performed with the Delta Pi4 instrument from Kibron.
Fig 5
Fig 5. PM-IRRAS spectra of the R9AP-Cter peptide measured either after spreading the peptide (or the DOPE-peptide mixture) at the air-water interface or after injecting the peptide into the subphase of the DOPE monolayer
The trough and PM-IRRAS have been described previously [357]. The subphase buffer contains 50 mM Tris HCl, 150 mM NaCl and 5 mM β-mercaptoethanol (pH 7.4). The final concentration of the injected peptide is 5 μM. A ratio of 20/1 (3.2/0.16 nmoles) has been used for the spread DOPE-peptide mixture. The spectra have been normalized to facilitate their comparison. A) Comparison of the PM-IRRAS spectra of the individual peptide either injected into the subphase (Πe = 16.8 mN/m, black curve) or spread at the air-water interface (Πe = 7.8 mN/m, red curve) and then compressed to 12.9 mN/m (blue curve) (in the absence of a lipid monolayer). B) Comparison between the PM-IRRAS spectra of the peptide injected underneath a DOPE monolayer (Πe = 21 mN/m, orange curve) and of a DOPE-peptide mixture spread at the air-water interface and compressed to a Πe=13 mN/m (green curve).
Fig. 6
Fig. 6. Determination of the saturating surface concentration of peptides for the monolayer measurements
Typical example of the extent of peptide adsorption using the R9AP-Cter peptide. The final subphase concentrations are 0.25, 0.3, 0.8, 2, 5, 12 μM. The R9AP-Cter peptide solubilized in H-MeOH has been injected into the subphase of a microtrough of 500 μL (Kibron) in the absence of a lipid monolayer. The surface pressure at equilibrium (Πe) obtained after ~0.5 hour of adsorption is plotted as a function of the concentration of the R9AP-Cter peptide. The optimal concentration of R9AP-Cter peptide is lying between 3 and 5 μM. Inset: Typical adsorption kinetics of the R9AP-Cter peptide at the surface of a buffer containing 50 mM Tris HCl, 150 mM NaCl, and 5 mM β-mercaptoethanol (pH 7.4) at a final peptide concentration of 2 μM (only one kinetics of adsorption has been shown for clarity).
Fig. 7
Fig. 7. Determination of the maximum insertion pressure and the synergy of peptides in the presence of a DOPE monolayer
A) The MIP of the peptides has been determined by extrapolating the plot of the surface pressure increase (ΔΠ) as a function of the initial surface pressure (Πi) where the curve reaches a value of 0 on the x-axis. The surface pressure increase corresponds to ΔΠ = Πe − Πi. The curves have been obtained by measuring the binding of the RDH8-Cter, RDH11-Nter, LRAT-Cter and R9AP-Cter peptides onto a DOPE monolayer at different Πi as a function of time (shown in the inset). Inset: Typical adsorption kinetics after the injection of the RDH8-Cter, RDH11-Nter, LRAT-Cter and R9AP-Cter peptides at a final subphase concentration of 2.5, 1.25, 1.25 and 5 μM, respectively, underneath a DOPE monolayer at a Πi of ~10 mN/m. The subphase buffer comprises 50 mM Tris, 150 mM NaCl, and 5 mM β-mercaptoethanol (pH 7.4) for all peptides. Histograms of the MIP (B) and of the synergy (C) values of the RDH8-Cter, RDH11-Nter, LRAT-Cter and R9AP-Cter peptides in the presence of a DOPE monolayer. The synergy is obtained by adding 1 to the slope of the curves shown in (A).
Fig. 8
Fig. 8. Schematic representation of the instrument used to perform polarization modulation infrared reflection absorption spectroscopy (PM-IRRAS) measurements
The PM-IRRAS has been developed to determine the structure and orientation of peptides in monolayers at the air-water interface [137, 357].
Fig. 9
Fig. 9. Comparison between two different ways to treat PM-IRRAS spectra of a peptide bound to a lipid monolayer
The spectrum « Subtraction of buffer » is resulting from the subtraction of the spectrum of the subphase from that of the peptide-phospholipid monolayer. The spectrum « Subtraction of lipid » is resulting from the subtraction of the spectrum of the phospholipid monolayer from that of the peptide-phospholipid monolayer. The RDH11-Nter peptide dissolved in HFIP has been injected into the subphase (50 mM Tris HCl, 150 mM NaCl, and 5 mM β-mercaptoethanol, pH 7.4) of a DOPE monolayer at an initial surface pressure of 21 mN/m. The final concentration of the peptide was 1.25 μM.
Fig. 10
Fig. 10. PM-IRRAS spectra of the peptides in monolayers
RDH8-Cter (A), RDH11-Nter (B), LRAT-Cter (C) and R9AP-Cter (D) peptides in the absence and in the presence of a DOPE monolayer. The spectra have been normalized to facilitate their comparison. The subphase buffer is composed of 50 mM Tris HCl, 150 mM NaCl, and 5 mM β-mercaptoethanol (pH 7.4) for all peptides. The final concentration of the RDH8-Cter, RDH11-Nter, LRAT-Cter and R9AP-Cter peptides is 2.5, 1.25, 1.25 and 5 μM, respectively.

References

    1. Yeagle PL, Albert AD. Biochim Biophys Acta. 2007;1768:808. - PubMed
    1. Chini B, Parenti M, Poyner DR, Wheatley M. Biochem Soc Trans. 2013;41:135. - PubMed
    1. Katritch V, Cherezov V, Stevens RC. Annu Rev Pharmacol Toxicol. 2013;53:531. - PMC - PubMed
    1. Audet M, Bouvier M. Cell. 2012;151:14. - PubMed
    1. Hofmann KP, Scheerer P, Hildebrand PW, Choe HW, Park JH, Heck M, et al. Trends Biochem Sci. 2009;34:540. - PubMed

LinkOut - more resources