. 2014 Feb 21;17(1):18765.
doi: 10.7448/IAS.17.1.18765. eCollection 2014.

Sources of HIV incidence among stable couples in sub-Saharan Africa

Affiliations

Sources of HIV incidence among stable couples in sub-Saharan Africa

Hiam Chemaitelly et al. J Int AIDS Soc. .

Abstract

Introduction: The recent availability of efficacious prevention interventions among stable couples offers new opportunities for reducing HIV incidence in sub-Saharan Africa. Understanding the dynamics of HIV incidence among stable couples is critical to inform HIV prevention strategy across sub-Saharan Africa.

Methods: We quantified the sources of HIV incidence arising among stable couples in sub-Saharan Africa using a cohort-type mathematical model parameterized by nationally representative data. Uncertainty and sensitivity analyses were incorporated.

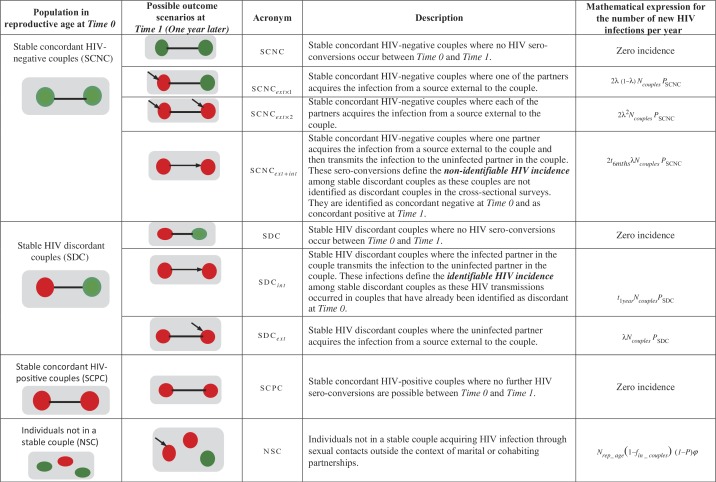
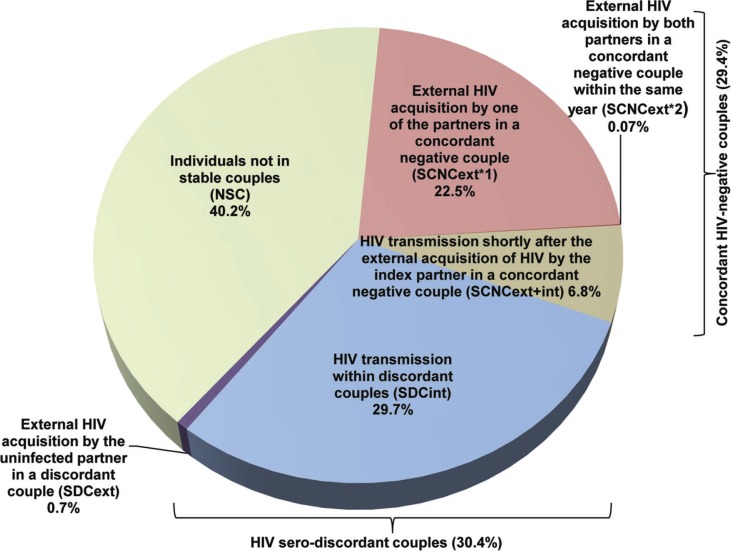
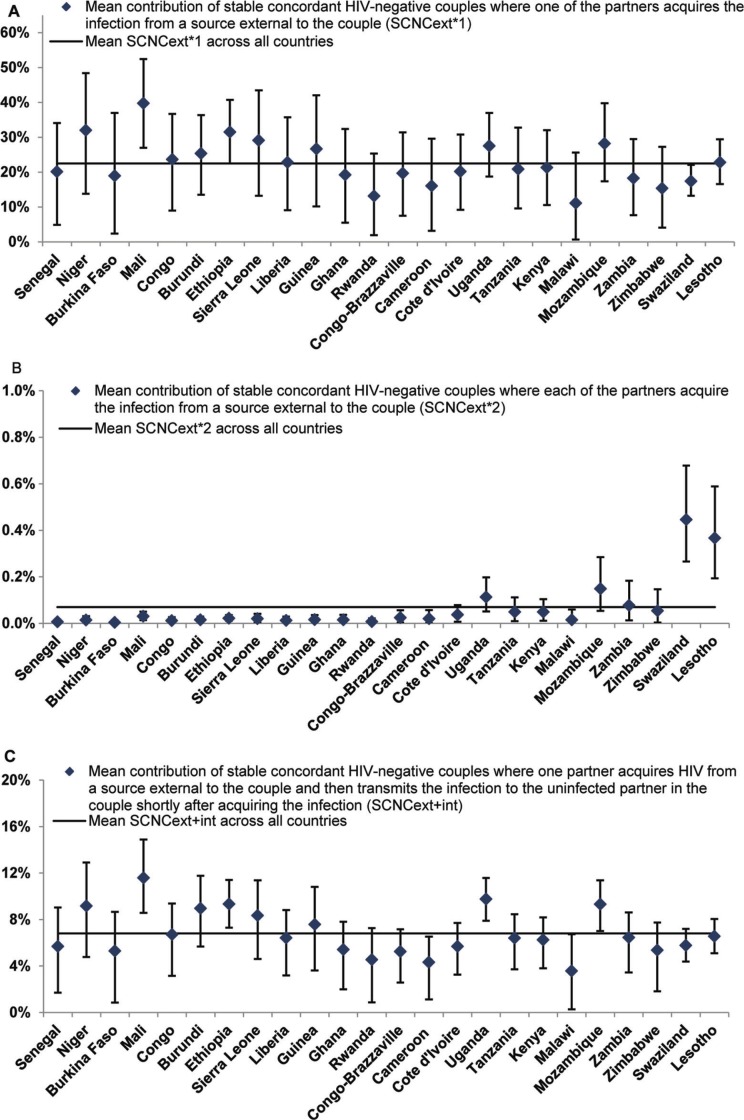
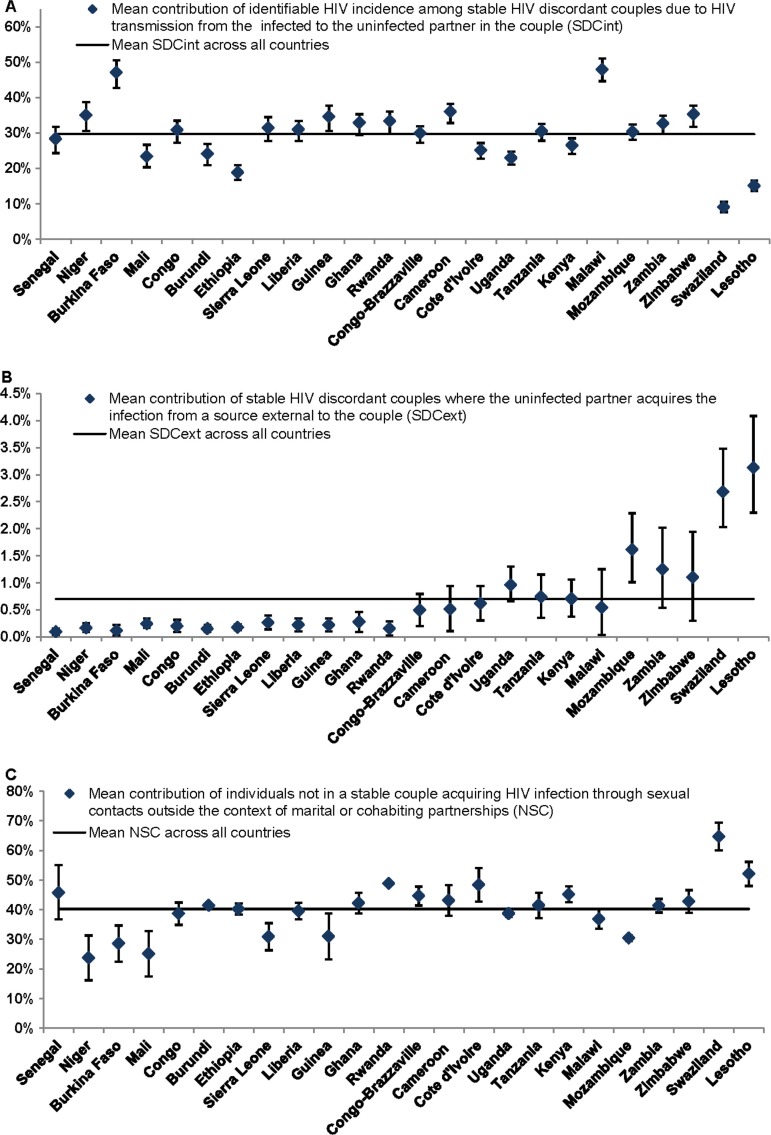
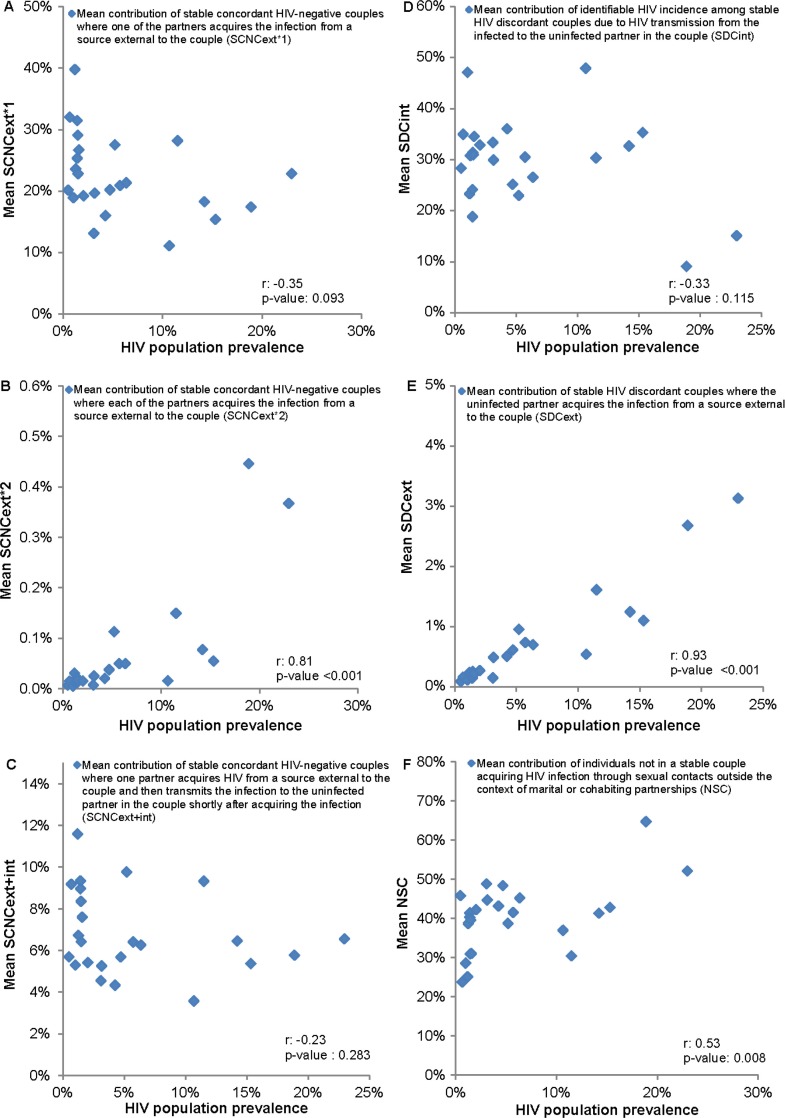
Results: HIV incidence arising among stable concordant HIV-negative couples contribute each year, on average, 29.4% of total HIV incidence; of those, 22.5% (range: 11.1%-39.8%) are infections acquired by one of the partners from sources external to the couple, less than 1% are infections acquired by both partners from external sources within a year and 6.8% (range: 3.6%-11.6%) are transmissions to the uninfected partner in the couple in less than a year after the other partner acquired the infection from an external source. The mean contribution of stable HIV sero-discordant couples to total HIV incidence is 30.4%, with most of those, 29.7% (range: 9.1%-47.9%), being due to HIV transmissions from the infected to the uninfected partner within the couple. The remaining incidence, 40.2% (range: 23.7%-64.6%), occurs among persons not in stable couples.

Conclusions: Close to two-thirds of total HIV incidence in sub-Saharan Africa occur among stable couples; however, only half of this incidence is attributed to HIV transmissions from the infected to the uninfected partner in the couple. The remaining incidence is acquired through extra-partner sex. Substantial reductions in HIV incidence can be achieved only through a prevention approach that targets all modes of HIV exposure among stable couples and among individuals not in stable couples.

Keywords: HIV incidence; Sub-Saharan Africa; demographic and health surveys; mathematical model; sources of infection; stable couples.


Figures

Figure 1
Figure 1
Model conceptualization for HIV incidence in the population classified based on the sero-status of stable couples and source of infection. The table shows the possible outcome scenarios and the associated mathematical expressions for the different HIV incidence measures. The green circle indicates an HIV sero-negative individual, while the red circle indicates an HIV sero-positive individual. *Parameters include λ: the probability of an HIV sero-negative partner in a stable couple (SC) to acquire the infection from a source external to the couple over the course of one year; N couples: the number of SCs identified in the baseline screening cross-sectional survey at Time 0; P SCNC: the prevalence of stable concordant HIV-negative couples among all couples; P SDC: the prevalence of stable HIV discordant couples among all couples; t 6mths: the probability that the index partner who acquired the infection from an external source will transmit the infection to the uninfected partner during the six months following the acquisition of HIV; t 1year: the probability that the index partner in a stable HIV discordant couple will transmit the infection to the uninfected partner during the time between the two cross-sectional surveys at Time 0 and Time 1; N rep_age: the size of the population in reproductive age; f in_couples: the fraction of the population in reproductive age engaged in SCs; P: HIV prevalence in the population; ϕ: the HIV population-level incidence rate.
Figure 2
Figure 2
The average contributions to the total number of new HIV incident infections in a year in the population stratified by couples’ sero-status and source of HIV infection for 24 countries in sub-Saharan Africa. The average for each mode of exposure represents an average over the country-specific mean contribution measures (fraction of new HIV infections relative to total HIV incidence in the population in a given year). For each country, the mean contribution of each source of exposure to total HIV incidence was calculated based on 10,000 runs of the model using Monte Carlo sampling from triangular probability distributions for the specified ranges of model parameters.
Figure 3
Figure 3
Mean and 95% confidence interval of the contributions of HIV incidence among stable concordant HIV-negative couples to total HIV incidence in the population in 24 countries in sub-Saharan Africa. The figure shows the contribution of HIV incidence among stable concordant HIV-negative couple where: (A) one partner acquires the infection from a source external to the couple, (B) each of the partners acquire the infection from a source external to the couple and (C) one partner acquires the infection from a source external to the couple and then transmits it to the uninfected partner in the couple. Estimates were calculated based on 10,000 runs of the model for each country using Monte Carlo sampling from triangular probability distributions for the specified ranges of uncertainty of the model parameters. Countries are shown in order of increasing HIV prevalence. The horizontal line in the different panels represents the average for the contribution measure in question across all countries.
Figure 4
Figure 4
Mean and 95% confidence interval of the contributions of: (A) identifiable HIV incidence among stable HIV discordant couples due to HIV transmission from the infected to the uninfected partner in the couple, (B) HIV incidence among stable HIV discordant couples due to acquiring the infection from a source external to the couple and (C) HIV incidence among individuals not in stable couples. These measures, for 24 countries in sub-Saharan Africa, are relative to total HIV incidence in the population in each country. Estimates were calculated based on 10,000 runs of the model for each country using Monte Carlo sampling from triangular probability distributions for the specified ranges of uncertainty of the model parameters. Countries are shown in order of increasing HIV prevalence. The horizontal line in the different panels represents the average for the contribution measure in question across all countries.
Figure 5
Figure 5
Correlation with HIV prevalence of the mean contribution of: (A) stable concordant HIV-negative couples where one partner acquires the infection from a source external to the couple (SCNCext×1), (B) stable concordant HIV-negative couples where each of the partners acquire the infection from a source external to the couple (SCNCext×2), (C) stable concordant HIV-negative couples where one partner acquires the infection from a source external to the couple and then transmits it to the uninfected partner in the couple (SCNCext+int), (D) identifiable HIV incidence among stable HIV discordant couples due to HIV transmission from the infected to the uninfected partner in the couple (SDCint), (E) HIV incidence among stable HIV discordant couples due to acquiring the infection from a source external to the couple (SDCext) and (F) HIV incidence among individuals not in a stable couple (NSC). Values for the Pearson correlation coefficients (r) and their associated p-values are incorporated. The analysis discounts the uncertainty in these measures (arising from uncertainty analyses).

References

    1. Chemaitelly H, Cremin I, Shelton JD, Hallett TB, Abu-Raddad LJ. Distinct HIV discordancy patterns by epidemic size in stable sexual partnerships in sub-Saharan Africa. Sex Transm Infect. 2012;88:51–7. - PMC - PubMed
    1. Guthrie BL, De Bruyn G, Farquhar C. HIV-1-discordant couples in sub-Saharan Africa: explanations and implications for high rates of discordancy. Curr HIV Res. 2007;5(4):416–29. - PubMed
    1. Lingappa JR, Lambdin B, Bukusi EA, Ngure K, Kavuma L, Inambao M, et al. Regional differences in prevalence of HIV-1 discordance in Africa and enrollment of HIV-1 discordant couples into an HIV-1 prevention trial. PLoS One. 2008;3(1):e1411. - PMC - PubMed
    1. Bunnell R, Opio A, Musinguzi J, Kirungi W, Ekwaru P, Mishra V, et al. HIV transmission risk behavior among HIV-infected adults in Uganda: results of a nationally representative survey. AIDS. 2008;22(5):617–24. - PubMed
    1. Baryarama F, Bunnell R, McFarland W, Hudes ES, Neilands TB, Ransom RL, et al. Estimating HIV incidence in voluntary counseling and testing clients in Uganda (1992–2003) J Acquir Immune Defic Syndr. 2007;44(1):99–105. - PubMed

Publication types

LinkOut - more resources