

Incorporating inter-relationships between different levels of genomic data into cancer clinical outcome prediction
- PMID: 24561168
- PMCID: PMC4664202
- DOI: 10.1016/j.ymeth.2014.02.003
Incorporating inter-relationships between different levels of genomic data into cancer clinical outcome prediction
Abstract
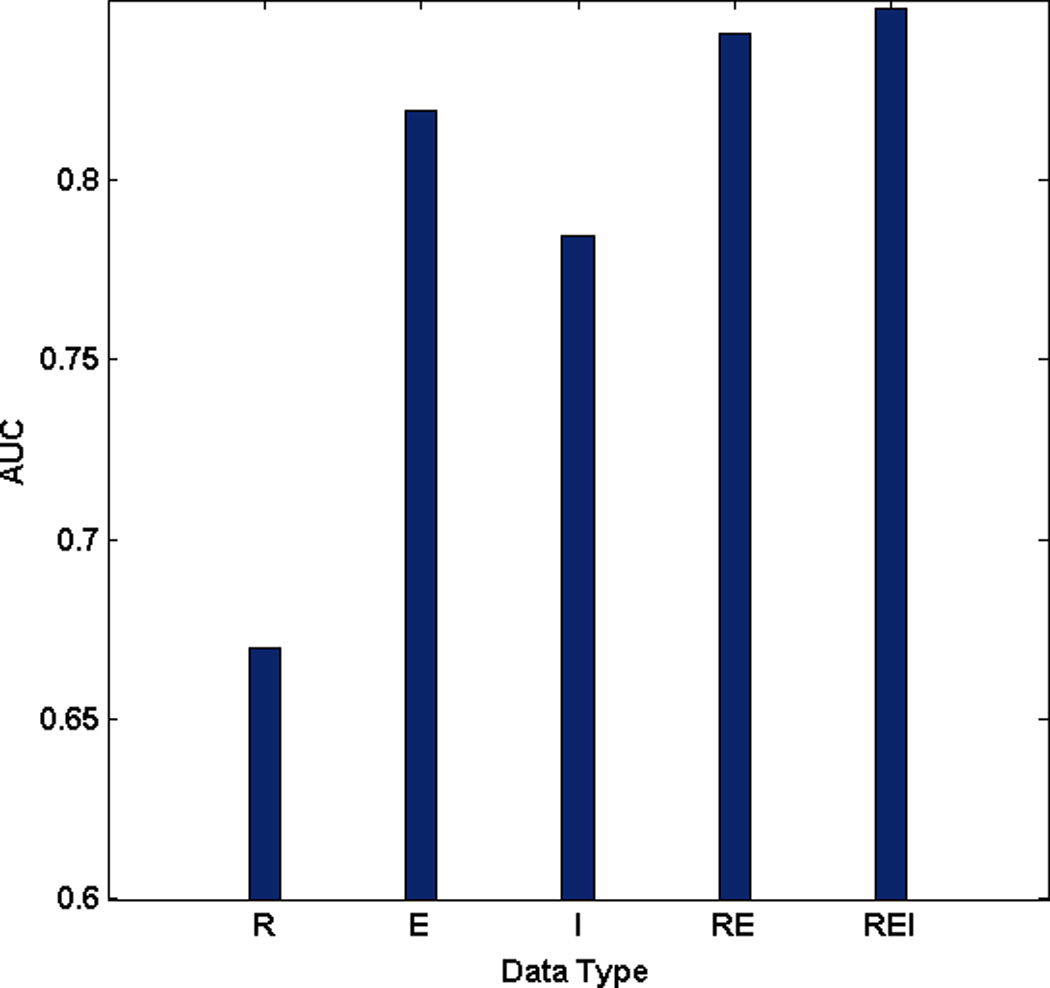
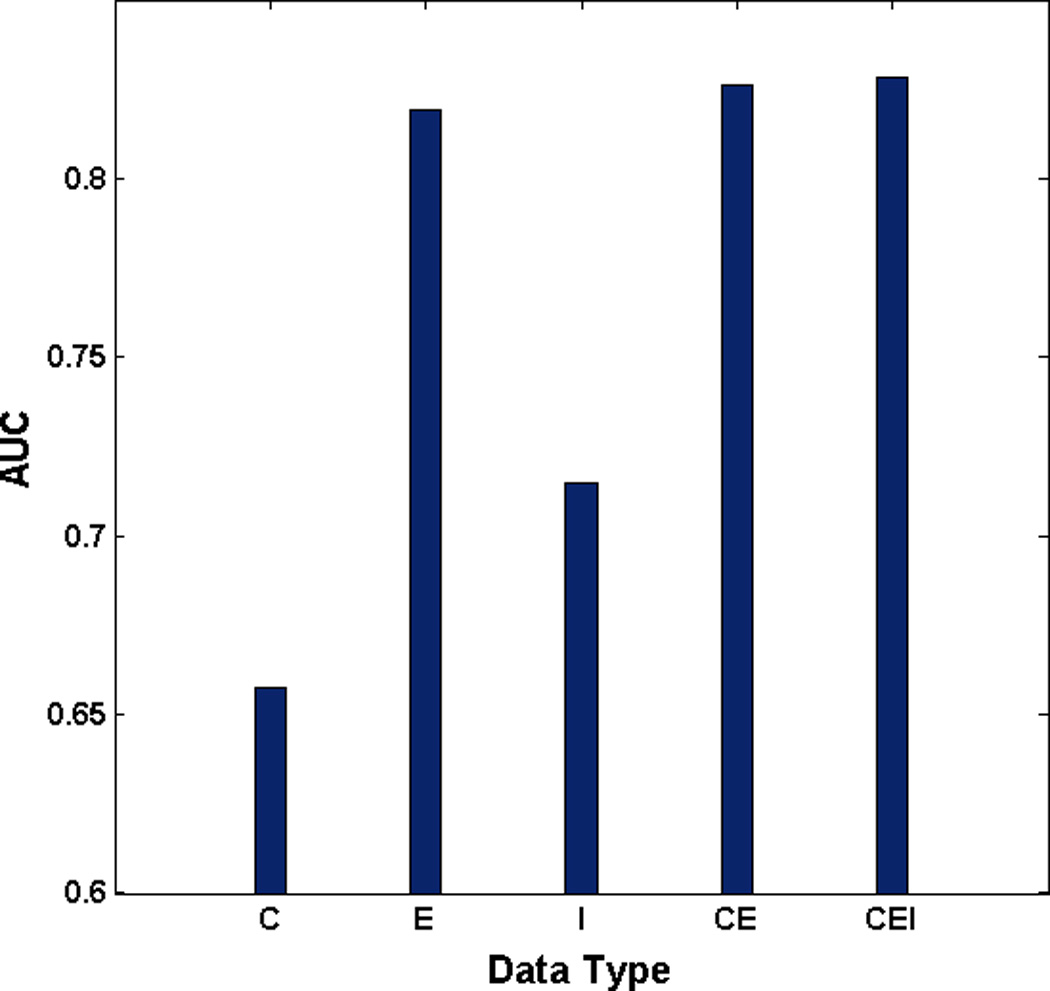
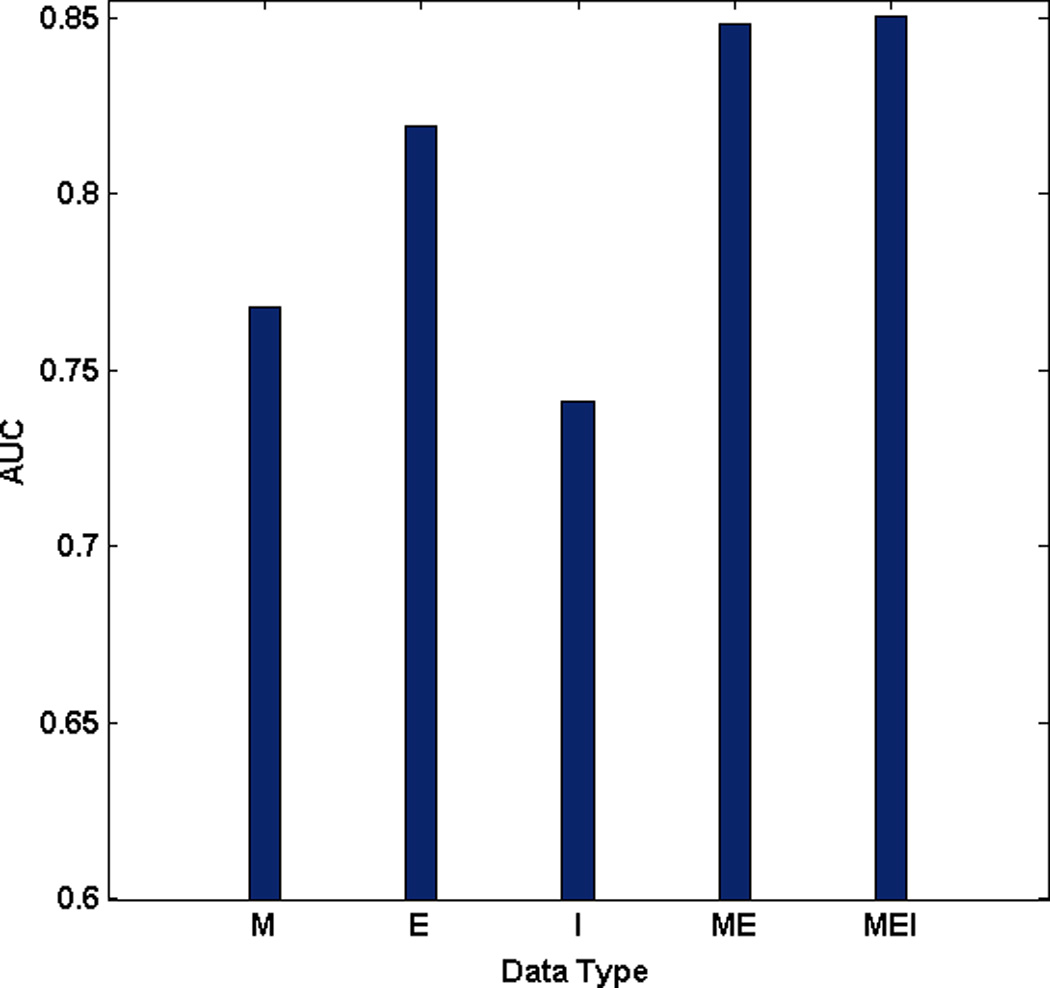
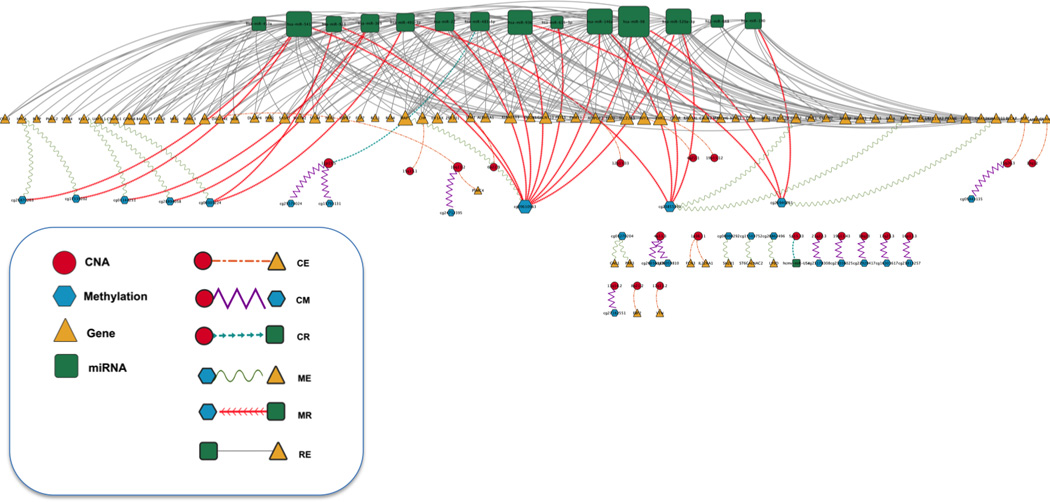
In order to improve our understanding of cancer and develop multi-layered theoretical models for the underlying mechanism, it is essential to have enhanced understanding of the interactions between multiple levels of genomic data that contribute to tumor formation and progression. Although there exist recent approaches such as a graph-based framework that integrates multi-omics data including copy number alteration, methylation, gene expression, and miRNA data for cancer clinical outcome prediction, most of previous methods treat each genomic data as independent and the possible interplay between them is not explicitly incorporated to the model. However, cancer is dysregulated by multiple levels in the biological system through genomic, epigenomic, transcriptomic, and proteomic level. Thus, genomic features are likely to interact with other genomic features in the different genomic levels. In order to deepen our knowledge, it would be desirable to incorporate such inter-relationship information when integrating multi-omics data for cancer clinical outcome prediction. In this study, we propose a new graph-based framework that integrates not only multi-omics data but inter-relationship between them for better elucidating cancer clinical outcomes. In order to highlight the validity of the proposed framework, serous cystadenocarcinoma data from TCGA was adopted as a pilot task. The proposed model incorporating inter-relationship between different genomic features showed significantly improved performance compared to the model that does not consider inter-relationship when integrating multi-omics data. For the pair between miRNA and gene expression data, the model integrating miRNA, for example, gene expression, and inter-relationship between them with an AUC of 0.8476 (REI) outperformed the model combining miRNA and gene expression data with an AUC of 0.8404. Similar results were also obtained for other pairs between different levels of genomic data. Integration of different levels of data and inter-relationship between them can aid in extracting new biological knowledge by drawing an integrative conclusion from many pieces of information collected from diverse types of genomic data, eventually leading to more effective screening strategies and alternative therapies that may improve outcomes.
Keywords: Clinical outcome prediction; Data integration; Inter-relationship; Multi-omics data; Ovarian cancer; TCGA.
Copyright © 2014 Elsevier Inc. All rights reserved.
Conflict of interest statement
All authors declared that there is no conflict of interest in this research.
Figures


Similar articles
-
Knowledge boosting: a graph-based integration approach with multi-omics data and genomic knowledge for cancer clinical outcome prediction.J Am Med Inform Assoc. 2015 Jan;22(1):109-20. doi: 10.1136/amiajnl-2013-002481. Epub 2014 Jul 7. J Am Med Inform Assoc. 2015. PMID: 25002459 Free PMC article.
-
Intra-relation reconstruction from inter-relation: miRNA to gene expression.BMC Syst Biol. 2013 Oct 16;7 Suppl 3(Suppl 3):S8. doi: 10.1186/1752-0509-7-S3-S8. BMC Syst Biol. 2013. PMID: 24521265 Free PMC article.
-
Using knowledge-driven genomic interactions for multi-omics data analysis: metadimensional models for predicting clinical outcomes in ovarian carcinoma.J Am Med Inform Assoc. 2017 May 1;24(3):577-587. doi: 10.1093/jamia/ocw165. J Am Med Inform Assoc. 2017. PMID: 28040685 Free PMC article.
-
Multi-omics approaches for biomarker discovery in early ovarian cancer diagnosis.EBioMedicine. 2022 May;79:104001. doi: 10.1016/j.ebiom.2022.104001. Epub 2022 Apr 16. EBioMedicine. 2022. PMID: 35439677 Free PMC article. Review.
-
MOBCdb: a comprehensive database integrating multi-omics data on breast cancer for precision medicine.Breast Cancer Res Treat. 2018 Jun;169(3):625-632. doi: 10.1007/s10549-018-4708-z. Epub 2018 Feb 10. Breast Cancer Res Treat. 2018. PMID: 29429018 Review.
Cited by
-
Bta-miR-10b Secreted by Bovine Embryos Negatively Impacts Preimplantation Embryo Quality.Front Genet. 2019 Aug 22;10:757. doi: 10.3389/fgene.2019.00757. eCollection 2019. Front Genet. 2019. PMID: 31507632 Free PMC article.
-
Taking Bioinformatics to Systems Medicine.Methods Mol Biol. 2016;1386:17-41. doi: 10.1007/978-1-4939-3283-2_2. Methods Mol Biol. 2016. PMID: 26677177 Free PMC article. Review.
-
Methods for multi-omic data integration in cancer research.Front Genet. 2024 Sep 19;15:1425456. doi: 10.3389/fgene.2024.1425456. eCollection 2024. Front Genet. 2024. PMID: 39364009 Free PMC article. Review.
-
Robust pathway-based multi-omics data integration using directed random walks for survival prediction in multiple cancer studies.Biol Direct. 2019 Apr 29;14(1):8. doi: 10.1186/s13062-019-0239-8. Biol Direct. 2019. PMID: 31036036 Free PMC article.
-
Topological integration of RPPA proteomic data with multi-omics data for survival prediction in breast cancer via pathway activity inference.BMC Med Genomics. 2019 Jul 11;12(Suppl 5):94. doi: 10.1186/s12920-019-0511-x. BMC Med Genomics. 2019. PMID: 31296204 Free PMC article.
References
-
- Berchuck A, Iversen ES, Lancaster JM, Pittman J, Luo J, Lee P, Murphy S, Dressman HK, Febbo PG, West M, et al. Patterns of gene expression that characterize long-term survival in advanced stage serous ovarian cancers. Clin Cancer Res. 2005;11(10):3686–3696. - PubMed
-
- Huang E, Cheng SH, Dressman H, Pittman J, Tsou MH, Horng CF, Bild A, Iversen ES, Liao M, Chen CM, et al. Gene expression predictors of breast cancer outcomes. Lancet. 2003;361(9369):1590–1596. - PubMed
-
- Roepman P, Wessels LF, Kettelarij N, Kemmeren P, Miles AJ, Lijnzaad P, Tilanus MG, Koole R, Hordijk GJ, van der Vliet PC, et al. An expression profile for diagnosis of lymph node metastases from primary head and neck squamous cell carcinomas. Nat Genet. 2005;37(2):182–186. - PubMed
-
- van 't Veer LJ, Dai H, van de Vijver MJ, He YD, Hart AA, Mao M, Peterse HL, van der Kooy K, Marton MJ, Witteveen AT, et al. Gene expression profiling predicts clinical outcome of breast cancer. Nature. 2002;415(6871):530–536. - PubMed
-
- Fan X, Shi L, Fang H, Cheng Y, Perkins R, Tong W. DNA microarrays are predictive of cancer prognosis: a re-evaluation. Clinical cancer research : an official journal of the American Association for Cancer Research. 2010;16(2):629–636. - PubMed
Publication types
MeSH terms
Grants and funding
LinkOut - more resources
Full Text Sources
Other Literature Sources
Medical
