

Mammalian flavin-containing monooxygenase (FMO) as a source of hydrogen peroxide
- PMID: 24561181
- PMCID: PMC4116332
- DOI: 10.1016/j.bcp.2014.02.006
Mammalian flavin-containing monooxygenase (FMO) as a source of hydrogen peroxide
Abstract
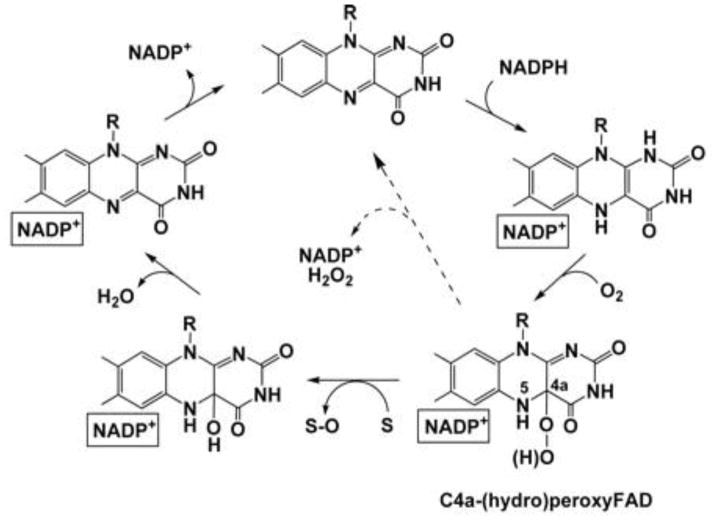
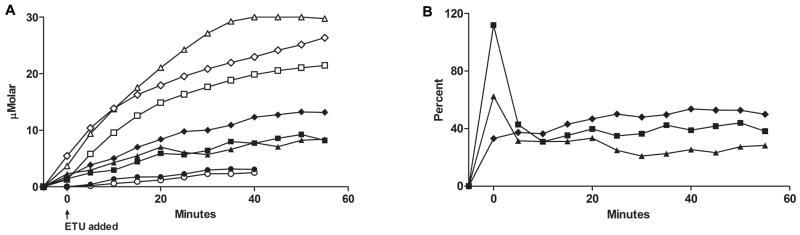
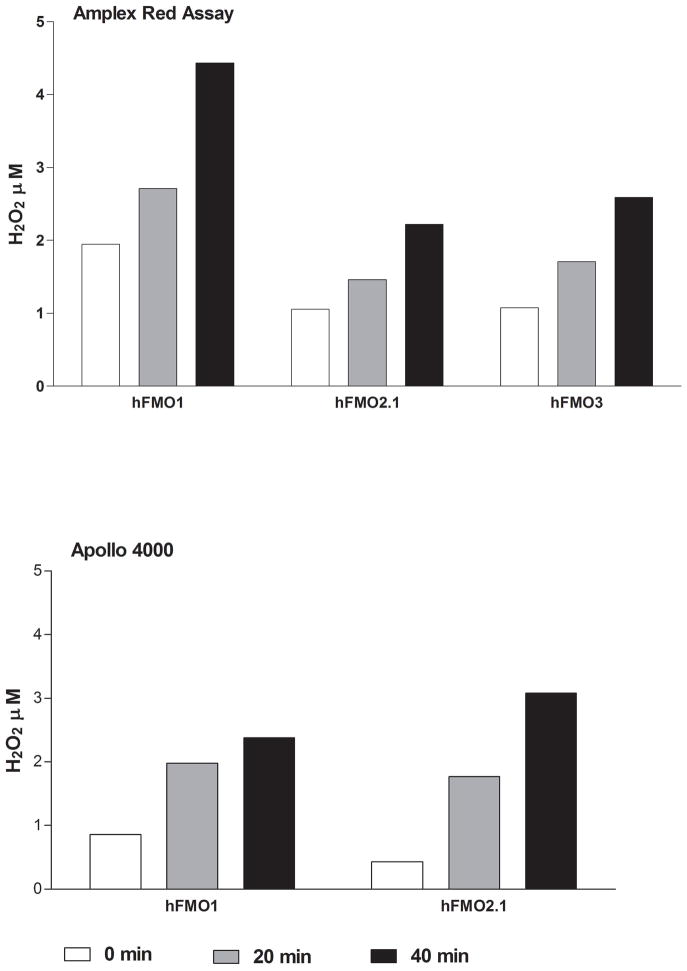
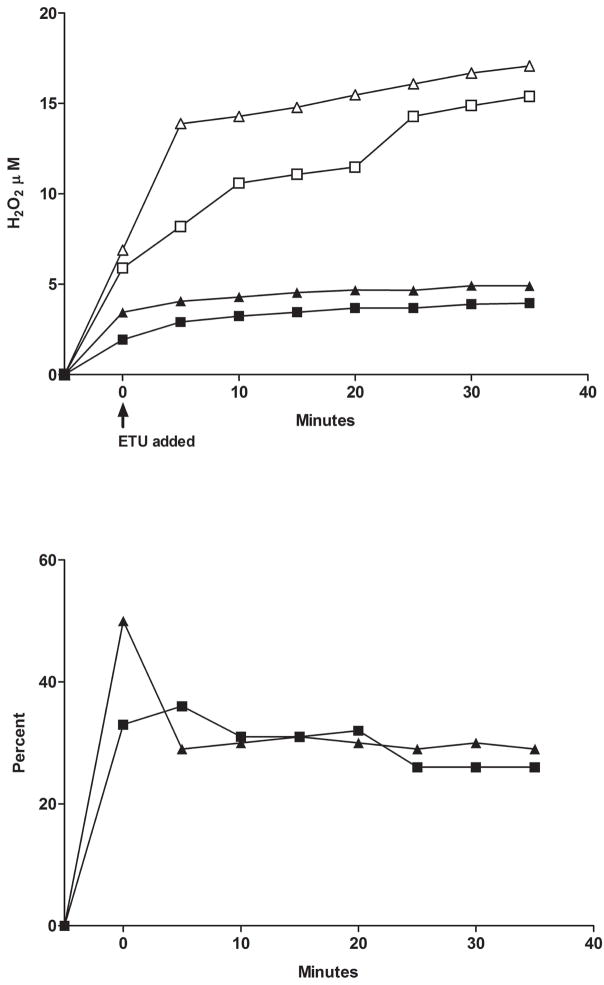
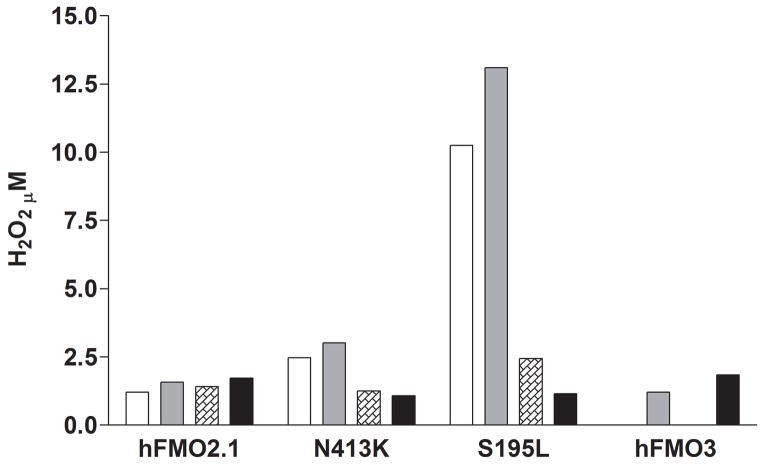
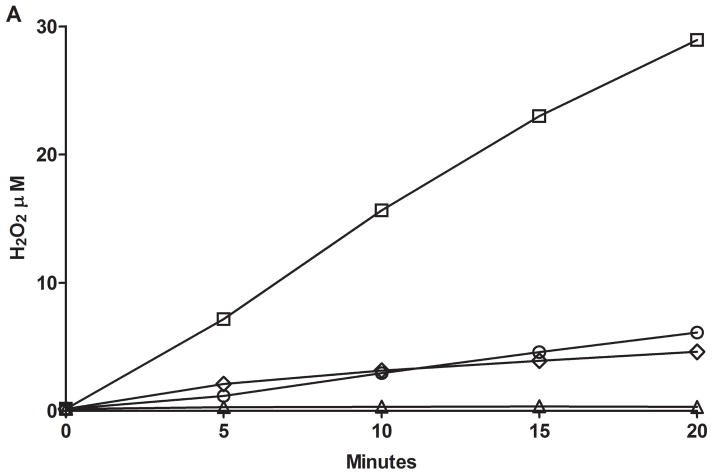
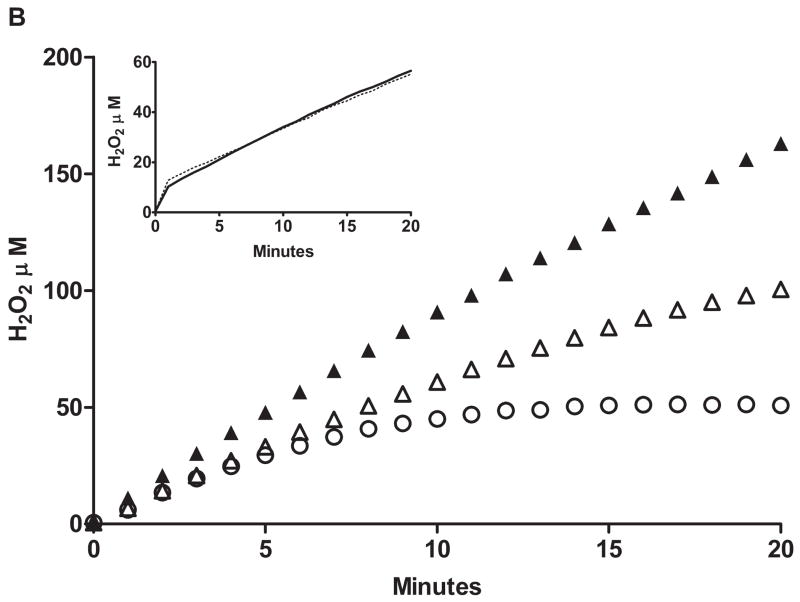
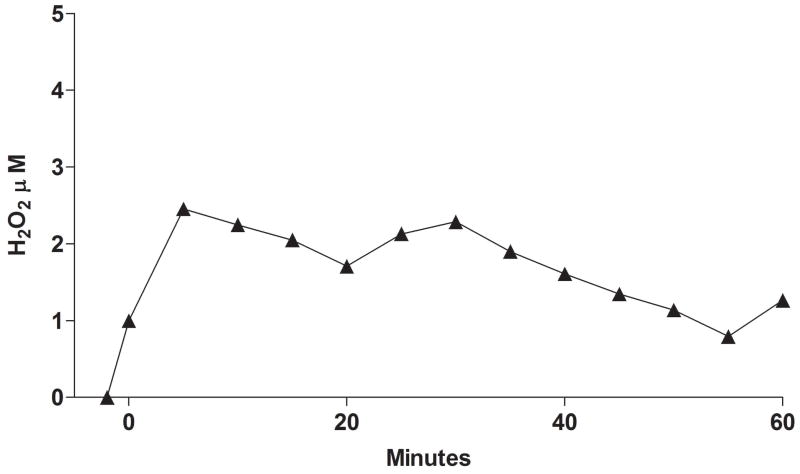
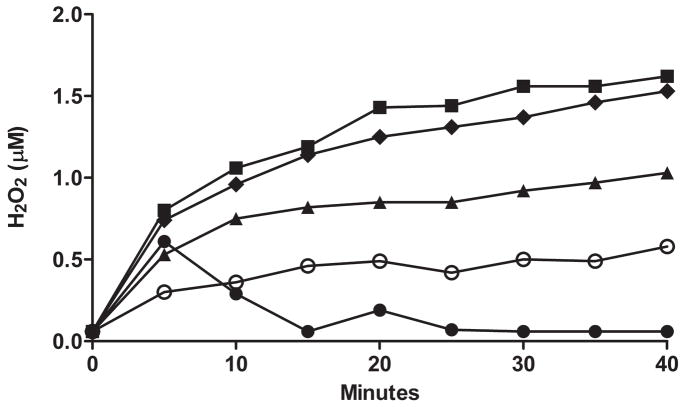
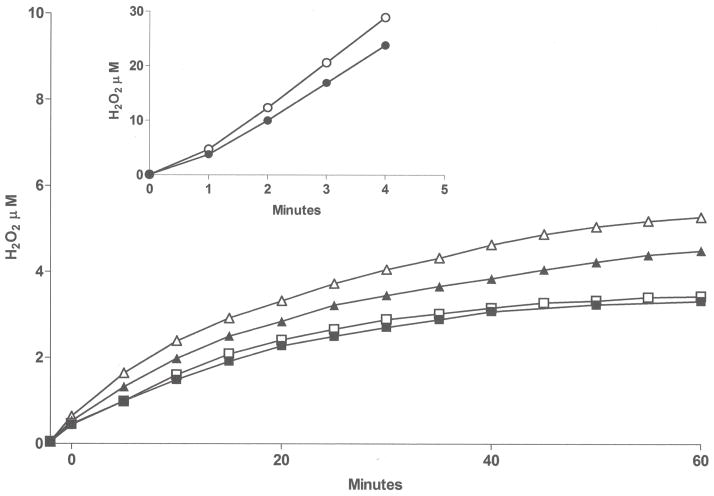
Flavin-containing monooxygenase (FMO) oxygenates drugs/xenobiotics containing a soft nucleophile through a C4a hydroperoxy-FAD intermediate. Human FMOs 1, 2 and 3, expressed in Sf9 insect microsomes, released 30-50% of O₂ consumed as H₂O₂ upon addition of NADPH. Addition of substrate had little effect on H₂O₂ production. Two common FMO2 (the major isoform in the lung) genetic polymorphisms, S195L and N413K, were examined for generation of H₂O₂. FMO2 S195L exhibited higher "leakage", producing much greater amounts of H₂O₂, than ancestral FMO2 (FMO2.1) or the N413K variant. S195L was distinct in that H₂O₂ generation was much higher in the absence of substrate. Addition of superoxide dismutase did not impact H₂O₂ release. Catalase did not reduce levels of H₂O₂ with either FMO2.1 or FMO3 but inhibited H₂O₂ generated by FMO2 allelic variants N413K and S195L. These data are consistent with FMO molecular models. S195L resides in the GxGxSG/A NADP(+) binding motif, in which serine is highly conserved (76/89 known FMOs). We hypothesize that FMO, especially allelic variants such as FMO2 S195L, may enhance the toxicity of xenobiotics such as thioureas/thiocarbamides both by generation of sulfenic and sulfinic acid metabolites and enhanced release of reactive oxygen species (ROS) in the form of H₂O₂.
Keywords: Flavin-containing monooxygenase; Genetic polymorphism; Hydrogen peroxide; Oxidative stress; Pulmonary FMO2.
Copyright © 2014 Elsevier Inc. All rights reserved.
Figures
Similar articles
-
Characterization of sulfoxygenation and structural implications of human flavin-containing monooxygenase isoform 2 (FMO2.1) variants S195L and N413K.Drug Metab Dispos. 2009 Aug;37(8):1785-91. doi: 10.1124/dmd.109.027201. Epub 2009 May 6. Drug Metab Dispos. 2009. PMID: 19420133 Free PMC article.
-
Mammalian flavin-containing monooxygenases: structure/function, genetic polymorphisms and role in drug metabolism.Pharmacol Ther. 2005 Jun;106(3):357-87. doi: 10.1016/j.pharmthera.2005.01.001. Pharmacol Ther. 2005. PMID: 15922018 Free PMC article. Review.
-
Characterization of mouse flavin-containing monooxygenase transcript levels in lung and liver, and activity of expressed isoforms.Biochem Pharmacol. 2008 Jan 15;75(2):570-9. doi: 10.1016/j.bcp.2007.09.006. Epub 2007 Sep 8. Biochem Pharmacol. 2008. PMID: 17942081 Free PMC article.
-
Human flavin-containing monooxygenase form 2 S-oxygenation: sulfenic acid formation from thioureas and oxidation of glutathione.Chem Res Toxicol. 2004 May;17(5):633-40. doi: 10.1021/tx034253s. Chem Res Toxicol. 2004. PMID: 15144220
-
Genetic polymorphisms of flavin-containing monooxygenase (FMO).Drug Metab Rev. 2002 Aug;34(3):523-32. doi: 10.1081/dmr-120005653. Drug Metab Rev. 2002. PMID: 12214664 Review.
Cited by
-
Identification of Flavin-Containing Monooxygenase 5 (FMO5) as a Regulator of Glucose Homeostasis and a Potential Sensor of Gut Bacteria.Drug Metab Dispos. 2017 Sep;45(9):982-989. doi: 10.1124/dmd.117.076612. Epub 2017 Jun 23. Drug Metab Dispos. 2017. PMID: 28646079 Free PMC article.
-
Emerging roles of flavin monooxygenase 3 in cholesterol metabolism and atherosclerosis.Curr Opin Lipidol. 2015 Oct;26(5):426-31. doi: 10.1097/MOL.0000000000000215. Curr Opin Lipidol. 2015. PMID: 26218418 Free PMC article. Review.
-
Ancestral reconstruction of mammalian FMO1 enables structural determination, revealing unique features that explain its catalytic properties.J Biol Chem. 2021 Jan-Jun;296:100221. doi: 10.1074/jbc.RA120.016297. Epub 2020 Dec 25. J Biol Chem. 2021. PMID: 33759784 Free PMC article.
-
C. elegans flavin-containing monooxygenase-4 is essential for osmoregulation in hypotonic stress.Biol Open. 2016 May 15;5(5):537-49. doi: 10.1242/bio.017400. Biol Open. 2016. PMID: 27010030 Free PMC article.
-
Hydrogen Peroxide: Its Role in Plant Biology and Crosstalk with Signalling Networks.Int J Mol Sci. 2018 Sep 18;19(9):2812. doi: 10.3390/ijms19092812. Int J Mol Sci. 2018. PMID: 30231521 Free PMC article. Review.
References
-
- Cashman JR, Zhang J. Human flavin-containing monooxygenases. Annual Review of Pharmacology and Toxicology. 2006;46:65–100. - PubMed
-
- Yeung CK, Lang DH, Thummel KE, Rettie AE. Immunoquantitation of FMO1 in human liver, kidney, and intestine. Drug Metabolism and Disposition. 2000;28:1107–1111. - PubMed
-
- Zhang J, Cashman JR. Quantitative analysis of FMO gene mRNA levels in human tissues. Drug Metabolism and Disposition. 2006;34:19–26. - PubMed
-
- Dolphin CT, Beckett DJ, Janmohamed A, Cullingford TE, Smith RL, Shephard EA, Phillips IR. The flavin-containing monooxygenase 2 gene (FMO2) of humans, but not other primates, encodes a truncated nonfunctional protein. The Journal of Biological Chemistry. 1998;273:30599–30607. - PubMed
Publication types
MeSH terms
Substances
Grants and funding
LinkOut - more resources
Full Text Sources
Other Literature Sources
Miscellaneous
