. 2014 Jul;63(7):2538-50.
doi: 10.2337/db13-1777. Epub 2014 Feb 21.

A type I interferon transcriptional signature precedes autoimmunity in children genetically at risk for type 1 diabetes

Affiliations

A type I interferon transcriptional signature precedes autoimmunity in children genetically at risk for type 1 diabetes

Ricardo C Ferreira et al. Diabetes. 2014 Jul.

Abstract

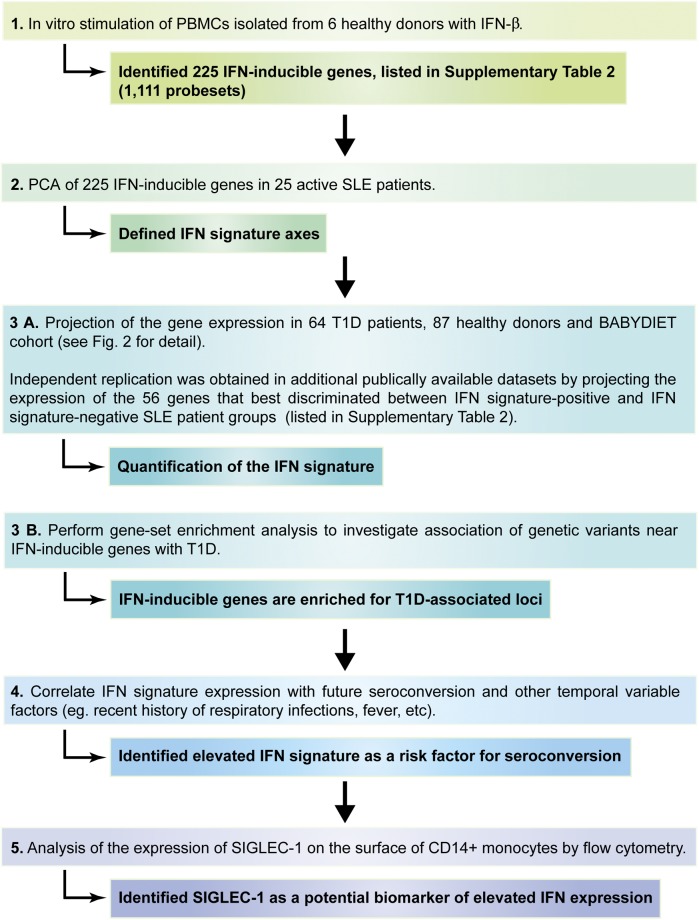
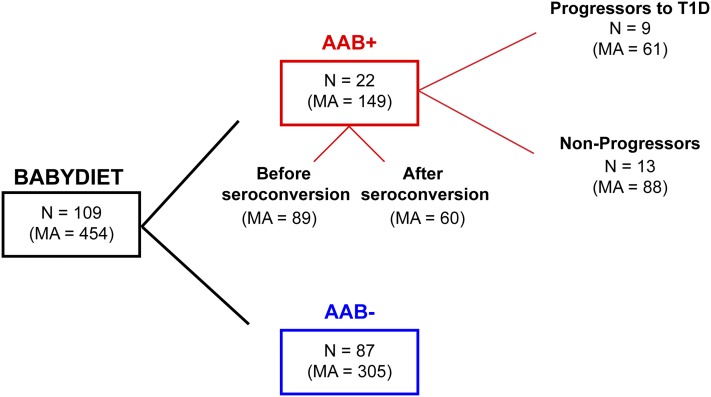
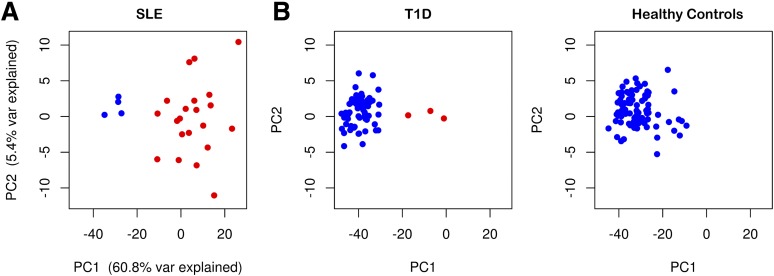
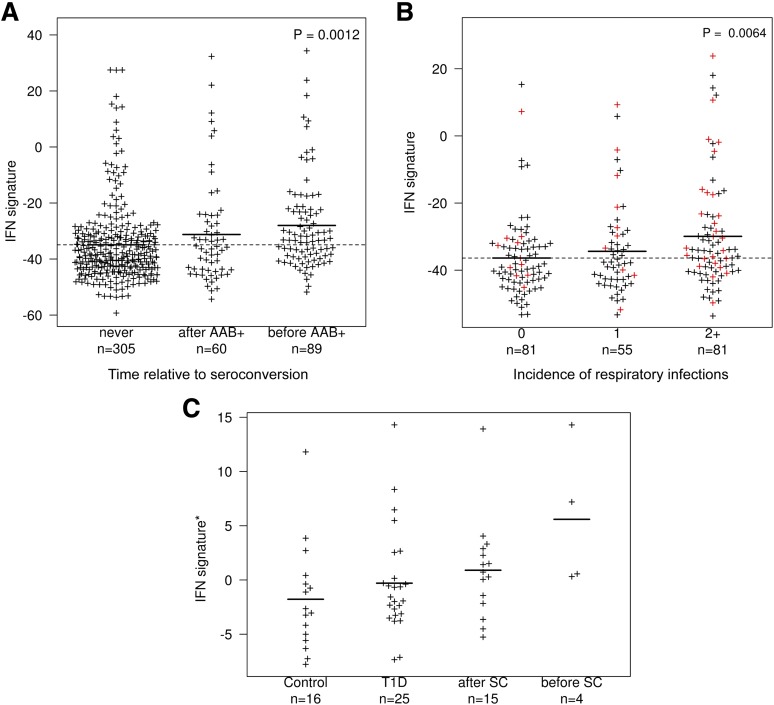
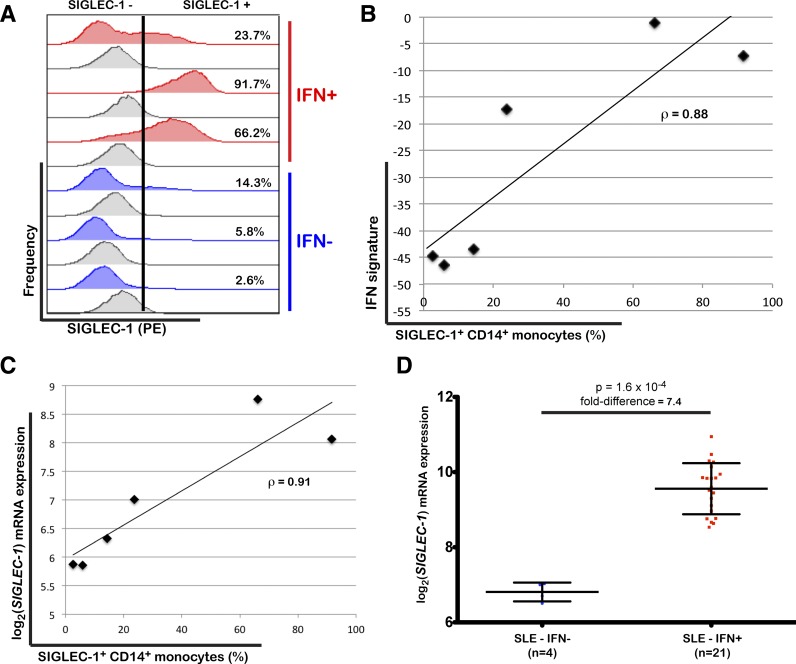
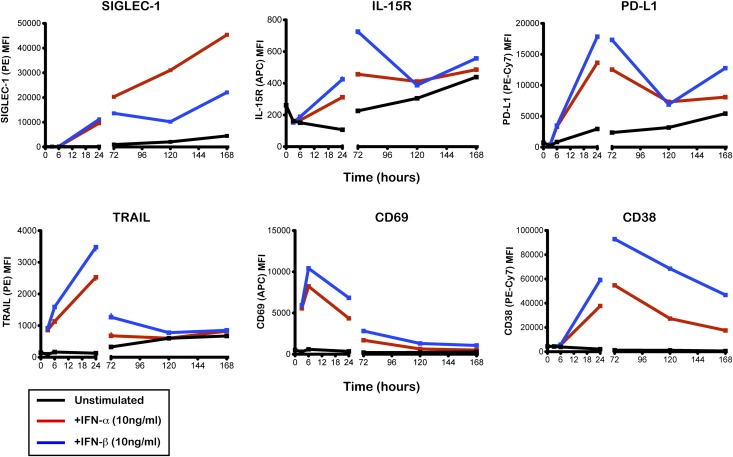
Diagnosis of the autoimmune disease type 1 diabetes (T1D) is preceded by the appearance of circulating autoantibodies to pancreatic islets. However, almost nothing is known about events leading to this islet autoimmunity. Previous epidemiological and genetic data have associated viral infections and antiviral type I interferon (IFN) immune response genes with T1D. Here, we first used DNA microarray analysis to identify IFN-β-inducible genes in vitro and then used this set of genes to define an IFN-inducible transcriptional signature in peripheral blood mononuclear cells from a group of active systemic lupus erythematosus patients (n = 25). Using this predefined set of 225 IFN signature genes, we investigated the expression of the signature in cohorts of healthy controls (n = 87), patients with T1D (n = 64), and a large longitudinal birth cohort of children genetically predisposed to T1D (n = 109; 454 microarrayed samples). Expression of the IFN signature was increased in genetically predisposed children before the development of autoantibodies (P = 0.0012) but not in patients with established T1D. Upregulation of IFN-inducible genes was transient, temporally associated with a recent history of upper respiratory tract infections (P = 0.0064), and marked by increased expression of SIGLEC-1 (CD169), a lectin-like receptor expressed on CD14(+) monocytes. DNA variation in IFN-inducible genes altered T1D risk (P = 0.007), as exemplified by IFIH1, one of the genes in our IFN signature for which increased expression is a known risk factor for disease. These findings identify transient increased expression of type I IFN genes in preclinical diabetes as a risk factor for autoimmunity in children with a genetic predisposition to T1D.


Figures

Figure 1
Figure 1
Workflow of the study’s experimental design. The diagram depicts the different stages of the study and the main outcomes of each stage.
Figure 2
Figure 2
Summary diagram of the BABYDIET cohort. The diagram represents the division of the 109 BABYDIET children and microarray samples according to seroconversion and progression to T1D. AAB, T1D-specific autoantibodies (see Research Design and Methods for details); MA, number of microarray measurements; N, number of individuals.
Figure 3
Figure 3
An IFN signature can be detected in peripheral blood of patients with SLE and T1D. A: Plot depicting the two first PCs obtained from the expression of the 1,111 IFN-inducible probe sets defined in patients with SLE (n = 25) in this study. The percentage of variance explained by each PC is shown on the respective axis. B: Plots depicting the first two PCs obtained from the projection of the expression of the IFN-inducible probe sets in subjects from cross-sectional cohorts of patients with T1D (n = 64; left panel) and adult healthy controls (n = 87; right panel) onto the PC axes defined in the analysis of the patients with SLE (see Research Design and Methods for details). The cross-sectional cohorts of patients with T1D include 15 adult patients with long-standing T1D (median 13 years since diagnosis; median age 31 years) enrolled from the Cambridge BioResource and 49 recently diagnosed patients (median 1.4 years since diagnosis; median age 12 years) recruited from the Diabetes-Genes, Autoimmunity and Prevention study. Samples that show clear evidence of upregulation of IFN-inducible genes by hierarchical clustering are depicted in red.
Figure 4
Figure 4
Expression of the IFN signature is increased before seroconversion and correlates with a recent history of respiratory infections. A: A quantitative summary IFN signature score (IFN signature; depicted in the y-axis) was obtained by the individual’s projection of the 225 identified IFN-inducible genes onto the first PC defined in the SLE group. The IFN signature is shown for all 454 samples from 109 children in BABYDIET who were analyzed for gene expression using microarrays, stratified according to time to seroconversion, including 305 microarray measurements from 87 donors who did not seroconvert (“never”), 89 microarray measurements from 22 T1D-specific autoantibody–positive (AAB+) donors taken before seroconversion (“before AAB+”), and 60 microarray measurements from the same 22 AAB+ donors taken after seroconversion (“after AAB+”). The number of microarray measurements taken before and after seroconversion from each of the 22 AAB+ donors is depicted in Supplementary Fig. 5. The P value represents a two-sided two degrees of freedom test comparing the average IFN signature of the three groups. B: IFN signature score of all 219 samples from the 109 children in BABYDIET are shown, stratified according to number (0, 1, or 2+) of self-recorded episodes of respiratory infections in the 3-month period nearest to, and within 1.5 months of, the date of collection of the blood sample used for microarray analysis. The P value represents a two-sided one degree of freedom test treating incidence as a quantitative variable and comparing the average IFN signature of the three groups using a linear mixed model. Samples from AAB+ children collected before seroconversion (red) were enriched for 2+ respiratory infections (P = 0.0128, χ2 test). C: Expression of the IFN signature was measured in an independent longitudinal cohort comprising two AAB+ Finnish children (19 samples) compared with three patients with T1D (25 samples) and three matched control children (16 samples). Samples from the AAB+ children were further stratified according to whether they were before (n = 4) or after (n = 15) seroconversion (SC). Data were downloaded from E-TABM-666. *Expression of the IFN signature was obtained from independent principle component analysis from 54 genes present in E-TABM-666 that overlapped with the 56 most discriminatory IFN-inducible genes in the SLE cohort (listed in Supplementary Table 1). n, number of samples with microarray measurements in each group.
Figure 5
Figure 5
SIGLEC-1 expression by CD14+ monocytes is a marker of increased IFN responses. A: Frequency of SIGLEC-1+ CD14+ monocytes was measured by flow cytometry in cryopreserved PBMCs from three patients with T1D with increased expression of IFN-inducible genes (IFN+) and three age- and sex-matched patients with T1D with low expression of IFN-inducible genes (IFN-). Histograms for the isotype control immunostainings are depicted in gray immediately below the respective volunteer. Positivity for SIGLEC-1 is defined on the basis of the upper one percentile of the respective isotype control (illustrated by the vertical black bar in one representative example). The percentage of SIGLEC-1+ CD14+ monocytes is indicated for each volunteer. B: Correlation between the frequency of SIGLEC-1+ CD14+ monocytes and the expression of the IFN signature in peripheral blood of the same six patients with T1D as measured by the projection of the expression of the IFN-inducible genes from each sample onto the first PC defined in the SLE group. C: Correlation between the frequency of SIGLEC-1+ CD14+ monocytes measured by flow cytometry and the normalized SIGLEC-1 mRNA expression in PBMCs from the six assessed patients with T1D as measured by DNA microarray. D: Scatter plot (mean ± SD) depicting the normalized SIGLEC-1 mRNA expression in PBMCs isolated from 25 patients with SLE stratified by the presence of an IFN signature (IFN+; red squares) or the absence of an IFN signature (IFN-; blue circles). The P value was calculated using a two-sided Wilcoxon test. ρ, correlation coefficient.
Figure 6
Figure 6
Time-course of the expression of six IFN-inducible proteins on the surface of CD14+ monocytes. Surface expression of the IFN-inducible proteins SIGLEC-1, IL-15R, PD-L1, TRAIL, CD69, and CD38 was measured by flow cytometry on CD14+ monocytes. PBMCs isolated from a healthy donor were cultured with IFN-α (10 ng/mL; red line), IFN-β (10 ng/mL; blue line), or culture medium (unstimulated; black line). Protein expression was quantified on CD14+ monocytes at 3, 6, 24, 72, 120, and 168 h after stimulation. MFI, median fluorescence intensity.

Comment in

  • Is type 1 diabetes "going viral"?
    Richardson SJ, Horwitz MS. Richardson SJ, et al. Diabetes. 2014 Jul;63(7):2203-5. doi: 10.2337/db14-0510. Diabetes. 2014. PMID: 24962917 No abstract available.

References

    1. Virgin HW, Todd JA. Metagenomics and personalized medicine. Cell 2011;147:44–56 - PMC - PubMed
    1. Ziegler AG, Rewers M, Simell O, et al. Seroconversion to multiple islet autoantibodies and risk of progression to diabetes in children. JAMA 2013;309:2473–2479 - PMC - PubMed
    1. Barrett JC, Clayton DG, Concannon P, et al. Type 1 Diabetes Genetics Consortium Genome-wide association study and meta-analysis find that over 40 loci affect risk of type 1 diabetes. Nat Genet 2009;41:703–707 - PMC - PubMed
    1. Dotta F, Galleri L, Sebastiani G, Vendrame F. Virus infections: lessons from pancreas histology. Curr Diab Rep 2010;10:357–361 - PubMed
    1. Beyerlein A, Wehweck F, Ziegler AG, Pflueger M. Respiratory infections in early life and the development of islet autoimmunity in children at increased type 1 diabetes risk: evidence from the BABYDIET study. JAMA Pediatr 2013;167:800–807 - PubMed

Publication types

Substances