

Behavioral and neural effects of intra-striatal infusion of anti-streptococcal antibodies in rats
- PMID: 24561489
- PMCID: PMC4000697
- DOI: 10.1016/j.bbi.2014.02.009
Behavioral and neural effects of intra-striatal infusion of anti-streptococcal antibodies in rats
Abstract
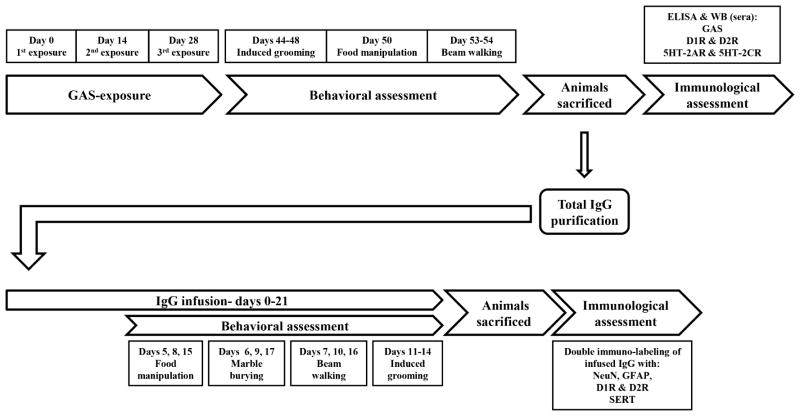
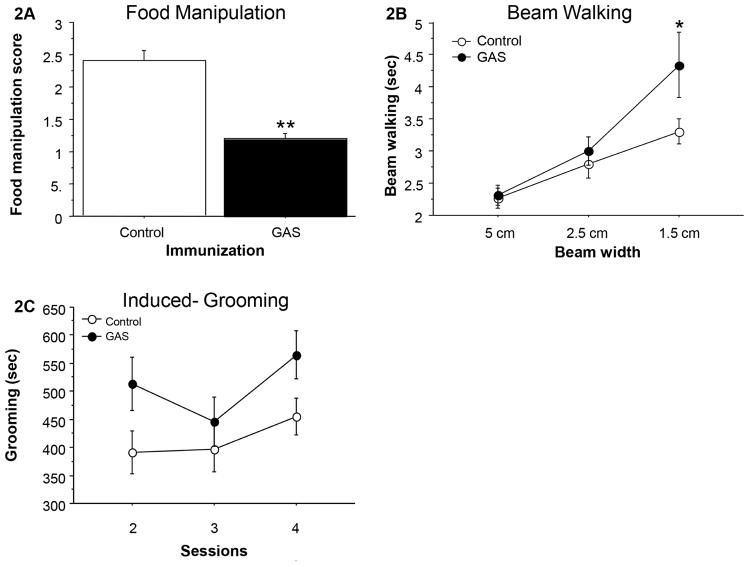
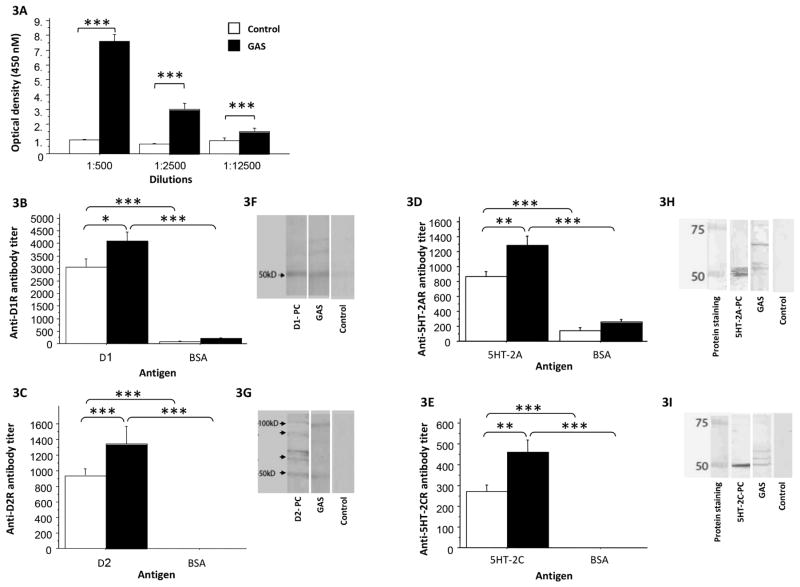
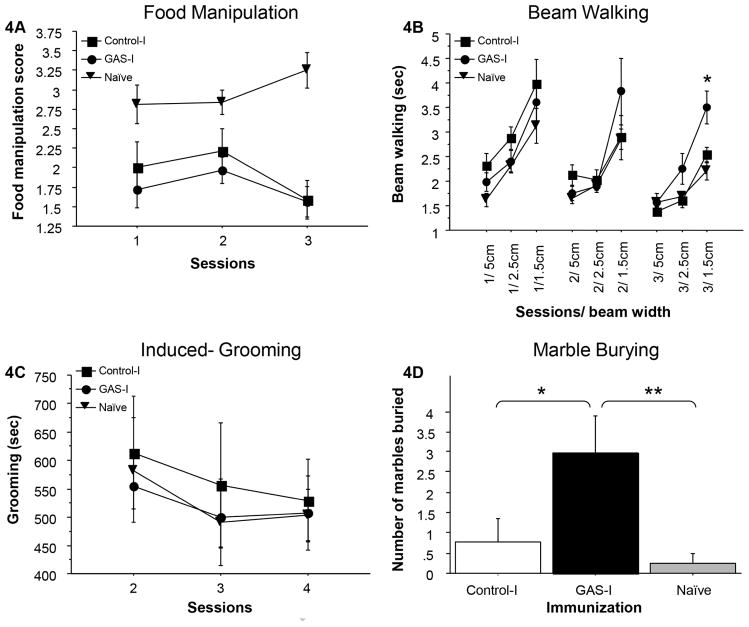
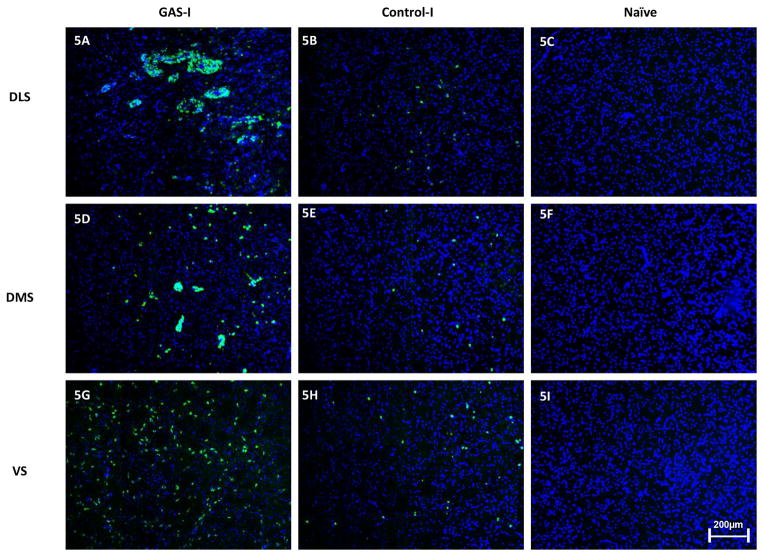
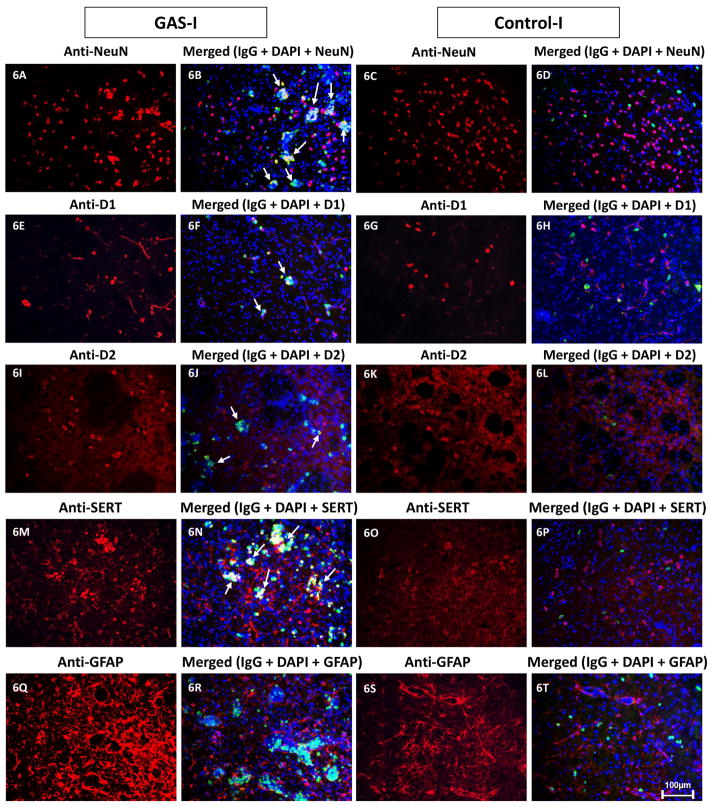
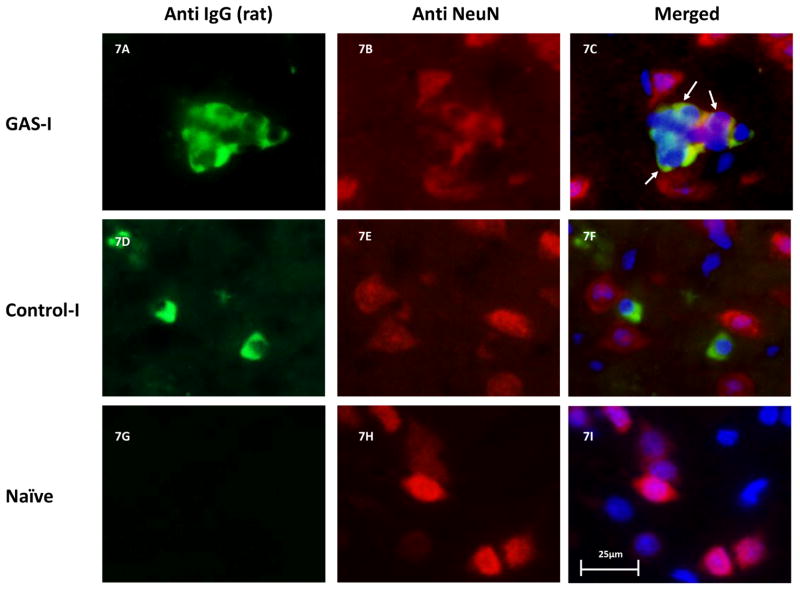
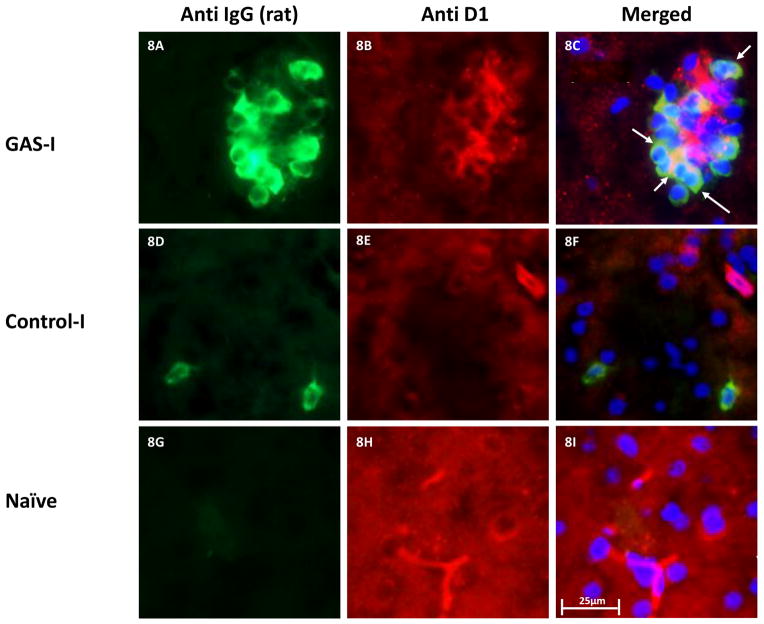
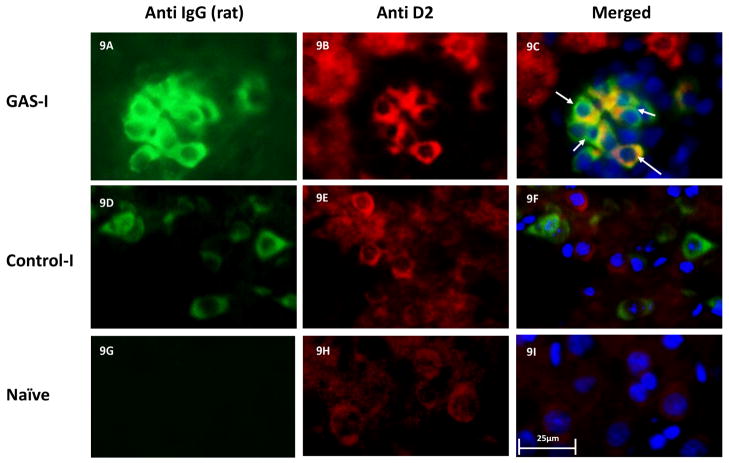
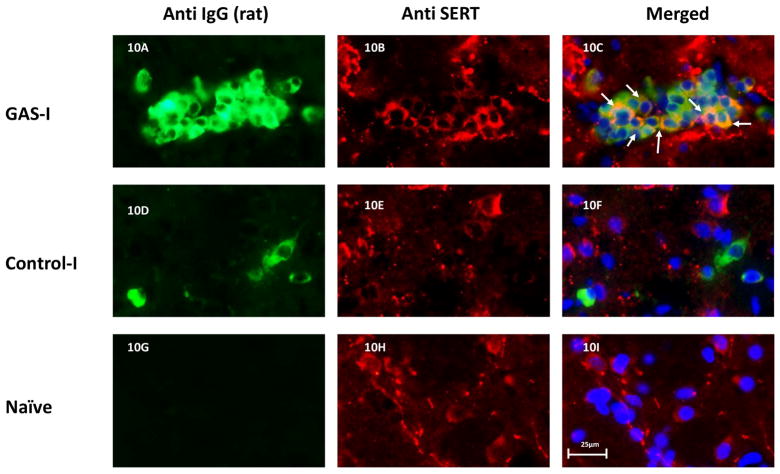
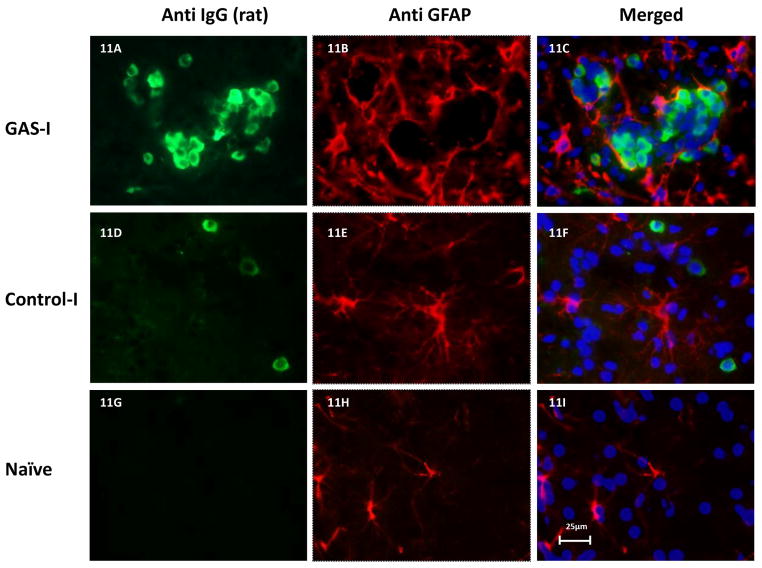
Group A β-hemolytic streptococcal (GAS) infection is associated with a spectrum of neuropsychiatric disorders. The leading hypothesis regarding this association proposes that a GAS infection induces the production of auto-antibodies, which cross-react with neuronal determinants in the brain through the process of molecular mimicry. We have recently shown that exposure of rats to GAS antigen leads to the production of anti-neuronal antibodies concomitant with the development of behavioral alterations. The present study tested the causal role of the antibodies by assessing the behavior of naïve rats following passive transfer of purified antibodies from GAS-exposed rats. Immunoglobulin G (IgG) purified from the sera of GAS-exposed rats was infused directly into the striatum of naïve rats over a 21-day period. Their behavior in the induced-grooming, marble burying, food manipulation and beam walking assays was compared to that of naïve rats infused with IgG purified from adjuvant-exposed rats as well as of naïve rats. The pattern of in vivo antibody deposition in rat brain was evaluated using immunofluorescence and colocalization. Infusion of IgG from GAS-exposed rats to naïve rats led to behavioral and motor alterations partially mimicking those seen in GAS-exposed rats. IgG from GAS-exposed rats reacted with D1 and D2 dopamine receptors and 5HT-2A and 5HT-2C serotonin receptors in vitro. In vivo, IgG deposits in the striatum of infused rats colocalized with specific brain proteins such as dopamine receptors, the serotonin transporter and other neuronal proteins. Our results demonstrate the potential pathogenic role of autoantibodies produced following exposure to GAS in the induction of behavioral and motor alterations, and support a causal role for autoantibodies in GAS-related neuropsychiatric disorders.
Keywords: Animal model; Dopamine; Pediatric autoimmune neuropsychiatric disorders associated with streptococcus (PANDAS); Serotonin; Streptococcus group A (GAS); Sydenham’s chorea (SC).
Copyright © 2014 Elsevier Inc. All rights reserved.
Figures
Similar articles
-
Behavioral, pharmacological, and immunological abnormalities after streptococcal exposure: a novel rat model of Sydenham chorea and related neuropsychiatric disorders.Neuropsychopharmacology. 2012 Aug;37(9):2076-87. doi: 10.1038/npp.2012.56. Epub 2012 Apr 25. Neuropsychopharmacology. 2012. PMID: 22534626 Free PMC article.
-
Antibiotic treatment attenuates behavioral and neurochemical changes induced by exposure of rats to group a streptococcal antigen.PLoS One. 2014 Jun 30;9(6):e101257. doi: 10.1371/journal.pone.0101257. eCollection 2014. PLoS One. 2014. PMID: 24979049 Free PMC article.
-
Passive transfer of streptococcus-induced antibodies reproduces behavioral disturbances in a mouse model of pediatric autoimmune neuropsychiatric disorders associated with streptococcal infection.Mol Psychiatry. 2010 Jul;15(7):712-26. doi: 10.1038/mp.2009.77. Epub 2009 Aug 11. Mol Psychiatry. 2010. PMID: 19668249
-
Rheumatic fever, autoimmunity, and molecular mimicry: the streptococcal connection.Int Rev Immunol. 2014 Jul-Aug;33(4):314-29. doi: 10.3109/08830185.2014.917411. Epub 2014 Jun 3. Int Rev Immunol. 2014. PMID: 24892819 Free PMC article. Review.
-
Streptococcal mimicry and antibody-mediated cell signaling in the pathogenesis of Sydenham's chorea.Autoimmunity. 2006 Feb;39(1):21-9. doi: 10.1080/08916930500484757. Autoimmunity. 2006. PMID: 16455579 Review.
Cited by
-
Autoantibodies in Neuropsychiatric Disorders.Antibodies (Basel). 2016 Apr 21;5(2):9. doi: 10.3390/antib5020009. Antibodies (Basel). 2016. PMID: 31557990 Free PMC article. Review.
-
Alterations in the Nervous System and Gut Microbiota after β-Hemolytic Streptococcus Group A Infection-Characteristics and Diagnostic Criteria of PANDAS Recognition.Int J Mol Sci. 2020 Feb 21;21(4):1476. doi: 10.3390/ijms21041476. Int J Mol Sci. 2020. PMID: 32098238 Free PMC article. Review.
-
Pediatric autoimmune neuropsychiatric disorders associated with streptococcal infections (Review).Exp Ther Med. 2021 Jan;21(1):94. doi: 10.3892/etm.2020.9526. Epub 2020 Nov 26. Exp Ther Med. 2021. PMID: 33363605 Free PMC article. Review.
-
What Does Immunology Have to Do With Normal Brain Development and the Pathophysiology Underlying Tourette Syndrome and Related Neuropsychiatric Disorders?Front Neurol. 2020 Sep 16;11:567407. doi: 10.3389/fneur.2020.567407. eCollection 2020. Front Neurol. 2020. PMID: 33041996 Free PMC article. Review.
-
Clinical Management of Pediatric Acute-Onset Neuropsychiatric Syndrome: Part II-Use of Immunomodulatory Therapies.J Child Adolesc Psychopharmacol. 2017 Sep;27(7):574-593. doi: 10.1089/cap.2016.0148. Epub 2017 Jul 19. J Child Adolesc Psychopharmacol. 2017. PMID: 36358107 Free PMC article.
References
-
- Albelda N, Joel D. Current animal models of obsessive compulsive disorder: an update. Neuroscience. 2012;211:83–106. - PubMed
-
- Archelos JJ, Hartung HP. Pathogenetic role of autoantibodies in neurological diseases. Trends Neurosci. 2000;23:317–327. - PubMed
-
- Ayalon L, Doron R, Weiner I, Joel D. Amelioration of behavioral deficits in a rat model of Huntington’s disease by an excitotoxic lesion to the globus pallidus. Exp Neurol. 2004;186:46–58. - PubMed
-
- Baragli A, Alturaihi H, Watt HL, Abdallah A, Kumar U. Heterooligomerization of human dopamine receptor 2 and somatostatin receptor 2 - Co-immunoprecipitation and fluorescence resonance energy transfer analysis. Cellular Signalling. 2007;19:2304–2316. - PubMed
-
- Barsottini OG, Ferraz HB, Seviliano MM, Barbieri A. Brain SPECT imaging in Sydenham’s chorea. Braz J Med Biol Res. 2002;35:431–436. - PubMed
Publication types
MeSH terms
Substances
Grants and funding
LinkOut - more resources
Full Text Sources
Other Literature Sources
