. 2014 Mar;16(3):224-33.
doi: 10.1038/ncb2915. Epub 2014 Feb 23.

Mechanical control of the sense of touch by β-spectrin

Affiliations

Mechanical control of the sense of touch by β-spectrin

Michael Krieg et al. Nat Cell Biol. 2014 Mar.

Abstract

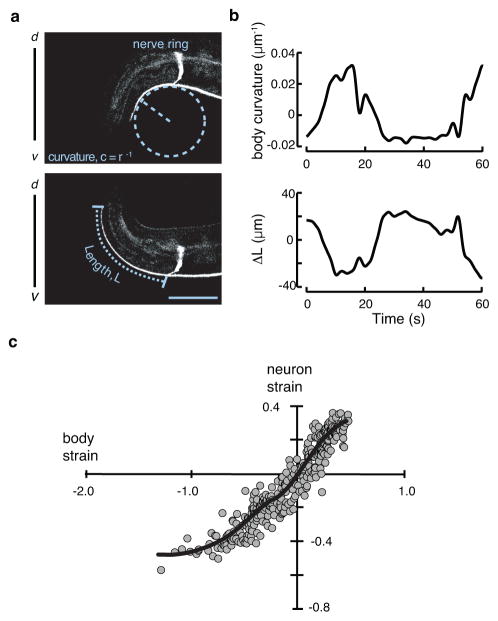
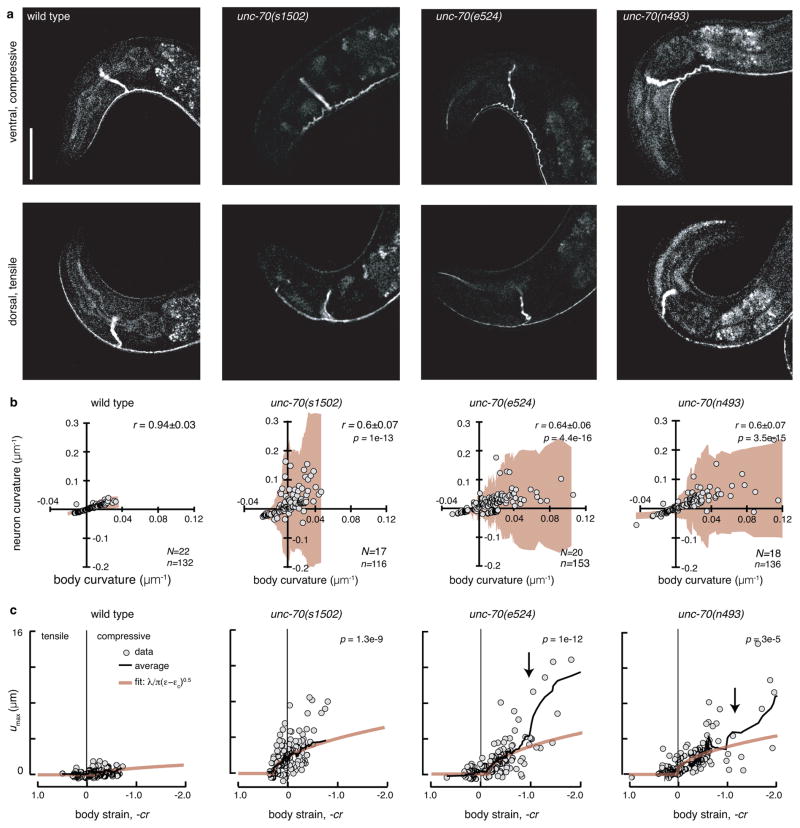
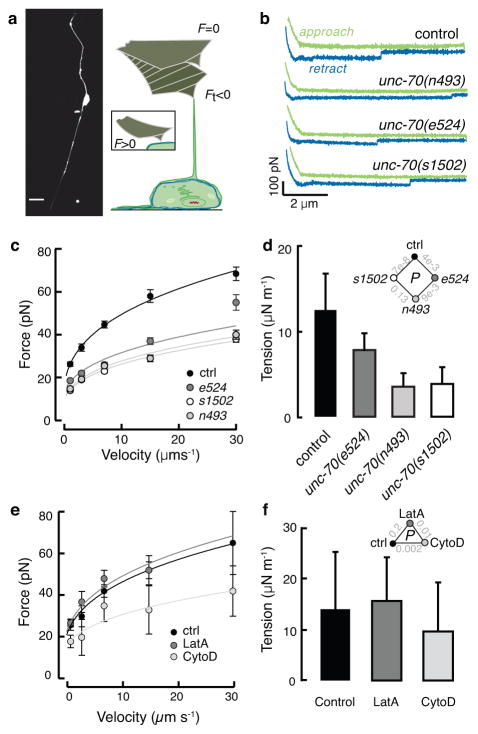
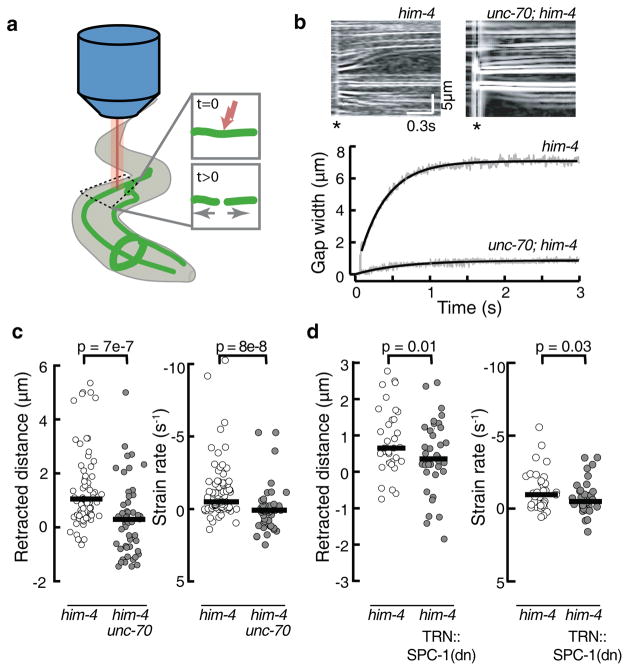
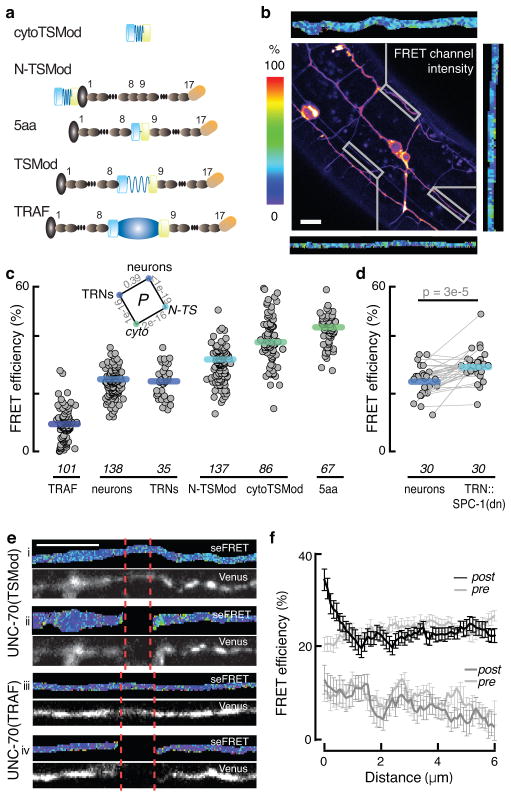
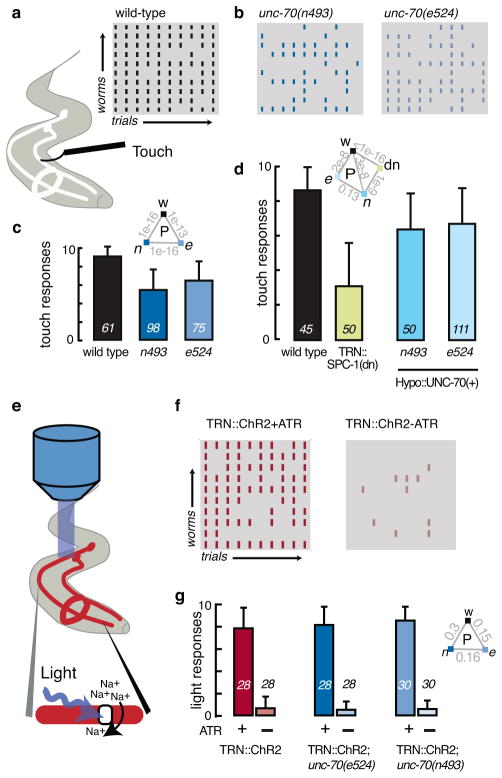
The ability to sense and respond to mechanical stimuli emanates from sensory neurons and is shared by most, if not all, animals. Exactly how such neurons receive and distribute mechanical signals during touch sensation remains mysterious. Here, we show that sensation of mechanical forces depends on a continuous, pre-stressed spectrin cytoskeleton inside neurons. Mutations in the tetramerization domain of Caenorhabditis elegans β-spectrin (UNC-70), an actin-membrane crosslinker, cause defects in sensory neuron morphology under compressive stress in moving animals. Through atomic force spectroscopy experiments on isolated neurons, in vivo laser axotomy and fluorescence resonance energy transfer imaging to measure force across single cells and molecules, we show that spectrin is held under constitutive tension in living animals, which contributes to elevated pre-stress in touch receptor neurons. Genetic manipulations that decrease such spectrin-dependent tension also selectively impair touch sensation, suggesting that such pre-tension is essential for efficient responses to external mechanical stimuli.


Conflict of interest statement

Competing financial interests

The authors declare no competing financial interests.

Figures

Figure 1
Figure 1. The shape of the touch receptor neuron AVM as a function of stress evoked by body movement
a, Representative micrographs of a GFP-labeled AVM neuron in an adult worm bending ventrally (top) or dorsally (bottom). Curvature and neuron length are schematically indicated as dashed lines. Scale bar = 50 μm. b, Body curvature (top) and the change in neuron length (bottom) vs. time. Epochs of ventral bending correspond to positive curvature and AVM shortening, while epochs of dorsal bending correspond to negative curvature and AVM extension. c, Estimated neuron strain, ΔL/L as a function of body strain. Body strain was derived by approximation of the worm as an Euler-Bernoulli tube, as described in Supplementary Note 1. The black line is a smoothed version of the neuron strain-body strain relationship. Data drawn from n=7 control, TRN::GFP transgenic worms and 352 still images collected during four independent imaging sessions.
Figure 2
Figure 2. Loss of unc-70 β-spectrin function causes buckling in TRNs during ventral bending
a, AVM shape during ventral (top) and dorsal (bottom) bending in wild-type and unc-70 mutant TRN::GFP animals. Scale bar is 50 μm. b, Neuron curvature vs. body curvature. Each point is the mean of 10–30 adjacent curvature measurements in a still image (see Methods). Shaded areas (beige) indicate the standard deviation of neuron curvature; the increased deviation during compressive (positive, ventral) body bends indicates a larger variation in local neuron curvature. r is the correlation coefficient between neuron and body curvature and r values in unc-70 mutants were significantly different than wild-type (Fisher z-transform of r). p values indicated in the upper right. N=Number of animals and n=number of still images. Result is from three independent imaging sessions. c, Maximum off-axis deformation (buckling), umax, of AVM as a function of body strain. Each point is the maximum deformation within a still image. Black lines are running averages of 15 images; beige lines are the calculated buckling deformation of a constrained, flexible filament bundle as a function of compressive strain ε (see Supplementary Note 1). p values derived from linear regression and compared to wild-type indicated in the upper left. Same numbers of observations as in b. All strains carry the uIs31 transgene encoding TRN::GFP.
Figure 3
Figure 3. Loss of β spectrin function decreases TRN tension
a, Micrograph of a GFP-tagged TRN in vitro (left) and schematic of the tether extrusion procedure. A peanut lectin-coated AFM cantilever was held in contact with each cell for about 400 ms and a lipid tube formed following retraction in about 20% of cases; such events result in a downward deflection of the cantilever (Ft < 0). b, Representative force-distance curves (approach in green, withdrawal in blue) acquired at 7 μm·s−1. The discontinuity during withdrawal indicates an interaction event and is proportional to the membrane tension. Similar results were observed in more than 17 cells/genotype. c, Tether force (mean±SEM) vs. cantilever retraction velocity in control and mutant TRNs. Force-velocity curves were fit to a power law and used to estimate the static tether force at zero velocity (see Methods). Supplementary Table 3 lists the number of cells and tethers for each condition. Data in b and c were acquired during n=6 independent AFM sessions. d, The apparent membrane tension, Tapp, of cultured TRNs, derived from the static tether force, fo, estimated from the fits to the data in c according to: Tapp = fo2/8ππ2κ and a value for the membrane bending rigidity, κ of 2.7·10−19 N·m (Ref. 29). Diamond inset shows p values for the tested combinations. e, Tether force (mean±SEM) vs. cantilever retraction velocity in the presence and absence of drugs that disrupt actin. LatrunculinA (LatA) and cytochalasin D (cytoD) applied at 1 and 2 μM, respectively. More than 25 tethers were tested for each speed, except for 30μm/s since no data were obtained from LatA-treated cells under this condition. Supplementary Table 3 lists the number of cells and tethers for each condition. Treated and untreated cells were tested in parallel during n=3 independent AFM sessions. f, Membrane tension is unaffected by actin depolymerizing drugs. Triangle inset shows p values as a function of treatment. P-values derived after log-log transformation of the force-velocity data and linear regression followed by a Tukey-type t-test. All strains carry the uIs31 transgene encoding TRN::GFP, which was used to identify TRNs in cultures.
Figure 4
Figure 4. unc-70(e524) touch receptor neurons fail to retract after laser axotomy
a, Schematic of the laser cutting experiment. One Ti::Sapphire laser was used to cut TRN axons in immobilized worms, while a second, identical laser was used to simultaneously image the neuron at 1 kHz scan rate. b, Representative kymographs of control him-4(e1267) (top, left) and mutant him-4(e1267); unc-70(e524) (top, right) TRNs before and after axotomy. For visualization, kymographs were processed with a Laplace edge detection algorithm to highlight fluorescent speckles. Retraction is evident from the outward motion of fluorescence speckles, which act as fiducial intensity markers. Time runs from left to right. Asterisk indicates time of ablation. c, Retracted distance, D0/2 (left) and strain rate (right) of control and unc-70(e524) mutant TRNs in a him-4 mutant background after laser cutting. Each point is a single axotomy and thick horizontal bars are the median of 69 and 54 axotomies in 19 control and 22 mutant animals, respectively. Data collected during n=7 axotomy sessions. Median values were significantly different (U-test); p values indicated above. Displacement of the two ends was measured from half of the gap width and fit to: D(t) = D0(1 − exp(τ·t))+Da, where D(t)=gap width as a function of time, D0= final gap width, Da=initial width of the gap immediately after ablation and t=the retraction rate. Fit parameters were used to estimate strain rate: γ-D02·τDa.d, Retracted distance, D0/2 (left) and strain rate (right) of control and TRN::SPC-1(dn) TRNs in a him-4 mutant background after laser cutting. Each point is a single axotomy and thick horizontal bars are the median of 37 and 38 cuts in 16 control and 13 TRN::SPC-1(dn) transgenic animals, respectively. Data collected during n=4 axotomy sessions. Median values were significantly different (U-test); p values indicated above. All strains carry the uIs31 transgene encoding TRN::GFP, which was used to identify TRNs in cultures.
Figure 5
Figure 5. UNC-70 is under constitutive tension in neurons of living animals
a, TSMod-UNC-70 β-spectrin fusion proteins. Shown schematically in descending order of expected FRET efficiency (top to bottom): cytoTSMod, N-TSMod, 5aa, UNC-70(TSMod), and TRAF. Symbols are: mTFP, teal cylinder; spider silk linker, blue spring; Venus, yellow cylinder; UNC-70 actin binding domain, gray oval; spectrin repeats, charcoal oval; TRAF domain, dark blue oval. b, Representative confocal image of the uncorrected FRET channel after mTFP donor excitation and recording the Venus acceptor emission. Scale bar: 10 μm. Flanking the image are images of FRET efficiency for three ROIs. c, FRET efficiency of the TSMod fusion proteins illustrated in a. TRNs were identified based on their distinctive morphology and position. CytoTSMod and N-TSMod are no-force controls, while UNC-70(TRAF) and UNC-70(5aa) are low and high FRET controls. Each point corresponds to the mean FRET efficiency of a single ROI; thick bars are the median values across ROIs; data collected during eight imaging sessions. Distributions were normal (Jarque-Bera test) and inset shows p-values derived from t-tests for the indicated combinations. The sample size required to estimate the minimal difference between UNC-70(TSMod) and the no-force controls is 15 at the level of α=0.01. The minimum detectable difference for the presented data is δ=1.7%. d, FRET efficiency in TRNs and nearby neurons in TRN::SPC-1(dn) transgenics. Lines connect neuron pairs measured in the same animal. p value (paired U-test) is shown above. e, Laser axotomy increases UNC-70(TSMod) FRET adjacent to the cut site. Panels i-iv show representative micrographs of TRNs before (i, iii) and after (ii, iv) axotomy in animals expressing UNC-70(TSMod) (i, ii) or UNC-70(TRAF) (iii, iv). Each pair of micrographs shows the FRET efficiency (top) and acceptor fluorescence (bottom). The color scale is the same as in b and c. f, FRET efficiency as a function of distance from the cut site. Points are the mean (±SEM) of 23 and 17 axotomies for each UNC-70(TSMod) and UNC-70(TRAF), respectively. Neurites were imaged at the same position prior to axotomy (gray traces, pre). As expected for an axotomy-induced tension release, FRET was highest near the cut site and declined to control values within 2μm. Data collected during n=3 imaging sessions.
Figure 6
Figure 6. Loss of unc-70 function impairs touch sensitivity, but not synthetic light sensitivity
a–d, Touch response in wild-type and unc-70 mutants. a, Schematic of the assay used to measure touch sensitivity and ethogram of touch responses in wild-type (N2). Rows represent individual worms, columns are trials, and black tics indicate a stimulus-evoked reversal. (Gray tics indicate trials that failed to elicit a detectable response.) b, Ethogram of unc-70(n493) and unc-70(e524) mutant animals. c, Average touch response as a function of genotype. Bars are mean ± s.d., numbers on each bar shown the number of animals tested blind to genotype during four assay sessions; inset shows p values derived from a U-test. d, Average response rate in transgenic animals with TRN-specific defects in spectrin function (TRN::SPC-1(dn)) or hypodermis-specific expression of wild-type UNC-70. Bars are mean ± SD, numbers on each bar show the number of animals tested blind to genotype during n=2 or n=4 assay sessions for TRN::SPC-1(dn) and unc-70; HYPO::UNC-70(+) transgenics, respectively; inset shows p values derived from a U-test. e–g, Light-induced reversal in transgenic animals expressing ChR2 selectively in the TRNs (TRN::ChR2). e, Schematic of optogenetic stimulation. f, Ethogram of the response of TRN::ChR2 control animals to blue light in presence (left) and absence (right) of all-trans retinal, ATR. g, Average light response in control and unc-70 mutants grown in the presence (green, blue bars) or absence of ATR (gray bars) and stimulated with brief (1s) light pulses of 0.48 mW·mm−2. Bars are mean ± SD, number of animals tested during n=2 independent assay sessions is indicated near each bar; inset shows p values derived from a Mann-Whitney U-test.

Similar articles

Cited by

References

    1. O’Hagan R, Chalfie M, Goodman MB. The MEC-4 DEG/ENaC channel of Caenorhabditis elegans touch receptor neurons transduces mechanical signals. Nature Neuroscience. 2005;8:43–50. - PubMed
    1. Suzuki H, et al. in vivo imaging of C. elegans mechanosensory neurons demonstrates a specific role for the MEC-4 channel in the process of gentle touch sensation. Neuron. 2003;39:1005–1017. - PubMed
    1. Chalfie M, Thomson JN. Structural and functional diversity in the neuronal microtubules of Caenorhabditis elegans. The Journal of Cell Biology. 1982;93:15–23. - PMC - PubMed
    1. Cueva JG, Mulholland A, Goodman MB. Nanoscale organization of the MEC-4 DEG/ENaC sensory mechanotransduction channel in Caenorhabditis elegans touch receptor neurons. Journal of Neuroscience. 2007;27:14089–14098. - PMC - PubMed
    1. Grashoff C, et al. Measuring mechanical tension across vinculin reveals regulation of focal adhesion dynamics. Nature. 2010;466:263–266. - PMC - PubMed

Publication types