. 2014 Mar;16(3):234-44.
doi: 10.1038/ncb2919.

Role of the SIK2-p35-PJA2 complex in pancreatic β-cell functional compensation

Role of the SIK2-p35-PJA2 complex in pancreatic β-cell functional compensation

Jun-Ichi Sakamaki et al. Nat Cell Biol. 2014 Mar.

Erratum in

  • Nat Cell Biol. 2014 Apr;16(4):382

Abstract

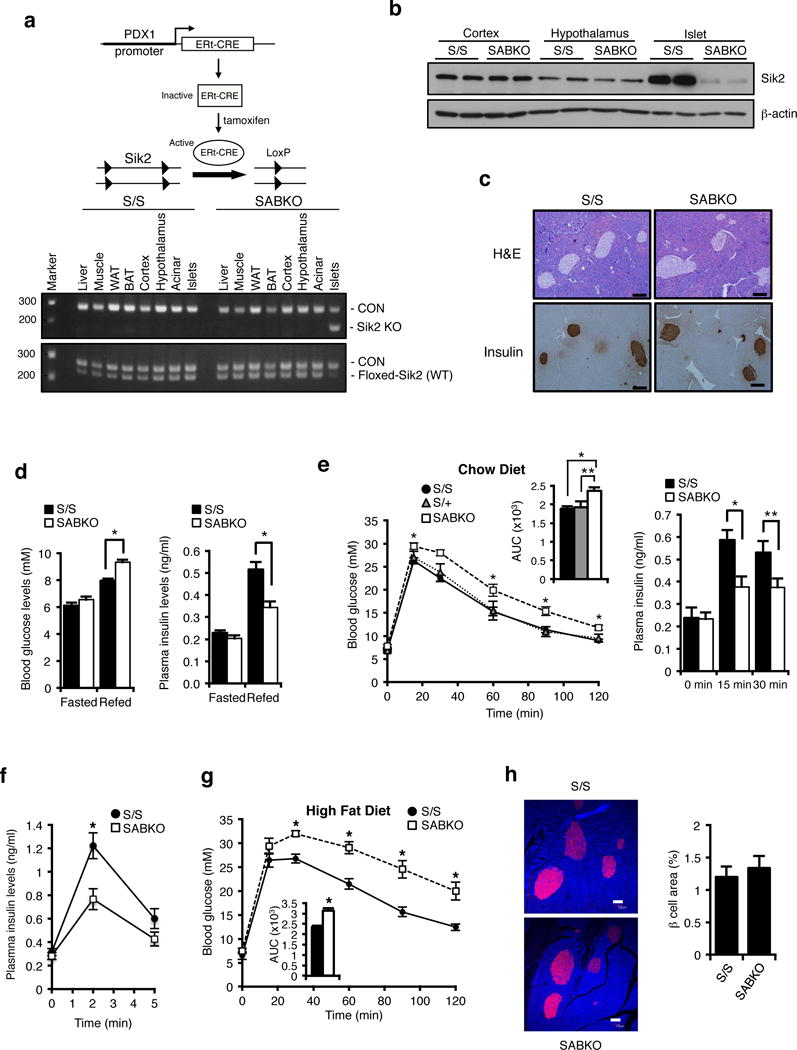
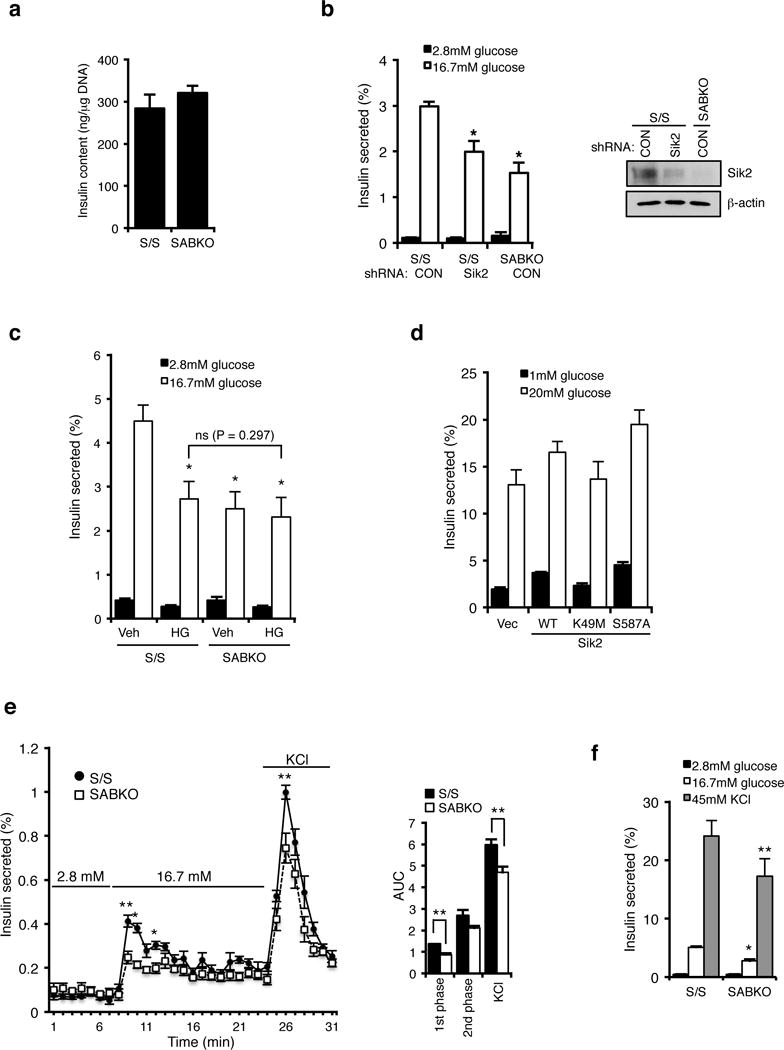
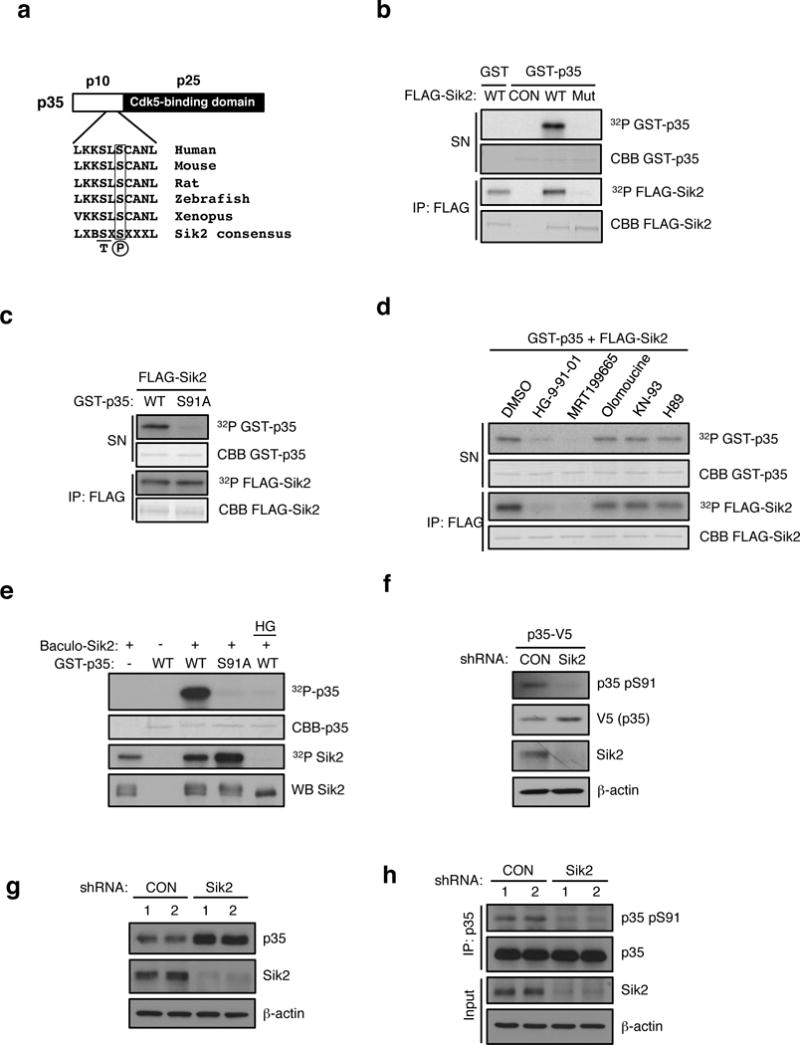
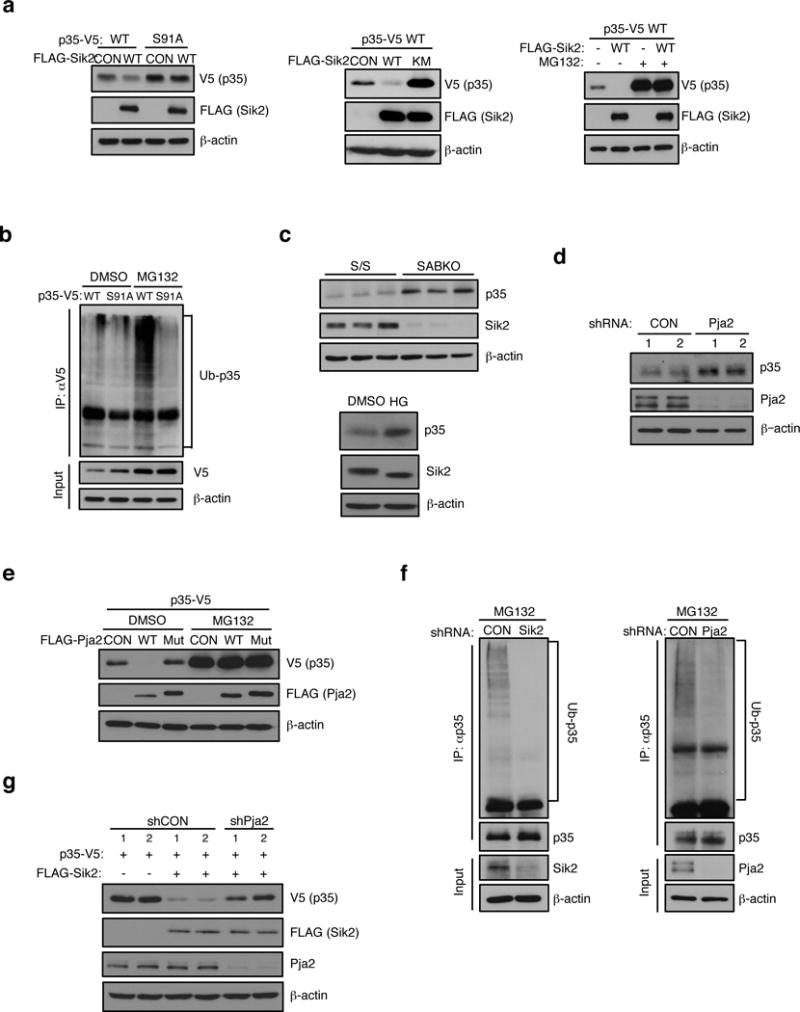
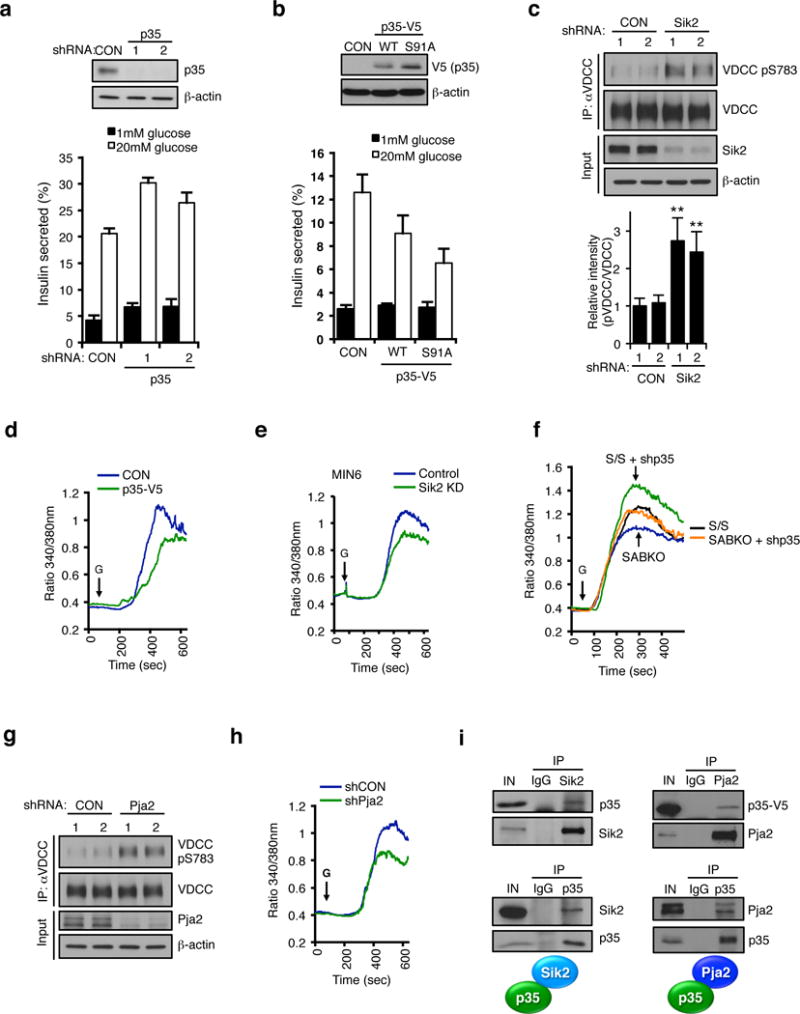
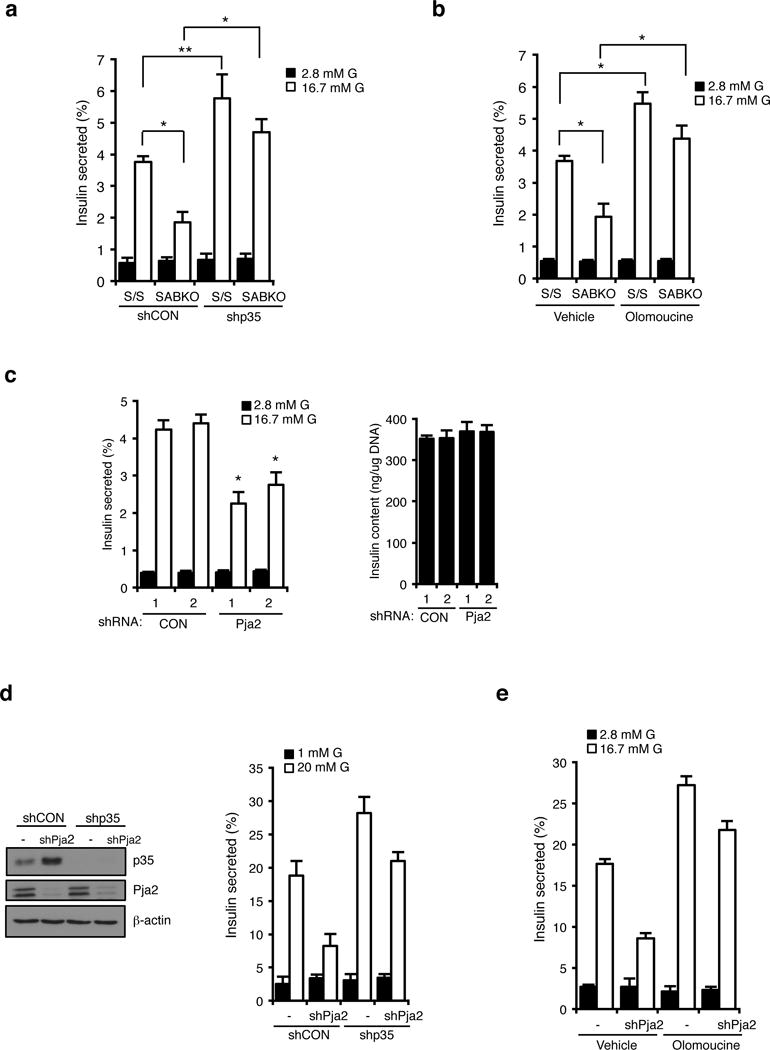
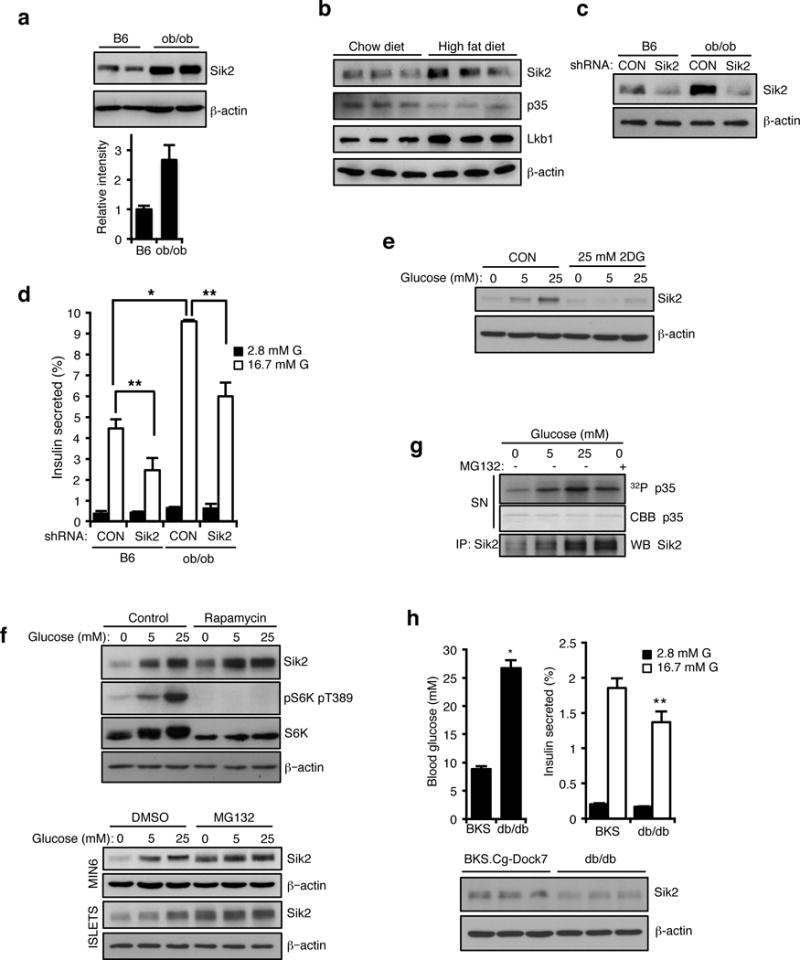
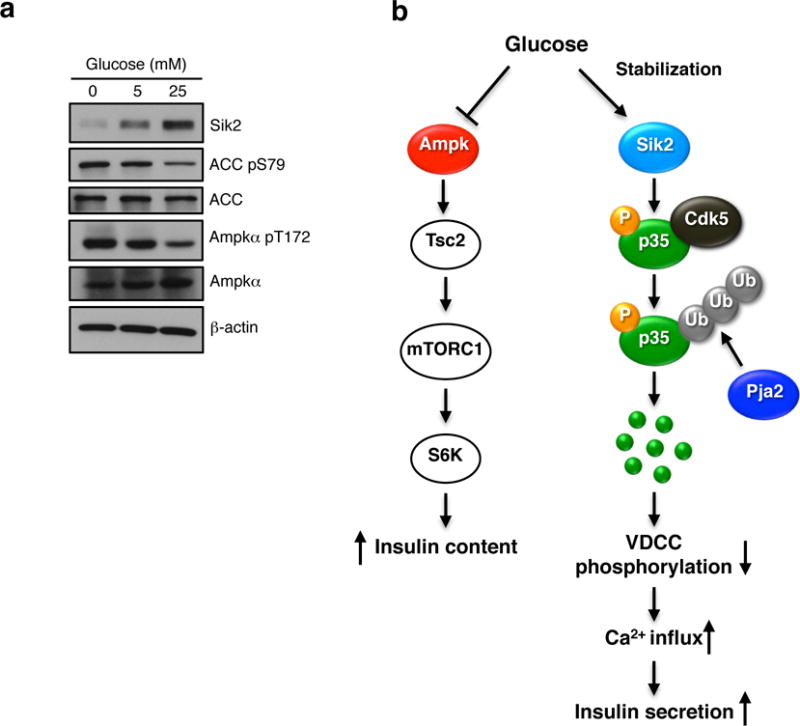
Energy sensing by the AMP-activated protein kinase (AMPK) is of fundamental importance in cell biology. In the pancreatic β-cell, AMPK is a central regulator of insulin secretion. The capacity of the β-cell to increase insulin output is a critical compensatory mechanism in prediabetes, yet its molecular underpinnings are unclear. Here we delineate a complex consisting of the AMPK-related kinase SIK2, the CDK5 activator CDK5R1 (also known as p35) and the E3 ligase PJA2 essential for β-cell functional compensation. Following glucose stimulation, SIK2 phosphorylates p35 at Ser 91, to trigger its ubiquitylation by PJA2 and promote insulin secretion. Furthermore, SIK2 accumulates in β-cells in models of metabolic syndrome to permit compensatory secretion; in contrast, β-cell knockout of SIK2 leads to accumulation of p35 and impaired secretion. This work demonstrates that the SIK2-p35-PJA2 complex is essential for glucose homeostasis and provides a link between p35-CDK5 and the AMPK family in excitable cells.


Figures

Figure 1
Figure 1. Deletion of Sik2 in adult beta cells leads to glucose intolerance due to impaired stimulus-dependent insulin secretion
(a) (Top) Adult Sik2loxP/loxP mice carrying the Pdx1-CreERt2 transgene were injected with tamoxifen to induce β cell specific deletion of Sik2. (Bottom) PCR analysis of genomic DNA from various tissues in S/S and SABKO mice. (b) Western blot analysis of SIK2 levels from extracts of cortex, hypothalamus, and islets in S/S and SABKO mice. (c). (Top) Pancreatic sections from control S/S and SABKO mice stained with H&E. Bar = 100 um. (Bottom) Immunostaining of pancreatic sections of control S/S and SABKO mice stained with insulin antibody. Bar = 100 um. (d) (Left) Blood glucose levels of fasted and 2 h refed control (S/S, n=31 mice) and SABKO (n=34 mice) animals were measured 1 week after tamoxifen treatment. (Right) Plasma insulin levels after 2 h of refeeding in control (S/S, n=20 mice) and SABKO (n=12 mice) animals. (e) (Left) Glucose tolerance test (2 mg glucose/g, IP injection) for tamoxifen-treated S/S (n=31), S/+ (n=6 mice), and SABKO (n=26 mice) mice. Blood glucose concentrations were determined at indicated times. Area under the curves (AUC) is shown at top right. (Right) Plasma insulin levels at 15 min and 30 min post glucose injection during GTT for control S/S (n=13 mice) and SABKO (n=13 mice) animals. (f) Plasma insulin levels at 2 min and 5 min after L-arginine injection (1 mg/g body weight) in S/S (n=12 mice) and SABKO (n=11 mice) animals. (g) Glucose tolerance test on control S/S (n=9 mice) and SABKO (n=8 mice) animals after 16 weeks on HFD. Area under the curve (AUC) is shown. (h) (Left) Immunostaining of pancreatic sections of control S/S and SABKO mice after 20 weeks on HFD. Sections were stained with insulin antibody (red) and CellMask Blue cytoplasmic/nuclear stain (blue). Bar = 100 um. (Right) Quantification of beta cell area in S/S (n=4 mice) and SABKO (n=4 mice) mice. All error bars represent s.e.m. Statistical significance for all data was determined using two-tailed unpaired Student’s t-test (* p < 0.01, ** p < 0.05). (a–c) Data are representative of two independent experiments. The statistics source data for (h) is provided in Supplementary Table 1.
Figure 2
Figure 2. SIK2 is required for glucose-stimulated insulin secretion at a step downstream of depolarization
(a) Insulin content (ng insulin/μg DNA) is unchanged in control S/S (n= 3 mice) and SABKO (n= 3 mice) islets. (b) (Left) Insulin secretion from S/S (n= 3 mice for each condition) and SABKO (n= 3 mice) islets infected with control or SIK2 shRNA. Islets were treated with low (2.8 mM) and high (16.7 mM) glucose for 1 hr. (Right) Western blot analysis of SIK2 levels in islets indicated in the left panel. Data is representative of three independent experiments. (c) Insulin secretion from S/S (n= 3 mice for each condition) and SABKO (n= 3 mice for each condition) islets pre-treated with DMSO or pan-Sik inhibitor HG-9-91-01 (0.5 μM) for 24 hr followed by incubation with low (2.8 mM, 1 hr) and high (16.7 mM, 1hr) glucose in the presence or absence of 0.5 μM HG-9-91-01. (d) Insulin secretion from MIN6 cells infected with SIK2 WT, kinase inactive (K49M), or constitutively active (S587A) mutant. Cells were treated with low (1 mM) and high (20 mM) glucose for 1 hr. Data are mean ± s.d. from n=3 technical replicates from a single experiment, and are representative of three independent experiments with consistent results. (e) Glucose stimulated insulin secretion assay by perifusion of 75 islets from control S/S (n=3 mice) and SABKO (n=3 mice) mice. (Left) Percentage of total islet insulin secretion in each fraction following treatment with indicated amount of glucose or KCl is shown. (Right) Histogram showing area under the curves for perifusion GSIS data is shown, separated into first phase (8–12 min) and second phase (12–24 min) high glucose (16.7 mM) and response to depolarization (45 mM KCl). (f) Insulin secretion from S/S (n=3 mice) and SABKO (n=3 mice) islets treated with low (2.8 mM) and high (16.7 mM) glucose, and 45 mM KCl for 1 hr. All error bars represent s.d. Statistical significance for all data was determined using two-tailed unpaired Student’s t-test (* p < 0.01, ** p < 0.05). The statistics source data for (a–c and f) are provided in Supplementary Table 1.
Figure 3
Figure 3. SIK2 phosphorylates CDK5R1/p35
(a) Schematic of p35 showing N-terminal p10 domain, C-terminal p25 CDK5 binding domain and the location of Ser 91. Conservation of consensus SIK2 phosphorylation site at Ser91 of p35 using standard single letter amino acid nomenclature is shown. B= basic residue, X = any amino acid. (b) In vitro kinase assay using FLAG-SIK2 wild type (WT) or K49M kinase dead mutant (Mut) showing incorporation of 32P into full-length GST-p35 in the reaction supernatant. Autophosphorylation and coomassie blue staining of immunoprecipitated FLAG-SIK2 protein remaining on beads is shown in bottom two panels. CON = Empty vector control. (c) In vitro kinase assay using immunoprecipitates of FLAG-SIK2 and GST-p35 WT and S91A mutant as substrates. 32P and coomassie blue (CBB) staining of GST-p35 substrates and immunoprecipitated FLAG-SIK2 are shown. (d) In vitro kinase assay was performed with FLAG-SIK2 and GST-p35 WT in the presence of DMSO, HG-9-91-01 (100 nM), MRT199665 (200 nM), Olomoucine (60 μM), KN-93 (10 μM), or H89(1 μM). 32P and coomassie blue (CBB) staining of GST-p35 substrates and immunoprecipitated FLAG-SIK2 are shown. (e) In vitro kinase assay was performed with GST-p35 (WT and S91A) and recombinant SIK2 purified from Sf9 cells infected with baculovirus in the presence or absence of HG-9-91-01 (100 nM). (f) Western blot analysis of pSer91 levels on p35-V5 in MIN6 cells infected with non-targeting control (CON) or SIK2 shRNA with anti-p35 pSer91 antibody. (g) Western blot analysis of endogenous p35 levels in SIK2 knockdown MIN6 cells. (h) Western blot anaylsis of pSer91 levels in IPs of endogenous p35 in control or SIK2 shRNA expressing MIN6 cells treated with MG132 (10 uM for 24h). All western blot data are representative of three independent experiments with consistent results.
Figure 4
Figure 4. PJA2 ubiquitinates CDK5R1/p35
(a) (Left) Western blot analysis of p35-V5 and S91A mutant levels in HEK293T cells expressing empty vector control or FLAG-SIK2 cDNA. (Middle) Western blot analysis showing levels of p35-V5 in extracts from HEK293T transfectant co-expressing empty vector control (CON), FLAG-SIK2 WT or K49M mutant (Mut). (Right) Western blot analysis of p35-V5 levels in extracts from HEK293T transfectants coexpressing empty vector (−) or FLAG-SIK2 WT. The effect of treatment with DMSO control (−) or MG132 proteasome inhibitor (10 μM for 24 h) is shown. (b) Western blot analysis of poly-ubiquitination levels on p35-V5 immunoprecipitated from HEK293T cells expressing p35-V5 WT or S91A mutant cDNA. Treatment with DMSO or MG132 (10 μM for 24 h) is indicated. (c). (Top) Western blot analysis of endogenous p35 levels in SABKO islets. (Bottom) Western blot analysis of p35 expression in mouse islets treated with DMSO or 0.5 μM HG-9-91-01 for 24 h. (d) Western blot analysis of endogenous p35 levels in mouse islets infected with PJA2 shRNA. (e) Western blot analysis of p35-V5 levels in extracts from MIN6 cells coexpressing empty vector (−) or FLAG-PJA2 WT or the ring-domain mutant (C633A/C670A, Mut). The effect of treatment with DMSO control (−) or MG132 (20 μM for 24 h) is shown. (f) (Left) Western blot analysis showing poly-Ub levels in p35 immunoprecipitates isolated from MIN6 cell extracts following infection with non-targeting control (CON) or SIK2 shRNA. Cells were treated with 20 μM MG132 for 24 h. (Right) Western blot analysis showing poly-Ub levels in p35 immunoprecipitates isolated from MIN6 cell extracts following infection with non-targeting control (CON) or PJA2 shRNA. Cells were treated with 20 μM MG132 for 24 h. (g) Western blot analysis of p35-V5 levels in extracts from HEK293T transfectants coexpressing FLAG-SIK2 WT together with or without shRNA targeting PJA2. All western blot data are representative of three independent experiments with consistent results.
Figure 5
Figure 5. The SIK2-p35-PJA2 complex is required for calcium mobilization in the beta cell
(a) (Top) Western blot of p35 levels in MIN6 cells infected with lentivirus expressing non-targeting control (CON) or p35 shRNA. (Bottom) GSIS assay in control or p35 knockdown MIN6 cells. (b) (Top) Western blot of p35-V5 levels in MIN6 cells infected with lentivirus expressing empty vector (CON), p35-V5 WT or S91A and (bottom) corresponding GSIS assay. Data in a and b are mean ± s.d. from n=3 technical replicates from a single experiment, and are representative of three independent experiments with consistent results. (c) (Top) Western blot showing pSer783 levels on VDCC immunoprecipitated from control or SIK2 knockdown MIN6 cells. (Bottom) Histogram showing relative intensity of VDCC phosphorylation levels normalized to total VDCC. Data is mean ± s.d. from n=3 independent experiments. (d and e) Real time intracellular calcium measurements in (d) control and p35-overexpressing or (e) SIK2 knockdown MIN6 cells. Data is from a single experiment performed in triplicate, representative of three experiments. (f) Real time intracellular calcium measurements in dissociated islet cells from S/S control and SABKO mice following infection with control or p35 shRNA. Data are averaged from n=3 experiments with > 150 total cells per genotype. (g) Western blot showing pSer783 levels on VDCC immunoprecipitated from control or PJA2 knockdown MIN6 cells. (h) Real time intracellular calcium measurements with Fura-2 dye in control and PJA2 knockdown MIN6 cells. Data is from a single experiment performed in triplicate, representative of three experiments. (i) (Top left) Western blot of immunoprecipitates of enodgenous SIK2 and IgG control from MIN6 cell extracts for presence of endogenous p35. (Bottom left) Western blot of immunoprecipitates of endogenous p35 and IgG control from MIN6 cells. (Top right) Western blot of immunoprecipitates of endogenous PJA2 from extracts of HEK293T cells expressing p35-V5. (Bottom right) Western blot of immunoprecipitates of endogenous p35 and IgG control from MIN6 cell extracts for presence of endogenous PJA2. All error bars represent s.d. Statistical significance for all data was determined using two-tailed unpaired Student’s t-test (** p < 0.05). All western blot data are representative of three independent experiments with consistent results. The statistics source data for (c) is provided in Supplementary Table 1.
Figure 6
Figure 6. The SIK2-p35-PJA2 complex is required for insulin secretion
(a) Percentage of insulin secretion in S/S (n=3 mice for each condition) and SABKO (n=3 mice for each condition) islets infected with non-targeting control (CON) or p35 shRNA after treatment with 2.8 mM and 16.7 mM glucose. (b) Insulin secretion in S/S (n=3 mice for each condition) and SABKO (n=3 mice for each condition) islets treated with DMSO (vehicle) or olomoucine. S/S and SABKO islets were treated with DMSO or olomoucine (50 μM) for 1.5 h before GSIS assay. Islets were then treated with 2.8 mM and 16.7 mM glucose in the presence or absence of olomoucine. (c). (Left) Insulin secretion from islets (n=3 mice for each condition) infected with non-targeting control (CON) or PJA2 shRNA after treatment with 2.8 mM and 16.7 mM glucose. (Right) Insulin content from cells shown in the left panel. (d) (Left) Western blot anaylsis of p35 levels in MIN6 cells infected with lentivirus expressing non-targeting control (CON) or PJA2 shRNA together with or without p35 shRNA. Data is representative of three independent experiments. (Right) Percentage of insulin secretion (normalized to total insulin content) in MIN6 cells infected with lentivirus expressing non-targeting control (CON) or PJA2 shRNA together with or without p35 shRNA. Cells were treated with 1 mM or 20 mM glucose. (e) GSIS assay showing percent insulin secretion (normalized to total insulin content) in control or PJA2 knockdown MIN6 cells treated with DMSO (vehicle) or olomoucine. Cells were treated with DMSO or olomoucine (50 μM) for 1.5 h before GSIS assay. Cells were then treated with 1 mM and 20 mM glucose in the presence or absence of olomoucine (50 μM). Data in d and e are mean ± s.d. from n=3 technical replicates from a single experiment, and are representative of three independent experiments with consistent results. All error bars represent s.d. Statistical significance for all data was determined using two-tailed unpaired Student’s t-test (* p < 0.01, ** p < 0.05). The statistics source data for (a–c) are provided in Supplementary Table 1.
Figure 7
Figure 7. SIK2 is essential for beta cells to meet insulin demand in models of metabolic syndrome
(a) (Top) Western blot analysis of SIK2 protein levels in islets from control C57BL/6J (B6) and B6.V-Lepob/J (ob/ob) mice. (Bottom) Histogram showing relative intensity of SIK2 protein levels normalized to beta actin loading control. Data are mean ± s.d. from n=2 mice from a single experiment, and are representative of three independent experiments with consistent results. (b) Western blot analysis for SIK2, p35 and Lkb1 levels in islets of high fat diet-fed (20 weeks) and age matched control (normal chow diet) mice. (c) Western blot analysis of SIK2 protein levels in islets from B6 and ob/ob mice infected with non-targeting control or SIK2 shRNA lentivirus. (d) Static GSIS assay using islets from B6 and ob/ob mice infected with non-targeting control or SIK2 shRNA lentivirus (n=3 mice for each condition). Error bars represent s.d. (e) Western blot anaylsis of SIK2 levels. MIN6 cells were cultured for 15 h in 0, 5 or 25 mM glucose in the presence or absence of 2DG (25 mM). (f) (Top) Western blot anaylsis of SIK2 levels. MIN6 cells were pretreated with 100 nM rapamycin or EtOH (control) for 3h, then cultured for 15 h in 0, 5 or 25 mM glucose in the presence or absence of 100 nM rapamycin. (Bottom) Western blot anaylsis of SIK2 levels. MIN6 cells and mouse islets were pre-treated with MG132 (20 μM) or DMSO vehicle for 3h, then cultured for 15 h in 0, 5 or 25 mM glucose in the presence or absence of MG132. (g) In vitro kinase assay using GST-p35 WT and SIK2 purified from MIN6 cells cultured for 15 h in 0, 5 or 25 mM glucose together with or without 20 μM MG132. (h) Top left: Blood glucose levels of random-fed BKS.Cg-Dock7 (BKS) and BKS.Cg-Dock7m +/+ Leprdb/J (db/db) mice (n=6 for both strains). Error bars represent s.e.m. Top right: Percentage of insulin secretion from islets of BKS and db/db mice (n=3 mice for both strains). Error bars represent s.d. (Bottom) Western blot analysis of SIK2 protein levels in islets from BKS and db/db mice. Statistical significance for all data was determined using two-tailed unpaired Student’s t-test (* p < 0.01, ** p < 0.05). All western blot data are representative of two or three independent experiments with consistent results. The statistics source data for (d and h) are provided in Supplementary Table 1.
Figure 8
Figure 8. Regulation of SIK2 and AMPK by glucose in the beta cell
(a) Western blot anaylsis showing SIK2 and phosphorylation of ACC and AMPKα in MIN6 cells cultured for 15 h in 0, 5 or 25 mM glucose. Data is representative of three independent experiments. (b) Integrated model for AMPK-family mediated control of beta cell function. Left: the AMPK-mTOR signalling: In response to glucose, AMPK catalytic activity (left) is inhibited due to increase in ATP: AMP ratio. This in turn leads to depression of TORC1 and insulin biosynthesis. Right: the SIK2-p35-CDK5-PJA2 pathway: unlike AMPK, SIK2 protein, and in turn net activity, is increased in high glucose. SIK2 phosphorylates p35 at Ser91 which triggers its ubiquitination by the E3 ligase PJA2, resulting in activation of calcium signalling and insulin secretion.

Comment in

References

    1. Nolan CJ, Damm P, Prentki M. Type 2 diabetes across generations: from pathophysiology to prevention and management. Lancet. 2011;378:169–181. - PubMed
    1. Florez JC. Newly identified loci highlight beta cell dysfunction as a key cause of type 2 diabetes: where are the insulin resistance genes? Diabetologia. 2008;51:1100–1110. - PubMed
    1. Nolan CJ. Failure of islet beta-cell compensation for insulin resistance causes type 2 diabetes: what causes non-alcoholic fatty liver disease and non-alcoholic steatohepatitis? Journal of gastroenterology and hepatology. 2010;25:1594–1597. - PubMed
    1. Kahn SE. The relative contributions of insulin resistance and beta-cell dysfunction to the pathophysiology of Type 2 diabetes. Diabetologia. 2003;46:3–19. - PubMed
    1. Prentki M, Nolan CJ. Islet beta cell failure in type 2 diabetes. J Clin Invest. 2006;116:1802–1812. - PMC - PubMed

Publication types

MeSH terms