. 2014 Apr;42(8):4906-21.
doi: 10.1093/nar/gku139. Epub 2014 Feb 21.

Tissue specific CTCF occupancy and boundary function at the human growth hormone locus

Affiliations

Tissue specific CTCF occupancy and boundary function at the human growth hormone locus

Yu-Cheng Tsai et al. Nucleic Acids Res. 2014 Apr.

Abstract

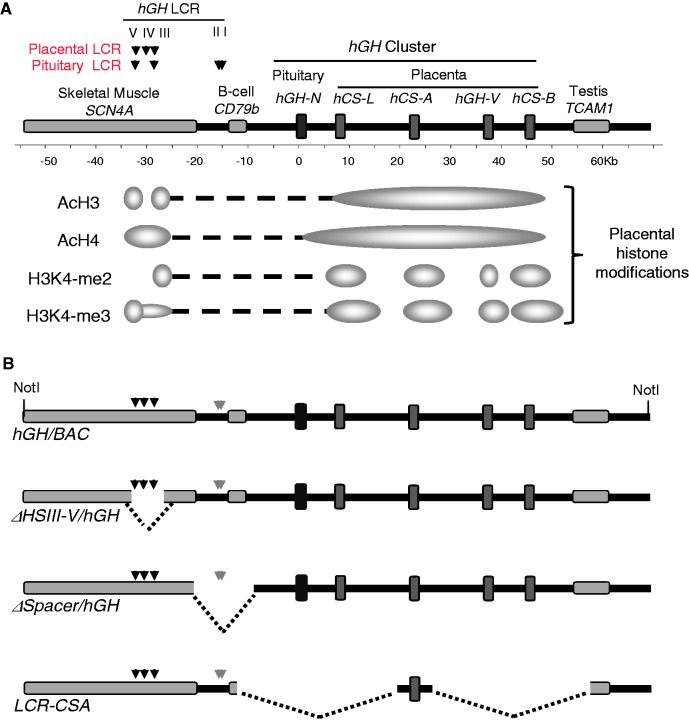
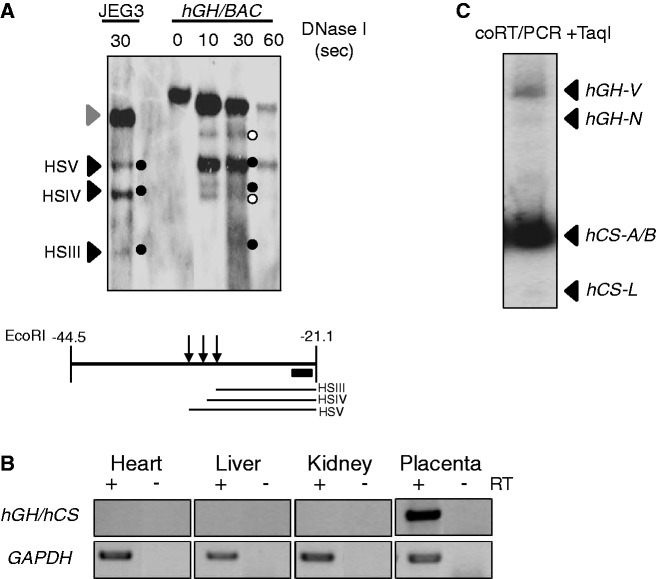
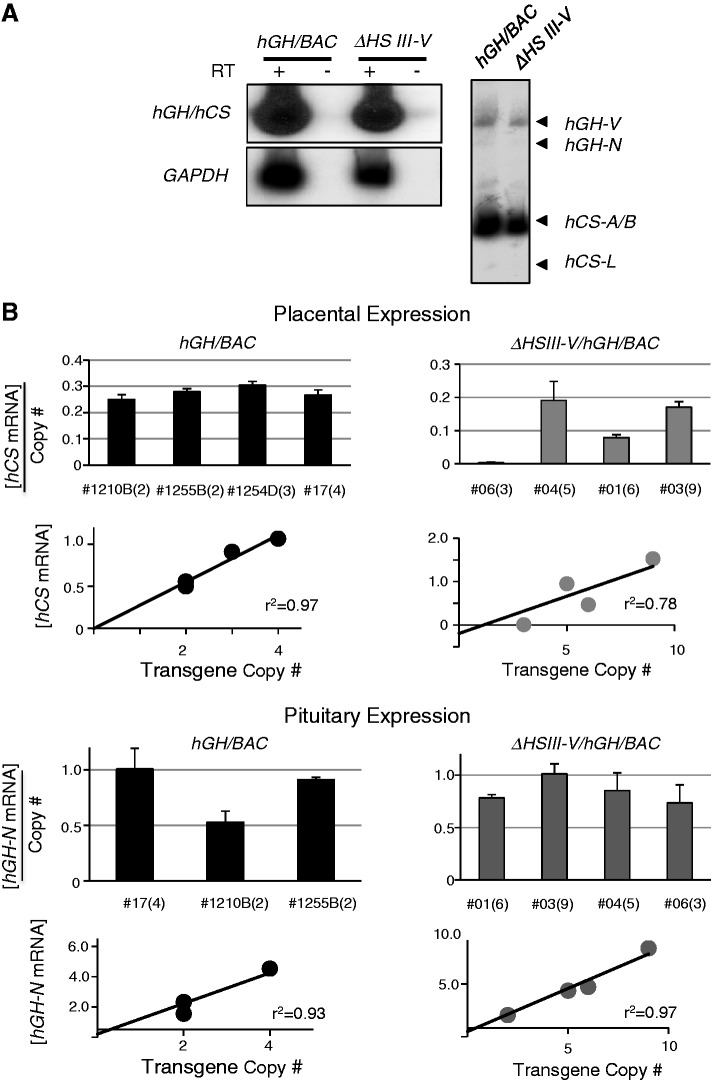
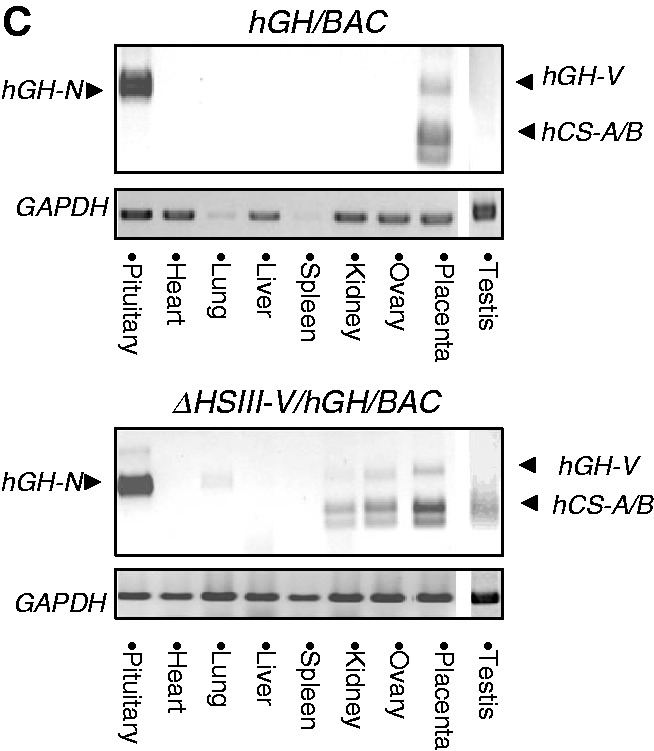
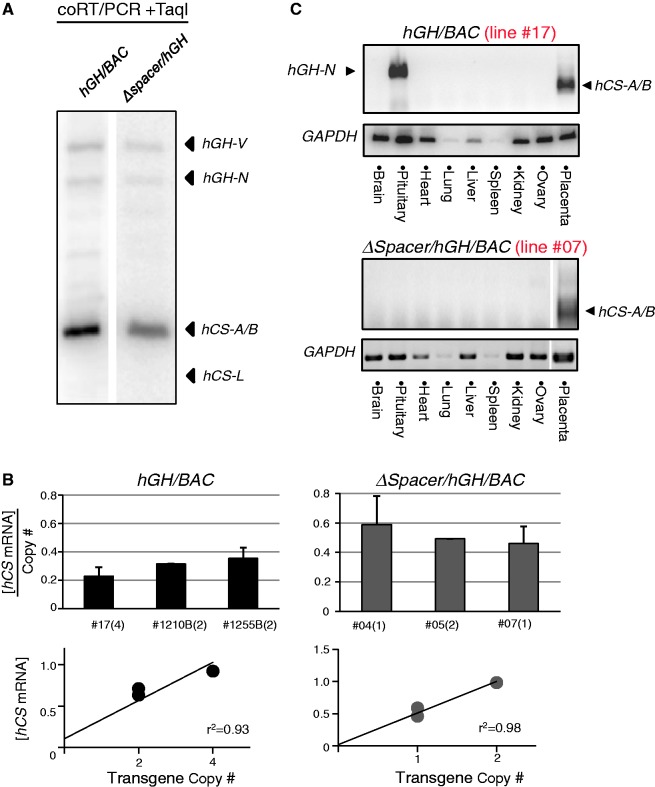
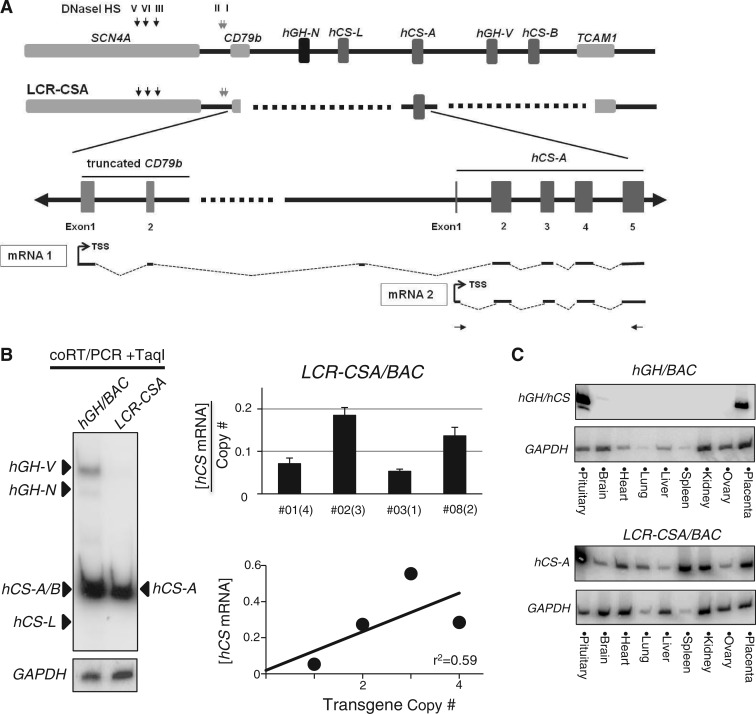
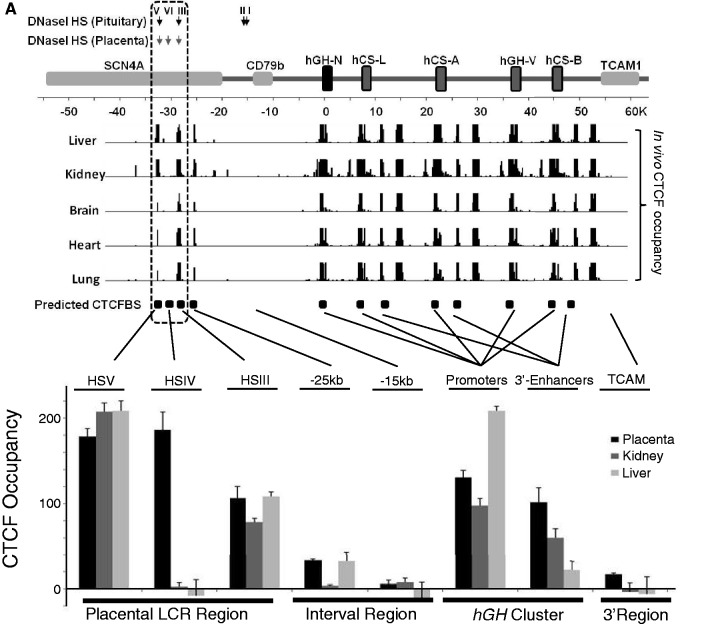
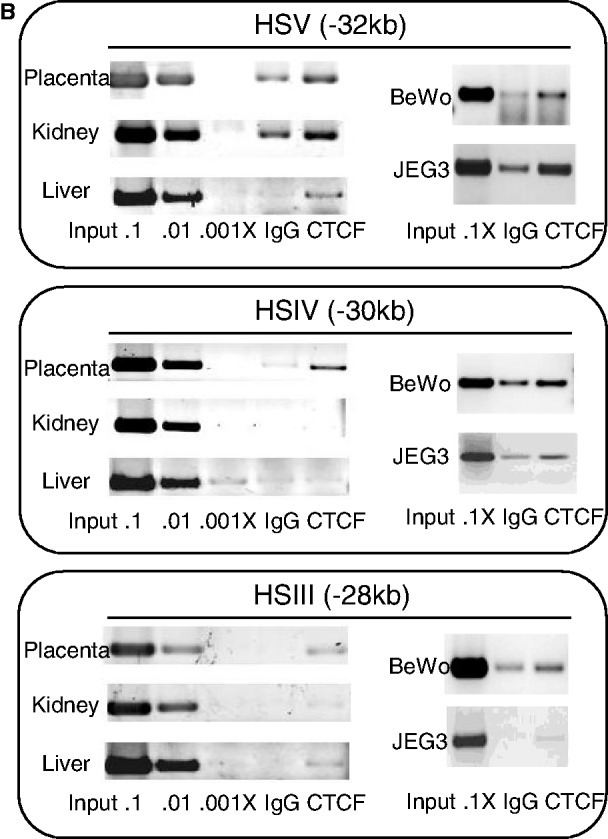
The robust and tissue-specific activation of the human growth hormone (hGH) gene cluster in the pituitary and placenta constitutes an informative model for analysis of gene regulation. The five-gene hGH cluster is regulated by two partially overlapping sets of DNase I hypersensitive sites (HSs) that constitute the pituitary (HSI, II, III and V) and placental (HSIII, IV, and V) locus control regions (LCRs). The single placenta-specific LCR component, HSIV, is located at -30 kb to the cluster. Here we generate a series of hGH/BAC transgenes specifically modified to identify structural features of the hGH locus required for its appropriate placental expression. We find that placental specificity is dependent on the overall multigene configuration of the cluster whereas the distance between the cluster and its LCR impacts the level of placental expression. We further observe that a major function of the placental hGH LCR is to insulate the transgene locus from site-of-integration effects. This insulation activity is linked to placenta-specific occupancy of the chromatin architectural protein, CTCF, at HSIV. These data reveal a remarkable combination of structural configurations and regulatory determinants that must work in concert to insure robust and tightly controlled expression from a complex multigene locus.


Figures

Figure 1.
Figure 1.
Transgenes designed to identify structural features at the hGH locus critical to placental gene activation. (A) The hGH locus and epigenetic modifications in the placenta. The hGH gene cluster encompasses five genes: the pituitary-specific growth hormone gene (hGH-N), and four placenta-specific paralogs, hCS-L, hCS-A, hGH-V and hCS-B. The gene cluster is flanked 5′ by SCN4A and CD79b genes and 3′ by TCAM1. These flanking genes are specifically expressed in skeletal muscle, B lymphocyte and testis, respectively. Our previous studies identified two overlapping sets of DNase I HSs located 5′ to the cluster in the pituitary and placenta. HSIII and V are present in multiple tissues, including pituitaries and placentas, HSI and II are pituitary-specific and critical to hGH-N expression, and HSIV is specific to the placenta (4). Previously established patterns of histone H3 and H4 acetylation and H3K4 di- and tri-methylation at the hGH locus in the chromatin of human placental STBs are indicated (5). (B) Three hGH/BAC-derived transgenes designed to identify structural determinants of placental gene expression. The structures of four transgenes are shown. The wild-type hGH/BAC transgene (hGH/BAC) comprises a 123-kb NotI genomic fragment containing the entire hGH cluster with extensive 5′- and 3′-flanking regions, including the full set of pituitary or placental LCR determinants. The HSIII–V region (placental LCR) was selectively deleted from the hGH/BAC to generate the ΔHSIII-V/hGH/BAC transgene. A 12-kb segment between HSIII and the hGH cluster was deleted from hGH/BAC to generate the ΔSpacer/hGH/BAC transgene. In transgene LCR-CSA/BAC, the entire hGH cluster was replaced by a single placental gene repeat (PGR) unit encompassing hCS-A and its adjacent 3′-enhancer and 5′ P-element.
Figure 2.
Figure 2.
The hGH transgene locus is appropriately configured and expressed in the mouse placenta. (A) DNase I HS mapping of placental chromatin from transgenic mouse embryos carrying the intact hGH/BAC. Chromatin samples were exposed to DNase I for the times indicated to generate partial digestion products. The DNAs were then extracted, digested with EcoRI and analyzed by indirect-end labeling Southern blotting, as indicated in the diagram below the autoradiograph. The intact 23-kb EcoRI fragment encompassing the HSIII–V region is indicated by the gray arrowhead to the left of the autoradiograph and the sub-fragments generated by DNase I cleavage at HSIII, IV and V are indicated by black arrows and the black dots. A corresponding analysis of chromatin from a human placental choriocarcinoma line, JEG3, served as a positive control for placental HS formation. The pattern seen is consistent with that generated from normal human term placenta (4). Notably, two sub-bands (indicated by white dots) were observed in the Southern blot. These bands were detected consistently in the human placental chromatin and were previously demonstrated as non-specific bands unrelated to DNase I treatment (4,5). (B) Expression of the intact hGH/BAC transgene demonstrated appropriate tissue specificity. RT-PCR analyses of mRNAs isolated from the indicated tissues are shown. The primer set co-amplifies mRNAs generated from all five genes in the hGH cluster. GAPDH mRNA served as loading control. (C) Expression pattern from the intact hGH/BAC transgene in the mouse placenta recapitulated the expression from the native hGH locus in the human placenta. A 32P-labeled cDNA generated from co-amplification of all five of the hGH/hCS mRNAs (as in B above) was digested by TaqI to distinguish the expression of the individual mRNA species (see Materials and methods section). The products revealed robust expression of hCS-A/hCS-B mRNAs, much lower expression of hGH-V mRNA, and only trace detection of the hCS-L pseudogene transcript and the pituitary-specific hGH-N mRNA. This pattern recapitulated that observed in the human term placenta (5).
Figure 3.
Figure 3.
The HSIII-V region played an essential role in protecting the hGH transgene locus from site-of-integration effects in the placenta. (A) hCS mRNAs were robustly expressed from the ΔHSIII-V/hGH/BAC transgene. RT/PCR (left) and coRT/PCR-TaqI (right) analyses confirmed robust and appropriately selective expression of the hCS genes in the transgenic mouse placenta (analyses as in Figure 2B and 2C). (B) Deletion of the HSIII–V region rendered transgenic expression sensitive to site-of-integration effects in the placenta but not in the pituitary. (Top) Placental studies. Expression of hCS mRNAs in the placenta of four structurally-intact hGH/BAC lines and in four ΔHSIII-V/hGH/BAC lines was determined by RT/Q-PCR. The values were each normalized to the corresponding levels of GAPDH mRNA and then normalized to transgene copy-number (shown as mean + SD, n = 3). The copy number for each line is shown in parentheses next to the respective line designations. Regression analyses of the two sets of data, shown below the corresponding histograms, evaluated the correlation between total hCS mRNA expression (mean, n = 3) and copy number. The comparison of the linear regression r2-value for the hGH/BAC and the ΔHSIII-V/hGH/BAC lines (0.97; P-value 0.02 and 0.78; P-value 0.11) revealed a significant loss of copy-number dependence of transgene expression subsequent to deletion of the HSIII-V region. (Bottom) Pituitary studies. RT/Q-PCR analysis of pituitary hGH-N mRNA was normalized to GAPDH mRNA and transgene copy number (as in placental samples, above). The histogram represents the average of expression from triplicate assays of the indicated lines (+SD). The regression analyses of the data are shown below the histograms with high r2-values for both the intact hGH/BAC and ΔHSIII-V/hGH/BAC transgenic lines. (C) Deletion of the HSIII–V region triggered ectopic expression of hCSs. Tissue surveys from an intact hGH/BAC line (#1255B) and a ΔHSIII-V/hGH/BAC line (#01) are shown. RNAs were subjected to the coRT/PCR-TaqI analysis. These studies revealed widespread ectopic expression of hCS mRNAs from ΔHSIII-V/hGH/BAC transgene. In contrast, hGH-N mRNA expression remained tightly restricted to the pituitary in both lines.
Figure 3.
Figure 3.
The HSIII-V region played an essential role in protecting the hGH transgene locus from site-of-integration effects in the placenta. (A) hCS mRNAs were robustly expressed from the ΔHSIII-V/hGH/BAC transgene. RT/PCR (left) and coRT/PCR-TaqI (right) analyses confirmed robust and appropriately selective expression of the hCS genes in the transgenic mouse placenta (analyses as in Figure 2B and 2C). (B) Deletion of the HSIII–V region rendered transgenic expression sensitive to site-of-integration effects in the placenta but not in the pituitary. (Top) Placental studies. Expression of hCS mRNAs in the placenta of four structurally-intact hGH/BAC lines and in four ΔHSIII-V/hGH/BAC lines was determined by RT/Q-PCR. The values were each normalized to the corresponding levels of GAPDH mRNA and then normalized to transgene copy-number (shown as mean + SD, n = 3). The copy number for each line is shown in parentheses next to the respective line designations. Regression analyses of the two sets of data, shown below the corresponding histograms, evaluated the correlation between total hCS mRNA expression (mean, n = 3) and copy number. The comparison of the linear regression r2-value for the hGH/BAC and the ΔHSIII-V/hGH/BAC lines (0.97; P-value 0.02 and 0.78; P-value 0.11) revealed a significant loss of copy-number dependence of transgene expression subsequent to deletion of the HSIII-V region. (Bottom) Pituitary studies. RT/Q-PCR analysis of pituitary hGH-N mRNA was normalized to GAPDH mRNA and transgene copy number (as in placental samples, above). The histogram represents the average of expression from triplicate assays of the indicated lines (+SD). The regression analyses of the data are shown below the histograms with high r2-values for both the intact hGH/BAC and ΔHSIII-V/hGH/BAC transgenic lines. (C) Deletion of the HSIII–V region triggered ectopic expression of hCSs. Tissue surveys from an intact hGH/BAC line (#1255B) and a ΔHSIII-V/hGH/BAC line (#01) are shown. RNAs were subjected to the coRT/PCR-TaqI analysis. These studies revealed widespread ectopic expression of hCS mRNAs from ΔHSIII-V/hGH/BAC transgene. In contrast, hGH-N mRNA expression remained tightly restricted to the pituitary in both lines.
Figure 4.
Figure 4.
The spacing between the HSIII–V region and the hGH gene cluster had a quantitative impact on hCS expression. (A) The native pattern of the placental gene expression from the hGH locus was fully maintained in the ΔSpacer/hGH/BAC transgene. mRNA expression from an intact hGH/BAC transgene (line #17) and a line carrying the ΔSpacer/hGH/BAC transgene (line #7) were analyzed by coRT/PCR-TaqI analysis (as in Figure 2C). (B) Gene expression from the ΔSpacer/hGH/BAC transgene was maintained in strict copy-number dependence. The RT/Q-PCR data compared copy-number expression from three hGH/BAC lines and three ΔSpacer/hGH/BAC lines. The regression analyses confirmed strict copy-number dependence in both sets of data. Remarkably, the expression per transgene copy from ΔSpacer/hGH/BAC lines was consistently higher than from the hGH/BAC lines (average of 0.51 and 0.30, respectively). (C) The placenta-specific expression of hCS mRNAs was fully maintained in the ΔSpacer/hGH/BAC lines. Analyses of nine tested tissues from the intact hGH/BAC (line #17) and the ΔSpacer/hGH/BAC (line #7) revealed that the activation of placental CS genes is restricted to the E18 placenta in both sets of transgenes. The hGH-N expression in the pituitary was selectively inactivated in the ΔSpacer/hGH/BAC transgene due to the deletion of the pituitary-specific HSI and II (located within the 12-kb deleted region).
Figure 5.
Figure 5.
The multigene structure of the hGH locus was critical for the appropriate activation of the placental hCS genes. (A) Replacement of the hGH gene cluster with a single PGR unit (LCR-CSA/BAC transgene). Replacing the hGH cluster with a single hCS-A PGR unit involved truncation of the 3′ terminus of the B-cell specific CD79b gene. Thus, any transcription initiated from the B-cell promoter of the CD79b gene in contaminating B cells would have the possibility of extending into the CS-A locus (‘mRNA1’). To specifically detect transcripts originating from the hCS promoter (‘mRNA2’ originating at the hCS promoter) we used the RT/PCR primer set shown in the diagram. (B) hCS-A was robustly expressed from the LCR-CSA/BAC transgene but lacked copy-number dependence. CoRT/PCR-TaqI analysis (as in Figure 2C) confirmed robust hCS-A mRNA expression from the LCR-CSA/BAC transgene (left panel). However the levels of the expression per transgene copy demonstrated a marked line-to-line variation (r2 = 0.59) (right panels). (C) Expression of hCS from the LCR-CSA/BAC transgene demonstrated a dramatic loss of tissue specificity. Tissue survey of expression from the indicated hGH transgene loci was analyzed by RT/PCR.
Figure 6.
Figure 6.
Placenta-specific occupancy of CTCF at HSIV of the hGH LCR. (A) Placental specific occupancy of CTCF at HSIV. The positions of the previously reported DNase I HSs at the hGH locus (4) and the predicted CTCF-binding site (CTCFBS) across the locus based on the presence of consensus sequences (24) are indicated (downward arrows and boxes, respectively). In vivo CTCF occupancy across the hGH locus in five primary human tissues are shown below the locus diagram (ENCODE data base). The predicted and documented CTCF-binding sites were highly correlated and indicated that the great majority of CTCF sites in this region are constitutive. The clear outlier was the predicted CTCF-binding site co-mapping with HSIV (–30 kb); this predicted CTCF site was unique in this region in that it lacks in vivo occupancy in the multiple tissues sampled. The enrichment of CTCFs in the placental LCR of hGH locus was investigated by ChIP. CTCF-bound chromatin fragments were immunoprecipitated from E18 placenta, kidney and liver of an hGH/BAC transgenic mouse. A serial dilution of input DNA was used to confirm that the PCR amplification was in linear range and an IgG antibody was used for the IP negative control. DNAs isolated from the IP pellets were assessed by PCR using three primer sets that tested the predicted CTCF-binding sites at HSIII, HSIV and HSV (shown in Figure 6B). Enrichment values were quantified and normalized with the positive control (see Materials and methods section, defined as 100). The columns in the histogram represent the average of duplicated experiments with standard deviations (n = 2). The CTCF distribution across the hGH locus showed that the CTCFs were enriched at all three HS sites in placenta (black column), but were limited to the HSIII and HSV in kidney (dark gray column) and liver (light gray column). The enrichment in the region between LCR and hGH cluster was detected at a lower level (∼30%) at coordinate –25 kb in placenta and liver, and at background level at coordinate –15 kb site in all tested tissues. The enrichment was also observed at promoters of hGH/CS genes and 3′-enhancers of hCS genes in the gene cluster (a single PGR represents all placental units in the analysis due to the highly conserved sequence in these regions). (B) CTCF binding at HSIII, IV and V in primary tissues and in two placental cell lines. CTCF ChIP was carried out on chromatin isolated from the indicated primary tissues of hGH/BAC mice and from two human choriocarcinoma cell lines, BeWo and JEG3. The assay confirmed CTCF occupancy at HSIV in these placental cell lines.
Figure 6.
Figure 6.
Placenta-specific occupancy of CTCF at HSIV of the hGH LCR. (A) Placental specific occupancy of CTCF at HSIV. The positions of the previously reported DNase I HSs at the hGH locus (4) and the predicted CTCF-binding site (CTCFBS) across the locus based on the presence of consensus sequences (24) are indicated (downward arrows and boxes, respectively). In vivo CTCF occupancy across the hGH locus in five primary human tissues are shown below the locus diagram (ENCODE data base). The predicted and documented CTCF-binding sites were highly correlated and indicated that the great majority of CTCF sites in this region are constitutive. The clear outlier was the predicted CTCF-binding site co-mapping with HSIV (–30 kb); this predicted CTCF site was unique in this region in that it lacks in vivo occupancy in the multiple tissues sampled. The enrichment of CTCFs in the placental LCR of hGH locus was investigated by ChIP. CTCF-bound chromatin fragments were immunoprecipitated from E18 placenta, kidney and liver of an hGH/BAC transgenic mouse. A serial dilution of input DNA was used to confirm that the PCR amplification was in linear range and an IgG antibody was used for the IP negative control. DNAs isolated from the IP pellets were assessed by PCR using three primer sets that tested the predicted CTCF-binding sites at HSIII, HSIV and HSV (shown in Figure 6B). Enrichment values were quantified and normalized with the positive control (see Materials and methods section, defined as 100). The columns in the histogram represent the average of duplicated experiments with standard deviations (n = 2). The CTCF distribution across the hGH locus showed that the CTCFs were enriched at all three HS sites in placenta (black column), but were limited to the HSIII and HSV in kidney (dark gray column) and liver (light gray column). The enrichment in the region between LCR and hGH cluster was detected at a lower level (∼30%) at coordinate –25 kb in placenta and liver, and at background level at coordinate –15 kb site in all tested tissues. The enrichment was also observed at promoters of hGH/CS genes and 3′-enhancers of hCS genes in the gene cluster (a single PGR represents all placental units in the analysis due to the highly conserved sequence in these regions). (B) CTCF binding at HSIII, IV and V in primary tissues and in two placental cell lines. CTCF ChIP was carried out on chromatin isolated from the indicated primary tissues of hGH/BAC mice and from two human choriocarcinoma cell lines, BeWo and JEG3. The assay confirmed CTCF occupancy at HSIV in these placental cell lines.

Similar articles

Cited by

References

    1. The ENCODE Project Consortium. An integrated encyclopedia of DNA elements in the human genome. Nature. 2012;489:57–74. - PMC - PubMed
    1. Portela A, Esteller M. Epigenetic modifications and human disease. Nat. Biotechnol. 2010;28:1057–1068. - PubMed
    1. Chen EY, Liao YC, Smith DH, Barrera-Saldaña HA, Gelinas RE, Seeburg PH. The human growth hormone locus: Nucleotide sequence, biology, and evolution. Genomics. 1989;4:479–497. - PubMed
    1. Jones BM, Monks BR, Liebhaber SA, Cooke NE. The human growth hormone gene is regulated by a multicomponent locus control region. Mol. Cell. Biol. 1995;15:7010–7021. - PMC - PubMed
    1. Kimura AP, Sizova D, Handwerger S, Cooke NE, Liebhaber SA. Epigenetic activation of the human growth hormone gene cluster during placental cytotrophoblast differentiation. Mol. Cell Biol. 2007;27:6555–6568. - PMC - PubMed

Publication types