. 2014 Apr;17(4):540-8.
doi: 10.1038/nn.3652. Epub 2014 Feb 23.

Opioids induce dissociable forms of long-term depression of excitatory inputs to the dorsal striatum

Affiliations

Opioids induce dissociable forms of long-term depression of excitatory inputs to the dorsal striatum

Brady K Atwood et al. Nat Neurosci. 2014 Apr.

Abstract

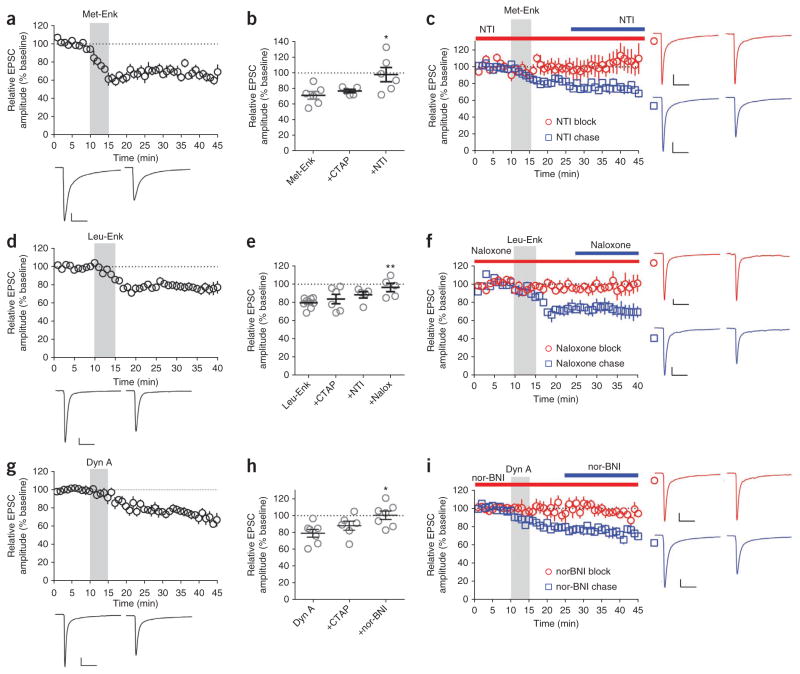
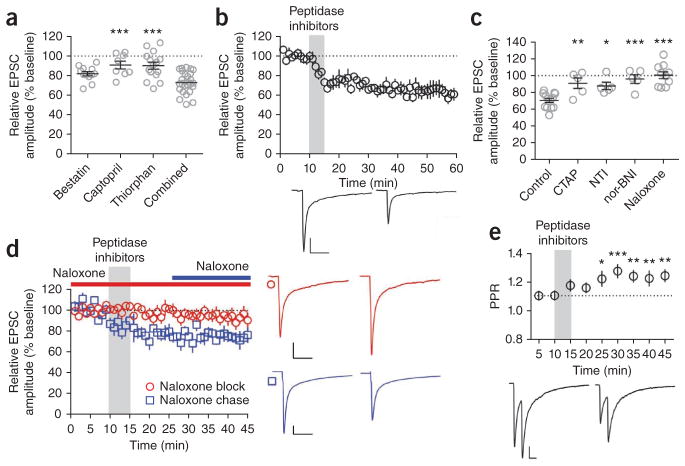
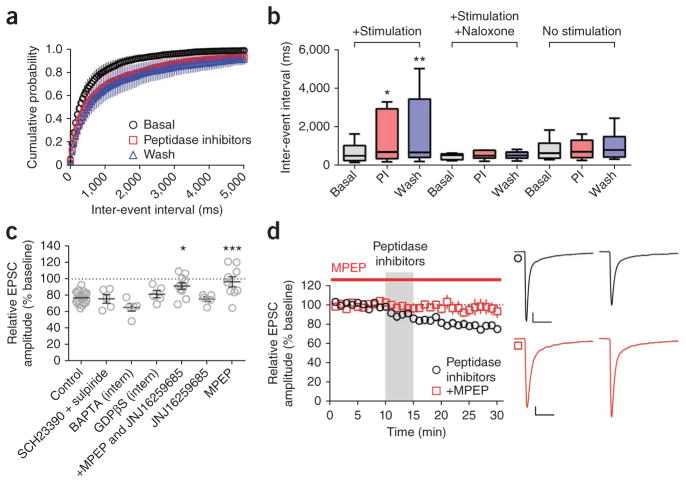
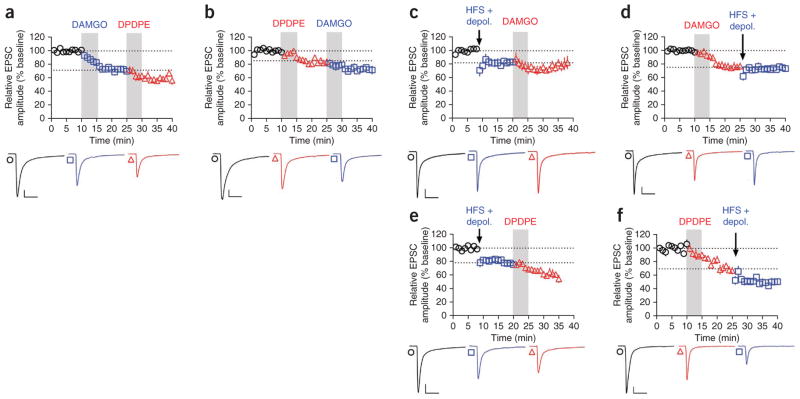
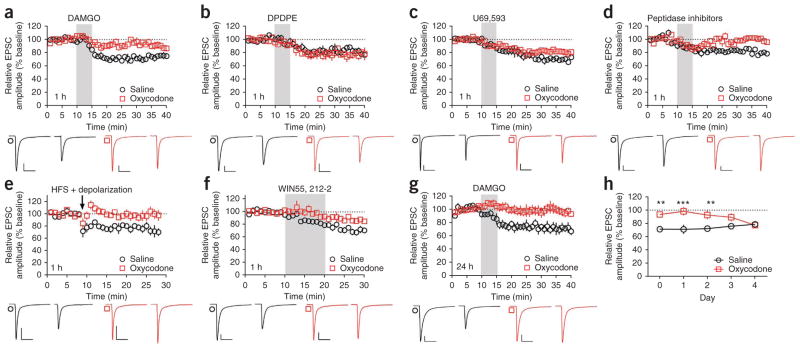
As prescription opioid analgesic abuse rates rise, so does the need to understand the long-term effects of opioid exposure on brain function. The dorsal striatum is an important site for drug-induced neuronal plasticity. We found that exogenously applied and endogenously released opioids induced long-term depression (OP-LTD) of excitatory inputs to the dorsal striatum in mice and rats. Mu and delta OP-LTD, although both being presynaptically expressed, were dissociable in that they summated, differentially occluded endocannabinoid-LTD and inhibited different striatal inputs. Kappa OP-LTD showed a unique subregional expression in striatum. A single in vivo exposure to the opioid analgesic oxycodone disrupted mu OP-LTD and endocannabinoid-LTD, but not delta or kappa OP-LTD. These data reveal previously unknown opioid-mediated forms of long-term striatal plasticity that are differentially affected by opioid analgesic exposure and are likely important mediators of striatum-dependent learning and behavior.


Conflict of interest statement

COMPETING FINANCIAL INTERESTS

The authors declare no competing financial interests.

Figures

Figure 1
Figure 1
Opioid receptor activation produces LTD of excitatory transmission in dorsal striatum. (a) DAMGO (0.3 μM, 5 min) induced mOP-LTD of eEPSC amplitude in MSNs of the rat DLS (n = 9). (b) The MOPr antagonist CTAP (1 μM) prevented mOP-LTD when applied before DAMGO (versus DAMGO, P = 0.0030, t14 = 3.590, n = 7). CTAP failed to reverse mOP-LTD when applied after DAMGO (versus CTAP block, P = 0.0011, t11 = 4.394, n = 6). (c) DPDPE (0.3 μM, 5 min) induced dOP-LTD (n = 9). (d) The DOPr antagonist naltrindole (NTI, 1 μM) prevented dOP-LTD (versus DPDPE, P = 0.0026, t12 = 3.780, n = 5). NTI failed to reverse dOP-LTD (versus NTI block, P = 0.0012, t9 = 4.649, n = 6). (e) U69,593 (0.3 μM, 5 min) induced kOP-LTD (n = 10). (f) The KOPr antagonist nor-BNI (0.1 μM) prevented kOP-LTD (versus U69,593, P = 0.0066, t13 = 3.228, n = 5). nor-BNI failed to reverse kOP-LTD (versus nor-BNI block, P = 0.0499, t9 = 2.264, n = 6). (g) DAMGO (0.3 μM, 5 min) induced a long-lasting increase in the PPR of eEPSC amplitude in MSNs of the DLS (P = 0.0002, F7,56 = 4.981, n = 9). (h) DPDPE (0.3 μM, 5 min) produced a long-lasting increase in PPR (P < 0.0001, F7,91 = 5.210, n = 14). (i) U69,593 (0.3 μM, 5 min) produced a delayed increase in PPR (P = 0.0081, F7,63 = 3.041, n = 10). Representative traces are the average of the first 10 min (first of each pair) and the final 10 min (second of each pair) of recording. Scale bars represent 50 pA, 50 ms. All error bars indicate s.e.m. Data in af were analyzed with unpaired Student’s t-test. Data in gi were analyzed with a repeated-measures ANOVA with Dunnett’s multiple comparisons post-test versus 5 min. *P < 0.05, **P < 0.01, ***P < 0.001.
Figure 2
Figure 2
Bath application of endogenous opioid peptides produces OP-LTD. (a) Met-Enk (10 μM, 5 min) produced LTD of eEPSC amplitude (n = 6). (b) Met-Enk–induced OP-LTD (n = 6) was induced in the presence of CTAP (1 μM, n = 5), but was prevented in the presence of NTI (1 μM, n = 6) (P = 0.0246, F2,14 = 4.883). (c) NTI blocked (n = 6), but did not reverse, Met-Enk–induced OP-LTD (versus NTI block, P = 0.0649, t9 = 2.102, n = 5). (d) Leu-Enk (10 μM, 5 min) produced OP-LTD (n = 9). (e) Neither CTAP (1 μM, n = 6) nor NTI (1 μM, n = 5) blocked Leu-Enk–induced OP-LTD (P = 0.0231, F3,21 = 3.907). However, naloxone (nalox, 2 μM) completely blocked Leu-Enk–induced OP-LTD (n = 5). (f) Naloxone blocked (n = 5), but did not reverse, Leu-Enk–induced OP-LTD (versus naloxone block, P = 0.0407, t9 = 2.387, n = 6). (g) Dynorphin A (Dyn A, 1 μM, 5 min) produced OP-LTD (n = 7). (h) Dyn A–induced OP-LTD was induced in the presence of CTAP (1 μM, n = 6), but was prevented in presence of nor-BNI (0.1 μM, n = 7) (P = 0.0214, F2,17 = 4.860). (i) nor-BNI blocked (n = 6), but did not reverse, Dyn A–induced OP-LTD (versus nor-BNI block, P = 0.0086, t9 = 3.346, n = 5). Representative traces are the average of the first 10 min (first of each pair) and the final 10 min (second of each pair) of recording. Scale bars represent 50 pA, 50 ms. All error bars indicate s.e.m. Data in a,c,d,f,g,i were analyzed with Student’s t test (paired, drug versus baseline; unpaired, block versus chase). Data in b,e,h were analyzed with one-way ANOVA with Tukey’s post-test. *P < 0.05, **P < 0.01.
Figure 3
Figure 3
Endogenously released opioid peptides induce OP-LTD. (a) Bath application (5 min) of the peptidase inhibitors bestatin (10 μM, n = 12), captopril (10 μM, n = 8) and DL-thiorphan (1 μM, n = 15), or a combination of the three, induced LTD of eEPSC magnitude (n = 25) (P < 0.0001, F3,56 = 9.366). (b) The peptidase inhibitors induced LTD (n = 5). (c) CTAP (1 μM, n = 5) and nor-BNI (100 nM, n = 5) blocked, and NTI (1 μM, n = 5) partially blocked, the LTD induced by peptidase inhibitors. Naloxone (2 μM, n = 6) completely blocked LTD (P < 0.0001, F4,33 = 11.51). (d) Naloxone blocked (n = 6), but did not reverse, the LTD induced by peptidase inhibitors (versus naloxone block, P = 0.0305, t9 = 2.565, n = 5). (e) Peptidase inhibitors increased the PPR of eEPSC amplitude (P < 0.0001, F8,144 = 5.714, n = 27). Representative traces are the average of the first 10 min (first of each pair) and the final 10 min (second of each pair) of recording. Scale bars represent 50 pA, 50 ms. All error bars indicate s.e.m. Data in a,c,e were analyzed with one-way ANOVA with Dunnett’s multiple comparisons post-test. Data in b,d were analyzed with unpaired Student’s t test. *P < 0.05, **P < 0.01, ***P < 0.001.
Figure 4
Figure 4
Endogenous opioids are released in an mGluR5 and activity-dependent manner. (a,b) Electrical stimulation (0.05 Hz) during the application of peptidase inhibitors increased the sEPSC IEI (P = 0.0008, Friedman statistic = 12.60, n = 10). (b) Naloxone blocked the effect of the inhibitors paired with stimulation (P = 0.7402, Friedman statistic = 1.000, n = 6). Without electrical stimulation, the peptidase inhibitors (PI) did not alter sEPSC IEI (P = 0.2192, Friedman statistic = 3.455, n = 11). (c) Peptidase inhibitors induced OP-LTD in the presence of the dopamine receptor antagonists SCH23390 and sulpiride (2 μM each, n = 5), intrapipette membrane-impermeable BAPTA (20 mM, n = 5), or intrapipette GDPβS (2 mM, n = 5). Combined application of the mGluR1 antagonist (JNJ16259685, 0.75 μM) and the mGluR5 antagonist MPEP (10 μM), prevented OP-LTD induced by the peptidase inhibitors (n = 10). JNJ16259685 alone failed to inhibit the peptidase inhibitor–induced LTD (n = 5). MPEP alone prevented peptidase inhibitor–induced OP-LTD (n = 9) (P < 0.0001, F7,54 = 6.348). (d) Time course of experiment showing MPEP blockade of peptidase inhibitor–induced OP-LTD (versus control, P = 0.0037, t21 = 3.260, n = 14). Representative traces are the average of the first 10 min (first of pair) and the final 5 min (second of pair) of recording. Scale bars in d represent 50 pA, 50 ms. Error bars in a,c,d indicate s.e.m. Error bars in b indicate the range from minimum to maximum, and box boundaries indicate 25th percentile, median and 75th percentile. Data in a,b were analyzed with Friedman test with Dunn’s multiple comparisons post-test. Data in c were analyzed with one-way ANOVA with Dunnett’s multiple comparisons post-test. Data in d were analyzed with unpaired Student’s t test. *P < 0.05, **P < 0.01, ***P < 0.001.
Figure 5
Figure 5
mOP- and dOP-LTD operate independently. (a) DPDPE (0.3 μM, 5 min) induced LTD of eEPSC amplitude beyond that induced by DAMGO (0.3 μM, 5 min; versus DAMGO, P = 0.0178, t6 = 3.237, n = 7). (b) DAMGO (0.3 μM, 5 min) induced LTD beyond that induced by DPDPE (0.3 μM, 5 min; versus DPDPE, P = 0.0055, t6 = 4.222, n = 6). (c) eCB-LTD, induced by high-frequency stimulation (HFS, 4× 1 s at 100 Hz, 10 s apart) paired with depolarization to 0 mV, occluded LTD induced by DAMGO (0.3 μM, 5 min; versus HFS, P = 0.1121, t7 = 1.817, n = 8). (d) DAMGO (0.3 μM, 5 min) occluded eCB-LTD (versus DAMGO, P = 0.5372, t8 = 0.6447, n = 10). (e) eCB-LTD did not occlude LTD induced by DPDPE (0.3 μM, 5 min; versus HFS, P = 0.0013, t6 = 5.668, n = 7). (f) DPDPE (0.3 μM, 5 min) did not occlude eCB-LTD (versus DPDPE, P = 0.0208, t6 = 3.111, n = 7). Representative traces are the average of the first 10 min (first of each triplet), the 5 min before initiation of second treatment (second of each triplet), and final 5 min of recording (third of each triplet). Scale bars represent 50 pA, 50 ms. All error bars indicate s.e.m. Data in af were analyzed with Student’s paired t tests.
Figure 6
Figure 6
MOPrs and DOPrs differentially inhibit specific striatal inputs. (a) Expression of ChR2-Venus in thalamic nuclei following injection of AAV vector into thalamus and expression in dorsal striatal areas receiving thalamic input. Images are representative of four injected mice. Note that thalamic injections resulted in some Venus expression in overlying hippocampus. To evaluate possible contributions of hippocampal afferents to our observations, we explicitly injected ChR2-Venus AAV vector into the hippocampus. As expected, we observed no Venus-positive afferent fibers in dorsal striatum (Supplementary Fig. 6). (b) Expression of ChR2-Venus in motor cortex following injection of AAV vector into M1/M2 cortices and expression in dorsal striatal areas receiving cortical input. Images are representative of six injected mice. (c) 470-nm light-evoked oEPSCs in DLS MSNs were greatly reduced by DAMGO (0.3 μM, 5 min) in slices in which ChR2-Venus was expressed in thalamostriatal inputs (n = 6 cells from 4 mice), and largely unchanged in slices in which ChR2-Venus was expressed in motor corticostriatal inputs (versus thalamostriatal, P = 0.0062, t9 = 3.549, n = 5 cells from 4 mice). Thalamostriatal experiments were extended to demonstrate a continuing washout of the inhibitory effect of DAMGO. (d) oEPSCs in DLS MSNs were nonsignificantly inhibited by DPDPE (0.3 μM, 5 min) when ChR2-Venus was expressed in thalamostriatal inputs (n = 7 cells from 4 mice), and showed LTD following DPDPE in slices in which ChR2-Venus was expressed in motor corticostriatal inputs (versus thalamostriatal, P = 0.0022, t12 = 3.873, n = 7 cells from 5 mice). Scale bars in a,b represent 1 mm. Scale bars in c,d represent 50 pA, 50 ms. Representative traces are the average of the first 10 min (first of each pair) and the final 10 min (second of each pair) of recording. All error bars indicate s.e.m. Data in c,d were analyzed by unpaired Student’s t test.
Figure 7
Figure 7
A single in vivo exposure to oxycodone prevents induction of mOP- and eCB-LTD. (a) Mice injected with saline (intraperitoneal), but not oxycodone (1 mg per kg, intraperitoneal), 1 h before death showed DAMGO-induced (0.3 μM, 5 min) mOP-LTD of eEPSCs in DLS MSNs (versus saline, P = 0.0383, t4 = 3.041, n = 5 mice each). (b) DPDPE (0.3 μM, 5 min) induced dOP-LTD in MSNs of both saline- and oxycodone-injected mice (versus saline, P = 0.2047, t4 = 1.514, n = 5 mice each). (c) U69,593 (0.3 μM, 5 min) induced LTD in both saline- and oxycodone-injected mice and LTD was reduced in oxycodone-injected mice (P = 0.0195, t4 = 3.777, n = 5 mice each). (df) Oxycodone disrupted LTD induced by peptidase inhibitors (5 min, versus saline, P = 0.0029, t4 = 6.499, n = 5 mice each; d), eCB-LTD stimulation protocol (P = 0.0147, t4 = 4.116, n = 5 mice each; e) and WIN55,212-2 application (1 μM, 10 min, P = 0.0388, t4 = 3.030, n = 5 mice each; f). (g) In mice killed 24 h after an oxycodone injection, DAMGO failed to induce LTD (P = 0.0263, t5 = 3.118, n = 6 mice each). (h) Oxycodone disrupted LTD induced by DAMGO up to 2 d post-injection. Mice were killed 1 h (day 0) to 4 d post-injection (day 0, n = 5 mice each; day 1, n = 6 mice each; day 2, n = 6 mice each; day 3, n = 5 mice each; day 4, n = 5 mice each; treatment: P < 0.0001, F1,22 = 36.83; day: P = 0.8467, F4,22 = 0.3419; interaction: P = 0.0303, F4,22 = 3.265). Representative traces are the average of the first 10 min (first of each pair) and the final 10 min (second of each pair) of recording. Scale bars represent 50 pA, 50 ms. All error bars indicate s.e.m. Data in ag were analyzed with Student’s paired t test. Data in h were analyzed with two-way repeated measures ANOVA with Sidak’s multiple comparisons post-test. **P < 0.01, ***P < 0.001.

References

    1. Cicero TJ, Inciardi JA, Muñoz A. Trends in abuse of oxycontin and other opioid analgesics in the United States: 2002–2004. J Pain. 2005;6:662–672. - PubMed
    1. Compton WM, Volkow ND. Major increases in opioid analgesic abuse in the United States: concerns and strategies. Drug Alcohol Depend. 2006;81:103–107. - PubMed
    1. Manubay JM, Muchow C, Sullivan MA. Prescription drug abuse: epidemiology, regulatory issues, chronic pain management with narcotic analgesics. Prim Care. 2011;38:71–90. - PMC - PubMed
    1. Ordóñez Gallego A, González Barón M, Espinosa Arranz E. Oxycodone: a pharmacological and clinical review. Clin Transl Oncol. 2007;9:298–307. - PubMed
    1. Le Merrer J, Becker JAJ, Befort K, Kieffer BL. Reward processing by the opioid system in the brain. Physiol Rev. 2009;89:1379–1412. - PMC - PubMed

Publication types

MeSH terms