Comparative Study
. 2014 Apr;17(4):559-68.
doi: 10.1038/nn.3660. Epub 2014 Feb 23.

Sparse, decorrelated odor coding in the mushroom body enhances learned odor discrimination

Affiliations
Comparative Study

Sparse, decorrelated odor coding in the mushroom body enhances learned odor discrimination

Andrew C Lin et al. Nat Neurosci. 2014 Apr.

Abstract

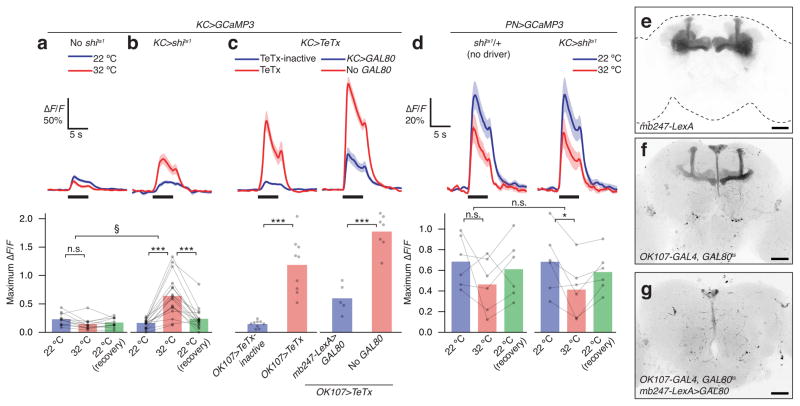
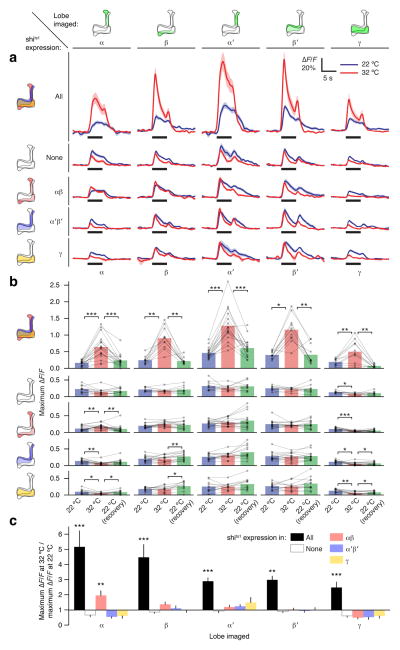
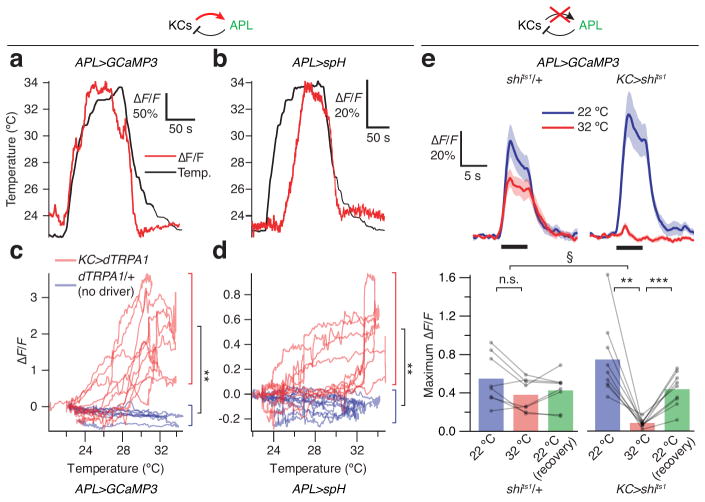
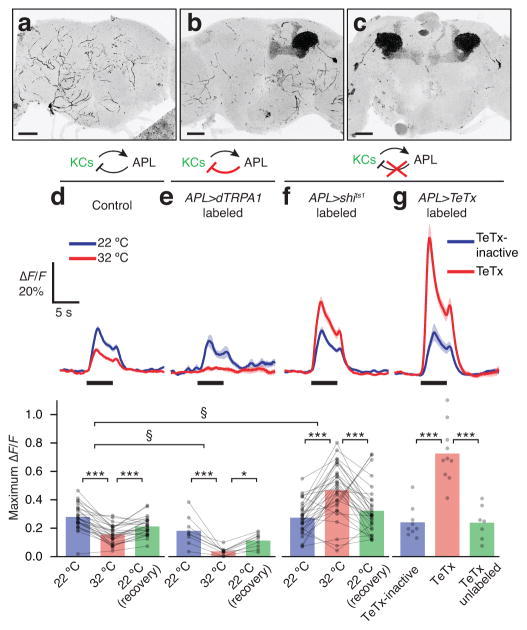
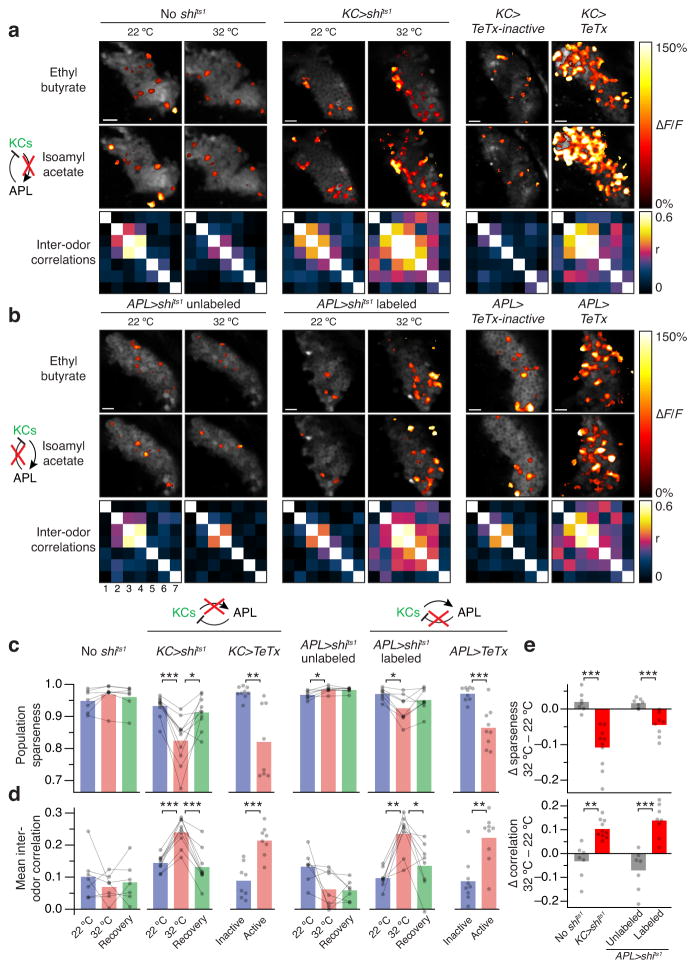
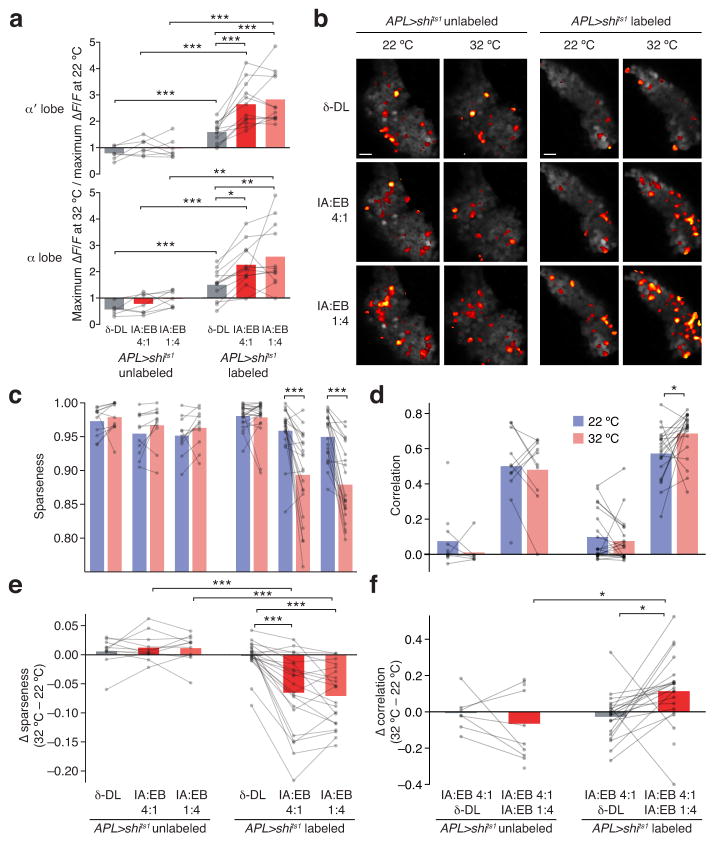
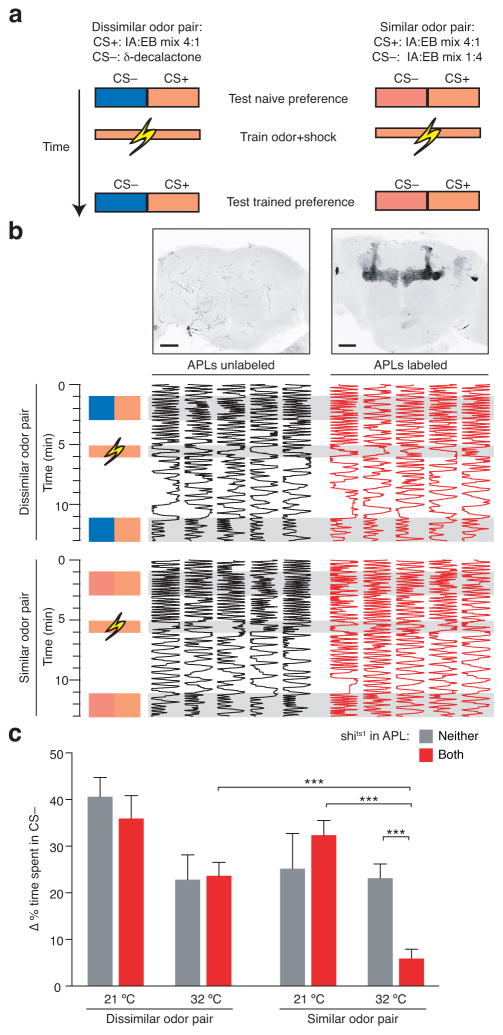
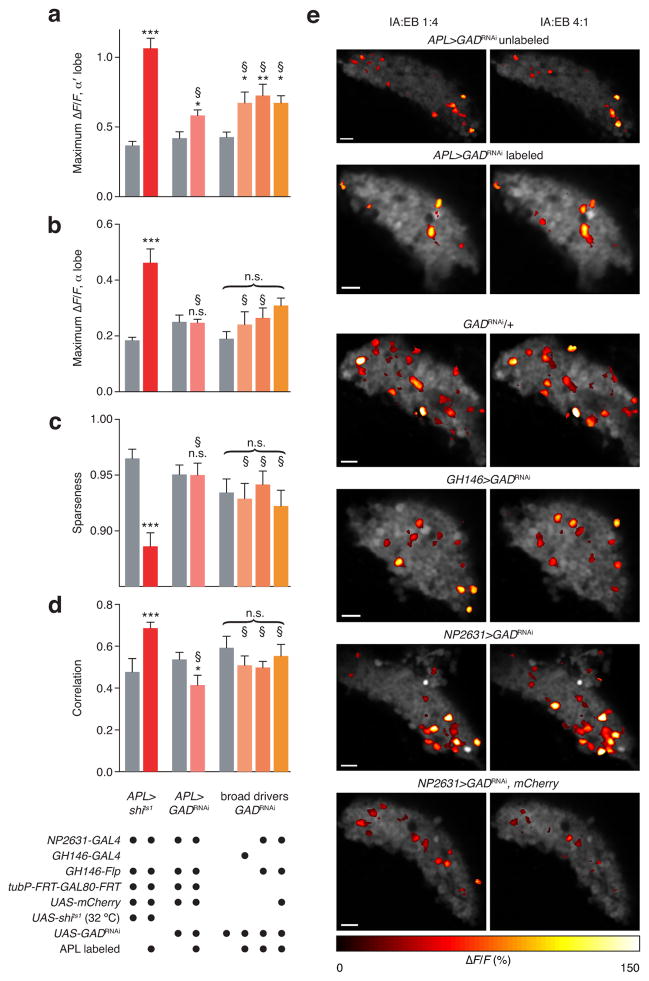
Sparse coding may be a general strategy of neural systems for augmenting memory capacity. In Drosophila melanogaster, sparse odor coding by the Kenyon cells of the mushroom body is thought to generate a large number of precisely addressable locations for the storage of odor-specific memories. However, it remains untested how sparse coding relates to behavioral performance. Here we demonstrate that sparseness is controlled by a negative feedback circuit between Kenyon cells and the GABAergic anterior paired lateral (APL) neuron. Systematic activation and blockade of each leg of this feedback circuit showed that Kenyon cells activated APL and APL inhibited Kenyon cells. Disrupting the Kenyon cell-APL feedback loop decreased the sparseness of Kenyon cell odor responses, increased inter-odor correlations and prevented flies from learning to discriminate similar, but not dissimilar, odors. These results suggest that feedback inhibition suppresses Kenyon cell activity to maintain sparse, decorrelated odor coding and thus the odor specificity of memories.


Conflict of interest statement

Competing Financial Interests

The authors declare no competing financial interests.

Figures

Figure 1
Figure 1. Feedback inhibition of Kenyon cell responses by Kenyon cell output
(a) Kenyon cells in control mb247-LexA>GCaMP3 flies show no temperature-dependent increase in odor-evoked Ca2+ influx in the α lobe. Black bars indicate 5-s pulses of ethyl acetate. Traces depict average ΔF/F; shading indicates s.e.m. n=11 [10] (number of brain hemispheres [number of flies]). (b) Kenyon cells in experimental mb247-LexA>GCaMP3,shits1 flies show a large temperature-dependent increase in odor-evoked Ca2+ influx in the α lobe. n=16 [15]. *** P<0.001, Friedman test with Dunn’s multiple comparisons test. § P<0.001, Mann-Whitney U-test, comparing ratios of odor-evoked Ca2+ influx at 32 °C vs. 22 °C between control and mb247-LexA>shits1 flies. (c) Left panels: OK107>TeTx flies (red, n=9) show a large increase in odor-evoked Ca2+ influx in the α lobe compared to OK107>TeTx-inactive flies (blue, n=9). Right panels: odor-evoked Ca2+ influx is higher in OK107>TeTx, mb247-LexA>GCaMP3 flies (blue, n=5) than in OK107>TeTx, mb247-LexA>GCaMP3,GAL80 flies (red, n=7). *** P<0.001, unpaired Welch t-test. (d) Odor-evoked Ca2+ influx in PNs innervating the calyx declines slightly with temperature in both NP225>GCaMP3, mb247-LexA>shits1 and NP225>GCaMP3, shits1/+ flies. * P<0.05, repeated-measures ANOVA with Geisser-Greenhouse correction and Holm-Sidak multiple comparisons test. n=6. Bracket between panels indicates that the ratio of odor-evoked Ca2+ influx at 32 °C vs. 22 °C does not differ significantly between panels (unpaired Welch t-test, P=0.60). (e–g) Representative maximum intensity projections of confocal image stacks showing expression patterns of: (e) mb247-LexA; (f) OK107, GAL80ts; (g) OK107, GAL80ts, mb247-LexA>Gal80. Scale bars, 50 μm. See Supplementary Table 1 for full genotypes.
Figure 2
Figure 2. Feedback is from all Kenyon cells to all Kenyon cells
(a) Impact of blocking output of different Kenyon cell populations (rows) on odor-evoked Ca2+ influx in different mushroom body lobes (columns). By row: All: blocking all Kenyon cells increases odor-evoked Ca2+ influx in all lobes of the mushroom body in mb247-LexA>GCaMP3,shits1 flies. None: raising the temperature has no effect on, or slightly decreases, odor responses in all lobes of control mb247-LexA>GCaMP3 flies. αβ: blocking αβ neurons slightly increases odor responses only in the α lobes of mb247-LexA>GCaMP3, c739>shits1 flies. αβ′: blocking α′β′ neurons does not affect odor responses in mb247-LexA>GCaMP3, R35B12>shits1 flies. γ: blocking γ neurons does not affect odor responses in mb247-LexA>GCaMP3, R64C08>shits1 flies. (b) Bar graphs summarizing data from (a). n, left to right, given as number of brain hemispheres [number of flies]: All: 16 [15], 11 [6], 17 [16], 11 [6], 11 [6]. None: 11 [10], 9 [7], 11 [10], 9 [7], 9 [7]. αβ: 16 [9], 15 [8], 16 [9], 15 [8], 15 [8]. αβ′: 13 [8] (all). γ: 11 [6] (all). * P<0.05, ** P<0.01, *** P<0.001, repeated-measures ANOVA with Geisser-Greenhouse correction and Holm-Sidak multiple comparisons test or Friedman test with Dunn’s multiple comparisons test, as appropriate. (c) Ratios of odor-evoked Ca2+ influx at 32 °C vs. 22 °C for data in (a–b). * P<0.05, ** P<0.01, *** P<0.001, Kruskal-Wallis ANOVA with post hoc Mann-Whitney U tests using Holm-Bonferroni multiple comparisons correction. Error bars show s.e.m. See Supplementary Table 1 for full genotypes.
Figure 3
Figure 3. Kenyon cells activate APL
(a,b) Thermal activation of Kenyon cells induces Ca2+ influx into APL in GH146>GCaMP3, mb247-LexA>dTRPA1 flies (a) and synaptic vesicle release from APL in GH146>spH, mb247-LexA>dTRPA1 flies (b). Red traces show ΔF/F; black trace show temperature. (c, d) ΔF/F of GCaMP3 (c) and spH (d) as functions of temperature; each trace represents one fly. Each red trace forms a loop: in mb247-LexA>dTRPA1 flies, ΔF/F rises as the fly is heated, and falls along a different trajectory as the fly is cooled (n=5). Heat does not induce Ca2+ influx in GH146>GCaMP3, dTRPA1/+ flies or vesicle fusion in GH146>spH, dTRPA1/+ flies (blue traces; GCaMP3: n=4; spH: n=5). ** P<0.01, unpaired Welch t-test, comparing the maximum ΔF/F (between 30 °C and the temperature maximum) between mb247-LexA>dTRPA1 and control flies. Mean ± s.e.m.: GCaMP3, mb247-LexA>dTRPA1, 1.90 ± 0.44; GCaMP3, dTRPA1/+, −0.27 ± 0.05; spH, mb247-LexA>dTRPA1, 0.68 ± 0.09; spH, dTRPA1/+, 0.06 ± 0.007. (e) Temperature block of transmission from Kenyon cells blocks odor-evoked APL responses in GH146>GCaMP3, mb247-LexA>shits1 flies (right) but not in GH146>GCaMP3, shits1/+ flies (left). *** P<0.001, repeated-measures ANOVA with Geisser-Greenhouse correction and Holm-Sidak multiple comparisons test. n=8, 9. § P<0.01, Mann-Whitney U test, comparing ratios of odor-evoked Ca2+ influx at 32 °C vs. 22 °C between control and mb247-LexA>shits1 flies. Black bars indicate 5 s pulses of ethyl acetate. Schematics on top indicate which neuron is imaged (green) and which connection is being manipulated (red arrow for dTRPA1 activation, red X for shits1 blockade). See Supplementary Table 1 for full genotypes.
Figure 4
Figure 4. APL inhibits Kenyon cells
(a–c) Stochastic transgene expression in neither (a), one (b), or both (c) APL neurons. Scale bars, 50 μm. (d–g) Impact of different APL manipulations on odor-evoked Ca2+ influx in the α lobe (see Supplementary Fig. 3 for all lobes). Black bars indicate 5 s pulses of ethyl acetate. (d) In control hemispheres of APL>shits1 flies where APL was unlabeled, odor-evoked Ca2+ influx in Kenyon cells declined slightly at 32 °C. (e) In hemispheres of APL>dTRPA1 flies where APL was labeled, odor-evoked Ca2+ influx in Kenyon cells was almost completely abolished at 32 °C. (f) In hemispheres of APL>shits1 flies where APL was labeled, odor-evoked Ca2+ influx in Kenyon cells increased greatly at 32 °C. (g) In APL-labeled hemispheres of APL>TeTx flies (red), odor-evoked Ca2+ influx in Kenyon cells was much higher than in APL-labeled hemispheres of APL>TeTx-inactive flies (blue) and APL-unlabeled hemispheres of APL>TeTx flies (green, lower panel). n, left to right, given as number of brain hemispheres [number of flies]: (d) n=24 [17.] (e) n=9 [5]. (f) n=30 [21]. (g) n=9 [7], 10 [8], 7 [6].* P<0.05, ** P<0.01, *** P<0.001, repeated-measures ANOVA with Geisser-Greenhouse correction and Holm-Sidak multiple comparisons test (d,e), Friedman test with Dunn’s multiple comparisons test (f), or one-way ANOVA with Tukey-Kramer post hoc test (g). § P<0.001, Mann-Whitney U test, comparing ratios of odor-evoked Ca2+ influx at 32 °C vs. 22 °C. See Supplementary Table 1 for full genotypes.
Figure 5
Figure 5. Inhibition keeps Kenyon cell responses sparse and distinct
(a, b) Pseudocolored activity maps of odor responses in Kenyon cell somata, overlaid on grayscale images of baseline fluorescence. Color-coded matrices represent pairwise correlations between response maps to 7 odors: 1) ethyl acetate, 2) 3-octanol, 3) butyl acetate, 4) isoamyl acetate, 5) ethyl butyrate, 6) 2-pentanol, 7) 4-methylcyclohexanol. Scale bars, 10 μm. (a) Left: mb247-LexA>GCaMP3, at 22 °C and 32 °C. Center: mb247-LexA>GCaMP3,shits1, at 22 °C and 32 °C. Right: OK107>TeTx-inactive and OK107>TeTx. (b) Left: APL>shits1, APL unlabeled, at 22 °C and 32 °C. Center: APL>shits1, APL labeled, at 22 °C and 32 °C. Right: APL>TeTx-inactive and APL>TeTx, APL labeled. (c) Population sparseness in a and b decreases when Kenyon cell or APL synaptic output is blocked. (d) Mean inter-odor correlations in a and b increase when Kenyon cell or APL synaptic output is blocked. n, left to right, given as number of brain hemispheres [number of flies]: 7, 9, 9, 8, 7 [7], 8 [7], 9 [7], 9 [7]. Schematics indicate which neurons are being imaged (green) and which connection is being manipulated (red X indicates shits1 blockade). (e) Temperature-dependent changes in sparseness and correlation differ between mb247-LexA>GCaMP3 and mb247-LexA>GCaMP3,shits1 flies (left) and between APL-unlabeled and APL-labeled hemispheres of APL>shits1 flies (right). * P<0.05, ** P<0.01, *** P<0.001, unpaired Welch t-test or repeated-measures ANOVA with Geisser-Greenhouse correction and Holm-Sidak multiple comparisons test as appropriate (lines connecting dots indicate repeated measures); APL>shits1 labeled’ in c used Friedman test with Dunn’s multiple comparisons test. See Supplementary Table 1 for full genotypes.
Figure 6
Figure 6. APL sparsens and decorrelates Kenyon cell responses
(a) Ratios of odor-evoked Ca2+ influx at 32 °C vs. 22 °C in the α′ (top) and α (bottom) lobes, for δ-decalactone (δ-DL), isoamyl acetate:ethyl butyrate (IA:EB) 1:4, and IA:EB 4:1, in hemispheres where the APL neuron was unlabeled (n=6–7 [5]) or labeled (n=12 [8]) with shits1. n given as number of brain hemispheres [number of flies]. See Supplementary Fig. 4 for original ΔF/F traces. * P<0.05, ** P<0.01, *** P<0.001, Friedman test with Dunn’s multiple comparisons test (top) or repeated-measures ANOVA with Geisser-Greenhouse correction and Holm-Sidak multiple comparisons test (bottom) for paired data; Bonferroni-corrected unpaired Welch t-test or Mann-Whitney U test for unpaired data, as appropriate. (b) Activity maps of odor responses in Kenyon cell bodies. Scale bars, 10 μm. (c) Population sparseness of activity maps in response to δ-DL, IA:EB 1:4, and IA:EB 4:1, at 22 °C (blue) and 32 °C (red). Blocking APL decreases sparseness only for IA:EB mixtures. (d) Correlations between activity maps for IA:EB 4:1 vs. δ-DL and IA:EB 1:4, at 22 °C (blue) and 32 °C (red). Blocking APL increases correlations only between IA:EB mixtures. (c–d) * P<0.05, *** P<0.001, Wilcoxon signed-rank test. (e) Temperature-dependent decrease in sparseness is greater for IA:EB mixtures than for δ-DL within APL-labeled hemisphere of APL>shits1 flies, and greater for IA:EB mixtures in APL-labeled than APL-unlabeled hemispheres of APL>shits1 flies. *** P<0.001, Mann-Whitney U test (labeled vs. unlabeled) or Friedman test with Dunn’s multiple comparisons test (comparisons between odors). (f) Temperature-dependent increase in correlation is greater for IA:EB mixtures than for IA:EB 4:1 vs. δ-DL within APL-labeled hemispheres of APL>shits1 flies (n=20 [13]), and greater for IA:EB mixtures in APL-labeled than APL-unlabeled hemispheres of APL>shits1 flies (n=10 [9]). * P<0.05, unpaired Welch t-test (between samples) and paired t-test (within samples).
Figure 7
Figure 7. Feedback inhibition facilitates learned discrimination of similar, but not dissimilar, odors
(a) Schematic of training paradigm. See text for details. (b) Individual odor preferences before and after training. Fly position within the chamber (horizontal dimension) is plotted against time (vertical dimension). Maximum intensity projections of confocal image stacks show example APL>shits1,GFP brains with none or both APL neurons labeled. Scale bars, 50 μm. (c) Performance of APL>shits1,GFP flies sorted according to whether neither or both APL neurons were labeled. Scores are plotted as change in the proportion of time spent in CS− after training. n, left to right, given as number of flies [number of experiments]: 23 [6], 26 [6], 16 [7], 44 [7], 18 [8], 55 [8], 32 [9], 51 [9]. ** P<0.01, *** P<0.001, Kruskal-Wallis ANOVA with Holm-Bonferroni correction for post hoc tests, testing only pairs of data points with one variable changed (task, temperature, or APL labeling). P<0.01, 3-way ANOVA for interaction of task, temperature, and APL labeling. P<0.005, 2-way ANOVA for interaction of genotype and temperature for discrimination of similar odors. P<0.01, 2-way ANOVA for interaction of task and APL labeling at 32 °C. P<0.05, 2-way ANOVA for interaction of task and temperature for flies with both APL neurons labeled. Other 2-way ANOVAs did not reveal significant interactions. Error bars show s.e.m.
Figure 8
Figure 8. Partial effect of APL-specific RNAi of GABA biosynthesis
(ad) See grid at bottom for full genotypes. (a,b) α′ (a) and α lobe (b) responses to IA:EB mixtures (averages of responses to 1:4 and 4:1). n, left to right, given as number of brain hemispheres [number of flies]: 7 [5], 12 [8], 11 [10], 15 [12], 7, 6, 6, 6. (c,d) Population sparseness (c) and correlations of cell body responses to IA:EB mixtures (averages of responses to 1:4 and 4:1). n, left to right, given as number of brain hemispheres [number of flies]: 11 [9] (10 [9] in (d), 21 [14], 11 [10], 15 [12], 10, 10, 6, 6. (e) Sample activity maps of cell body responses analyzed in panels c and d. Compare to Fig. 5b. Scale bars, 10 μm. * P<0.05, ** P<0.01, *** P<0.001 significant difference between colored bars and relevant controls (gray bars), by unpaired Welch t-test for APL>shits1 and APL>GADRNAi (Mann-Whitney U test for APL>shits1 in d), and by one-way ANOVA and Dunnett’s multiple comparisons test for GH146-GAL4 and NP2631-GAL4 driving GADRNAi. § P<0.05 significant difference between effects of GADRNAi and APL>shits1 by 2-way ANOVA. Error bars show s.e.m.

References

    1. Kanerva P. Sparse distributed memory. MIT Press; 1988.
    1. Marr D. A theory of cerebellar cortex. J Physiol (Lond) 1969;202:437–470. - PMC - PubMed
    1. Albus JS. A theory of cerebellar function. Math Biosci. 1971;10:25–61.
    1. Treves A, Rolls ET. What determines the capacity of autoassociative memories in the brain? Network. 1991;2:371–397.
    1. Vinje WE, Gallant JL. Sparse coding and decorrelation in primary visual cortex during natural vision. Science. 2000;287:1273–1276. - PubMed

Publication types

MeSH terms

Substances

LinkOut - more resources