. 2014 Jan 15;39(2):275-8.
doi: 10.1364/OL.39.000275.

Correction of depth-dependent aberrations in 3D single-molecule localization and super-resolution microscopy

Correction of depth-dependent aberrations in 3D single-molecule localization and super-resolution microscopy

Ryan McGorty et al. Opt Lett. .

Abstract

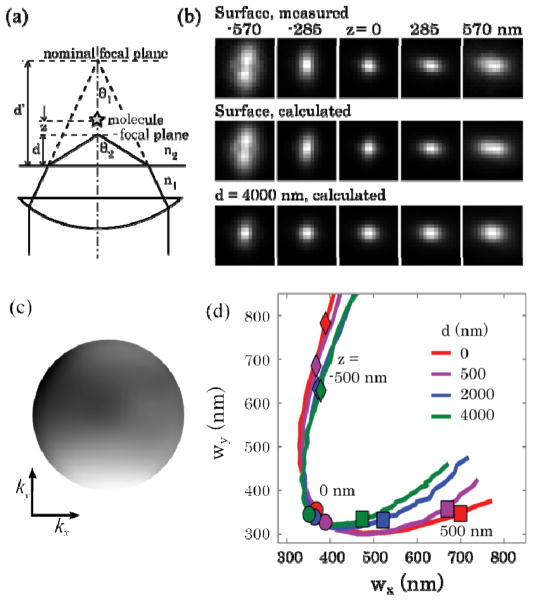
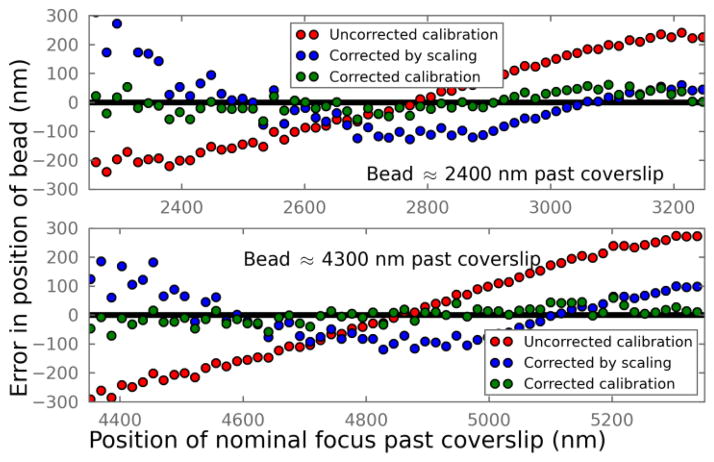
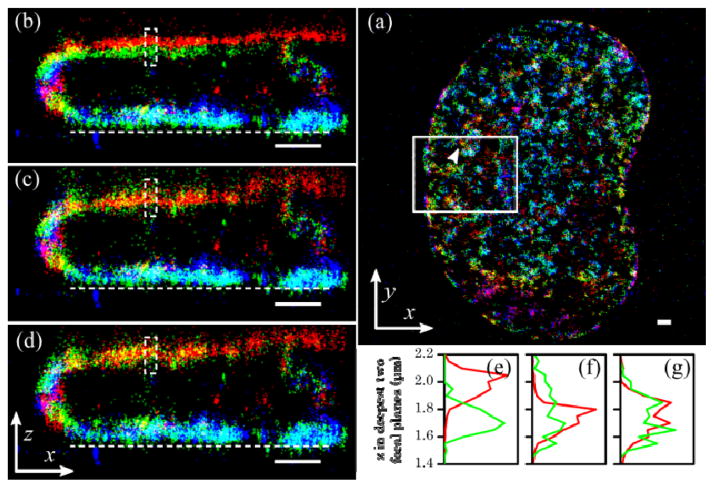
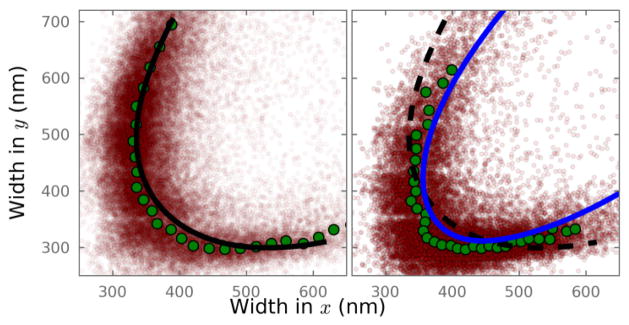
Single-molecule switching based super-resolution microscopy techniques have been extended into three dimensions through various 3D single-molecule localization methods. However, the localization accuracy in z can be severely degraded by the presence of aberrations, particularly the spherical aberration introduced by the refractive index mismatch when imaging into an aqueous sample with an oil immersion objective. This aberration confines the imaging depth in most experiments to regions close to the coverslip. Here we show a method to obtain accurate, depth-dependent z calibrations by measuring the point spread function (PSF) at the coverslip surface, calculating the microscope pupil function through phase retrieval, and then computing the depth-dependent PSF with the addition of spherical aberrations. We demonstrate experimentally that this method can maintain z localization accuracy over a large range of imaging depths. Our super-resolution images of a mammalian cell nucleus acquired between 0 and 2.5 μm past the coverslip show that this method produces accurate z localizations even in the deepest focal plane.


Figures

Fig. 1
Fig. 1
Correction to the depth-induced aberrations in z localization calibration. (a) Scheme of aberrations induced by refractive-index mismatch. (2) The phase retrieval algorithm used images of a 100 nm fluorescent bead at various amounts of defocus. Five of those images are shown where the z separation between each image is 285 nm. The position of the nominal focus is set to z = 0. The computed PSFs using the retrieved PF at the surface and when the emitter is physically 4 μm past the coverslip are displayed. (c) The phase of the PF obtained through the iterative phase retrieval process. The outer edge of the PF corresponds to the highest spatial frequency measured, k = 2 μm−1. (d) Calibration curves determined from computed PSFs at different depths past the coverslip into a medium with refractive index of 1.34. The points on the curves labeled with a circle correspond the nominal focus of the emitter, z = 0. The diamonds and rectangles label where the emitter is at z = −500 nm and 500 nm, respectively.
Fig. 2
Fig. 2
Error in determined z positions of agarose-embedded beads that are physically about 2400 nm and 4300 nm past the coverslip. The difference between the calculated and the actual z positions of the beads are plotted. Red: directly using the uncorrected calibration curve acquired at the surface; Blue: after scaling the z coordinates as described in [12]; Green: using calculated, aberration-corrected calibration curves at the corresponding depths.
Fig. 3
Fig. 3
STORM image of labeled DNA in a PtK2 cell. STORM images were taken at six focal planes, each nominally separated by 500 nm. All scale bars are 1 μm in all dimensions shown. (a) The xy projection of the entire data set. (b–d) The xz projection of the solid boxed area in (a). The z coordinates are calculated with (b) uncorrected calibration, (c) after z-scaling [12], and (d) corrected calibration curves of each focal plane. The dashed line in (b–d) is the approximate position of the the coverslip surface. Each color corresponds to one the six focal planes from 0 to 2500 nm past the coverslip (blue-green-red-blue-green-red). (e-g) show the z distribution of molecules in the deepest two focal planes (red being the deepest) indicated by the arrowhead in (a) and within the dashed boxes in (b–d), respectively.
Fig. 4
Fig. 4
Plot of wx, wy for individual molecules recorded at two of the six focal planes shown in Fig. 3. (a) Data acquired at the focal plane closest to the coverslip. The black line is the z-calibration curve acquired using 100 nm beads at the coverslip. (b) Data acquired at a nominal focal position 2 μm beyond the coverslip. The dashed black line is the calibration curve from (a). The blue line is the corrected calibration curve taking into account the depth-dependent aberration. Plotted in green are the smoothed wx, wy coordinates from the measured red dots.

References

    1. Hell SW. Microscopy and its focal switch. Nature Methods. 2009;6:24–32. - PubMed
    1. Huang B, Babcock H, Zhuang X. Breaking the Diffraction Barrier: Super-Resolution Imaging of Cells. Cell. 2010;143:1047–1058. - PMC - PubMed
    1. Betzig E, Patterson GH, Sougrat R, Lindwasser OW, Olenych S, Bonifacino JS, Davidson MW, Lippincott-Schwartz J, Hess HF. Imaging Intracellular Fluorescent Proteins at Nanometer Resolution. Science. 2006;313:1642–1645. - PubMed
    1. Hess ST, Girirajan TPK, Mason MD. Ultra-High Resolution Imaging by Fluorescence Photoactivation Localization Microscopy. Biophysical Journal. 2006;91:4258–4272. - PMC - PubMed
    1. Rust MJ, Bates M, Zhuang X. Sub-diffraction-limit imaging by stochastic optical reconstruction microscopy (STORM) Nature Methods. 2006;3:793–796. - PMC - PubMed

Publication types