. 2014 Apr;15(4):354-364.
doi: 10.1038/ni.2830. Epub 2014 Feb 23.

Innate lymphoid cells integrate stromal and immunological signals to enhance antibody production by splenic marginal zone B cells

Affiliations

Innate lymphoid cells integrate stromal and immunological signals to enhance antibody production by splenic marginal zone B cells

Giuliana Magri et al. Nat Immunol. 2014 Apr.

Abstract

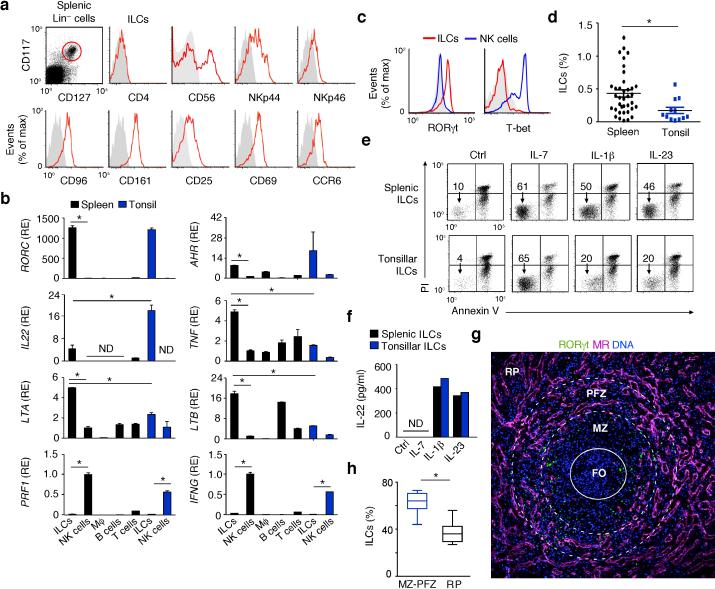
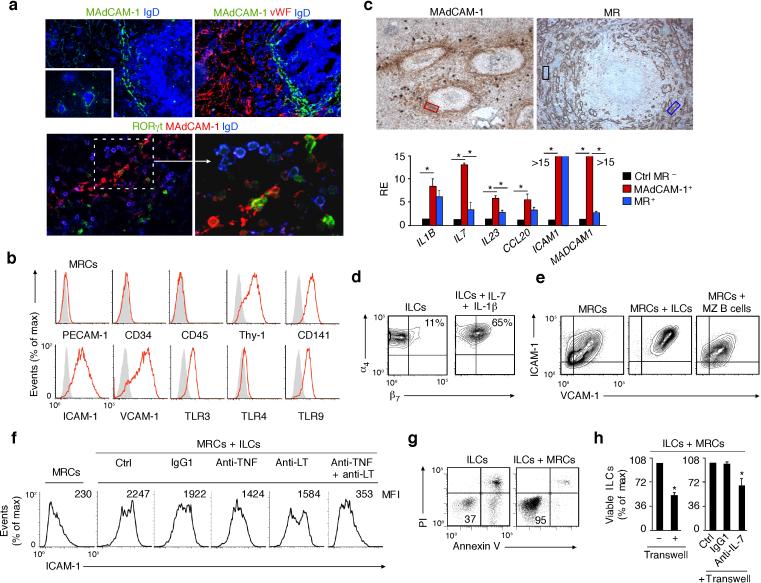
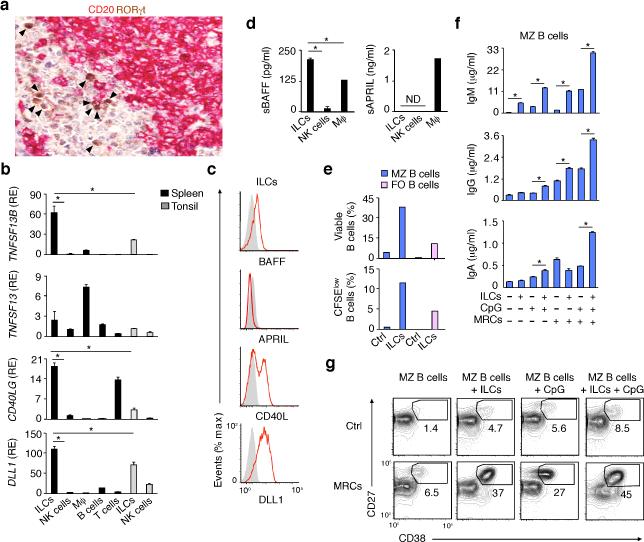
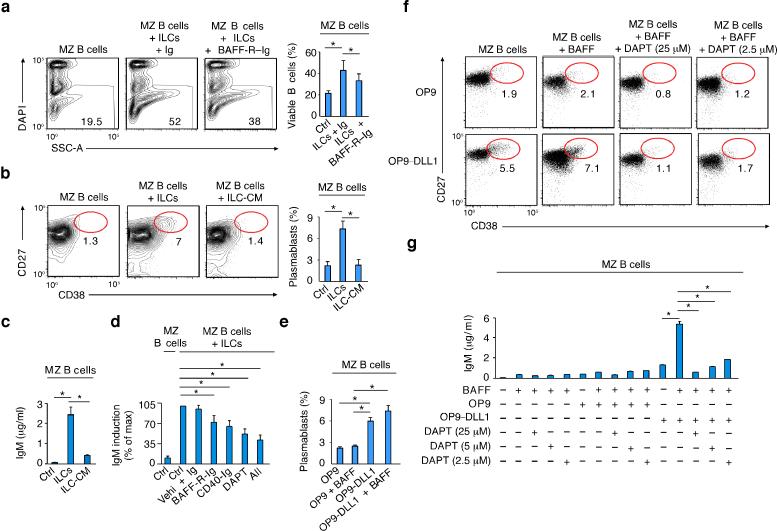
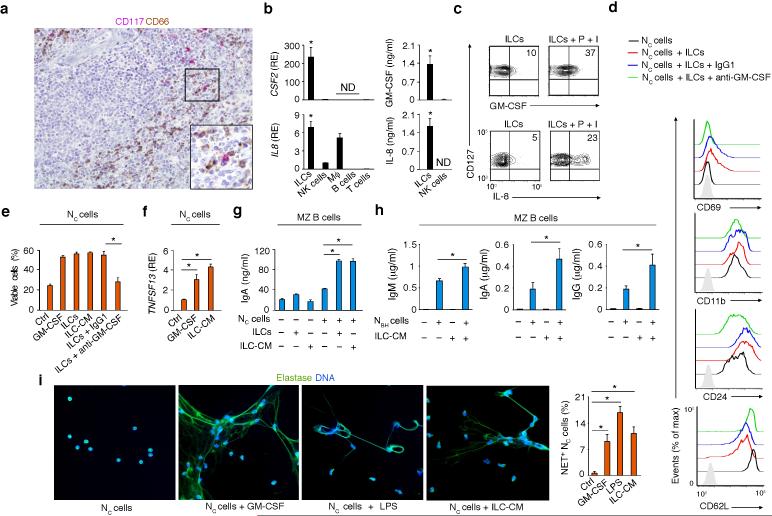
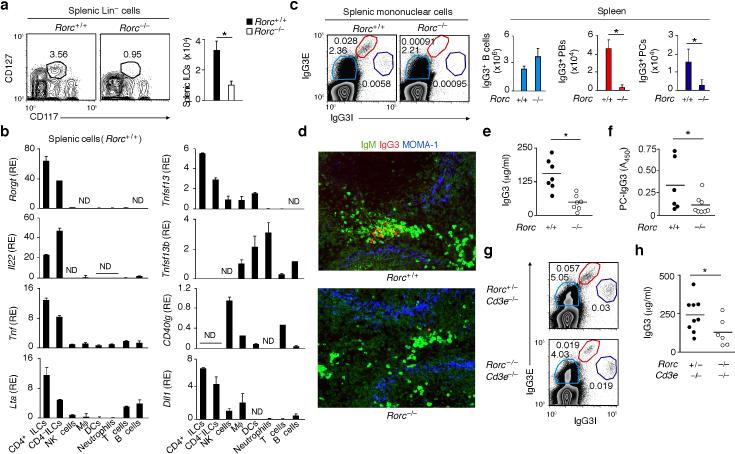
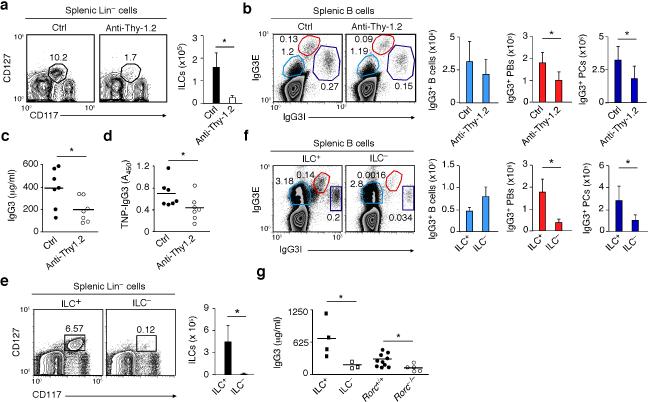
Innate lymphoid cells (ILCs) regulate stromal cells, epithelial cells and cells of the immune system, but their effect on B cells remains unclear. Here we identified RORγt(+) ILCs near the marginal zone (MZ), a splenic compartment that contains innate-like B cells highly responsive to circulating T cell-independent (TI) antigens. Splenic ILCs established bidirectional crosstalk with MAdCAM-1(+) marginal reticular cells by providing tumor-necrosis factor (TNF) and lymphotoxin, and they stimulated MZ B cells via B cell-activation factor (BAFF), the ligand of the costimulatory receptor CD40 (CD40L) and the Notch ligand Delta-like 1 (DLL1). Splenic ILCs further helped MZ B cells and their plasma-cell progeny by coopting neutrophils through release of the cytokine GM-CSF. Consequently, depletion of ILCs impaired both pre- and post-immune TI antibody responses. Thus, ILCs integrate stromal and myeloid signals to orchestrate innate-like antibody production at the interface between the immune system and circulatory system.


Figures

Figure 1
Figure 1. Human splenic ILCs express a mucosa-like group-3 phenotype and occupy MZ and perifollicular areas
(a) Flow cytometry of CD4, CD25, CD56, CD69, CD96, CD161, NKp44, NKp46 and CCR6 on splenic LinCD117+CD127+ ILCs (red gate). Gray shading, negative control. (b) qRT-PCR of RORC (RORγt), AHR (AhR), IL22 (IL-22), TNF (TNF), LTA (LT-α), LTB (LT-β), PRF1 (Perforin-1) and IFNG (IFN-γ) mRNAs from splenic or tonsillar ILCs and NK cells and from splenic macrophages (Mϕ), B cells and T cells. Results are normalized to ACTB (β-actin) mRNA and presented as relative expression (RE) compared with that of fresh splenic NK cells. Error bars, s.e.m.; *P <0.05 (two-tailed unpaired Student's t test). (c) Flow cytometry of intracellular RORγt and T-bet in splenic ILCs (red lines) and NK cells (blue lines). (d) Flow cytometry of LinCD117+CD127+ ILCs in splenic and tonsillar lymphocytes. *P < 0.05 (Mann-Whitney U-test). (e) Flow cytometric analysis of frequency of viable Annexin-Vpropidium iodide (PI) ILCs after culture of splenic and tonsillar ILCs with medium alone (Ctrl), IL-1β, IL-7 or IL-23 for 72 h. (f) ELISA of IL-22 from splenic and tonsillar ILCs cultured as in (e). (g) IFA of spleen stained for MR (purple), RORγt (green) and DNA-binding 4’-6-diamidine-2’-phenylindole (DAPI; blue). RP, red pulp. Original magnification, ×10. FO: center of the follicle (h) Immunohistochemical quantification of CD117+Tryptase ILCs from MZ-PFZ and red pulp (RP) areas in nine microscopic ×20 fields from two spleens. *P< 0.05 (Wilcoxon Matched-pairs signed Rank test). Data summarize three measurements from three pooled experiments with 1 donor in each (spleen and tonsil) (b), display values from thirty seven spleens and twelve tonsils (d), or show one of four experiments with similar results (a,c,e,f,g).
Figure 2
Figure 2. Human splenic ILCs establish a bidirectional crosstalk with MRCs
(a) IFA of spleens stained for MAdCAM-1 (green or red), IgD (blue), vWF (red) and/or RORγt (green). Original magnification, ×40 (upper panels), ×10 (upper inset) and ×63 (bottom-left panel) and zoom ×2 (bottom-right panel). (b) Flow cytometry of PECAM-1, CD34, CD45, Thy-1, CD141, ICAM-1, VCAM-1, TLR3, TLR4 and TLR9 expression by ex vivo expanded MRCs. Gray shading, negative control. (c) qRT-PCR of IL1B (IL-1β), IL7 (IL-7), IL23 (IL-23), CCL20 (CCL20), ICAM1 (ICAM-1) and MADCAM1 (MadCAM-1) mRNAs in MadCAM-1+ MRC-enriched (red box), MR+ SLC-enriched (blue box) and control (ctrl) MR (black box) areas microdissected from immunohistochemically stained splenic tissue (original magnification, ×20). qRT-PCR results are normalized to ACTB (β-actin) mRNA and presented as relative expression (RE) compared with that of MR areas. (d) Flow cytometry of integrins α4 and β7 on freshly isolated splenic ILCs (left) or ILCs cultured with IL-1β and IL-7 for 72 h (right). (e,f) Flow cytometry of ICAM-1 and VCAM-1 on MRCs incubated for 72 h with or without ILCs in the presence or absence of control (Ctrl), anti-TNF, anti-LTαβ or anti-TNF plus anti-LTαβ antibodies. (g,h) Flow cytometric analysis of frequency of Annexin-Vpropidium iodide ILCs from splenic ILCs cultured for 72 h with or without MRCs in the presence of absence of a transwell, a control (Ctrl) antibody or anti-IL-7. Error bars, s.e.m.; *P <0.05 (two-tailed unpaired Student's t test). Data summarize three experiments with one donor in each (c,h) or show one of four experiments with similar results (a,b,d,e,f,g).
Figure 3
Figure 3. Human splenic ILCs express the MZ B cell-helper factors BAFF, CD40L and DLL1 and activate MZ B cells in cooperation with MRCs
(a) IHC of spleen stained for RORγt (brown) and CD20 (purple). Arrowheads point to RORγt+ cells. Original magnification, ×40. (b) qRT-PCR of TNFSF13B (BAFF), TNFSF13 (APRIL), CD40LG (CD40L) and DLL1 (DLL1) mRNAs from splenic or tonsillar ILCs and NK cells and from splenic macrophages (Mϕ), B cells and T cells. Results are normalized to ACTB (β-actin) mRNA and presented as relative expression (RE) compared with that of fresh splenic NK cells. (c) Flow cytometry of BAFF, APRIL, CD40L and DLL1 on splenic ILCs exposed to IL-1β plus IL-7 for 72 h. Gray shading, negative control. (d) ELISA of soluble BAFF and APRIL from splenic ILCs and NK cells cultured as in (c) as well as Mϕ. (e) Flow cytometric analysis of the frequency of viable Annexin-Vpropidium iodide (PI) and divided carboxyfluorescein diacetate succinimidyl ester (CFSE)low splenic MZ (blue bars) and FO (pink bars) B cells after incubation with medium alone (ctrl) or ILCs for 5 d. (f) ELISA of IgM, IgG and IgA from splenic MZ B cells incubated for 5 d with medium alone (Ctrl), ILCs, MRCs and/or CpG. (g) Frequency of CD27hiCD38hi plasmablasts in splenic MZ B cells cultured for 5 d as in (f). Error bars, s.e.m.; *P <0.05 (two-tailed unpaired Student's t test). Data summarize 3 measurements from 3 pooled experiments with one donor in each (b,d) or show one of three experiments with similar results (a,c,e,f with s.e.m of triplicate, g).
Figure 4
Figure 4. Human splenic ILCs help MZ B cells via BAFF, CD40L and DLL1
(a,b) Flow cytometric analysis of the frequency of viable DAPI MZ B cells from MZ B cells cultured for 5 d with or without splenic ILCs in the presence or absence of control Ig or BAFF-R-Ig. SSC-A, side scatter area. (b) Frequency of CD27hiCD38hi plasmablasts from splenic MZ B cells cultured for 5 d with or without splenic ILCs or ILC conditioned medium (ILC-CM). (c) ELISA of IgM from splenic MZ B cells cultured as in (b). (d) ELISA of IgM from splenic MZ B cells cultured for 5 days with medium alone (Ctrl) or ILCs in the presence or absence of control Ig and dimethyl sulfoxide vehicle (Vehi), BAFF-R-Ig, CD40-Ig, N-[N-(3,5-difluorophenacetyl)-L-alanyl]-S-phenylglycine t-butyl ester (DAPT, a NOTCH inhibitor) or a combination of BAFF-R-Ig plus CD40-R-Ig plus DAPT (All). Summary of data from 7 donors shown as % of maximal induction (100%) after MZ B cell stimulation with ILCs and control vehicle (Vehi). (e) Frequency of CD27hiCD38hi plasmablasts from splenic MZ B cells cultured for 5 days with control OP9 cells or DLL1-OP9 cells in the presence or absence of BAFF. (f) Frequency of CD27hiCD38hi plasmablasts from splenic MZ B cells cultured for 5 d with or without control (ctrl) OP9 cells or DLL1-OP9 cells in the presence or absence of BAFF and/or DAPT. (g) ELISA of IgM from splenic MZ B cells cultured as in (e). Error bars, s.e.m.; *P <0.05 (two-tailed unpaired Student's t test). Data summarize four (a), three (b,c,e) and seven (d) experiments with one donor in each or show one of three experiments with similar results (f, g with s.e.m of triplicate).
Figure 5
Figure 5. Human splenic ILCs activate MZ B cell-helper neutrophils via GM-CSF
(a) IHC of spleen stained for CD117 (red) and CD66 (brown). Original magnification, ×20 or ×40 (inset). (b) Left: qRT-PCR of CSF2 (GM-CSF) and IL8 (IL-8) mRNAs from splenic ILCs, NK cells, macrophages (Mϕ), B cells and T cells. CSF2 and IL8 data are normalized to ACTB (β-actin) mRNA and presented as relative expression (RE) compared with that of fresh splenic NK cells. Right: ELISA of GM-CSF and IL-8 from splenic ILCs and NK cells cultured for 48 h with IL-1β and IL-7. (c) Flow cytometry of intracellular GMCSF and IL-8 in splenic CD127+ (LinCD117+) ILCs activated with or without PMA (P) plus ionomycin (I) for 4 h. (d) Flow cytometry of CD69, CD11b, CD24 and CD62L on Nc cells cultured for 24 h with or without splenic ILCs in the presence or absence of control IgG1 or blocking anti-GM-CSF antibodies. Gray shading: isotype control. (e) Flow cytometry of viable DAPI Nc cells cultured with medium alone (Ctrl), GM-CSF, ILCs or ILC-derived conditioned medium (ILC-CM) in the presence or absence of IgG1 or anti-GM-CSF antibodies. (f) qRT-PCR of TNFSF13 (APRIL) mRNA from Nc cells cultured for 24 h with medium alone (Ctrl), GM-CSF or ILC-CM. Results are normalized to ACTB mRNA and presented as RE compared with that of Nc cells cultured with medium alone. (g) ELISA of IgA from splenic MZ B cells cultured for 5 d with or without Nc cells, ILCs and/or ILC-CM. (h) ELISA of IgM, IgA and IgG from splenic MZ B cells cultured for 5 d with or without NBH cells, ILC-CM and/or NBH cells preconditioned with ILC-CM. (i) IFA of elastase (green) and DAPI-stained DNA (blue) in Nc cells cultured for 3 h either with medium alone (Ctrl), GM-CSF, ILC-CM or LPS (original magnification, ×63) and quantification of NET-forming Nc cells from nine ×10 fields from two independent experiments. Error bars, s.e.m.; *P <0.05 (two-tailed unpaired Student's t test). Data summarize 2-3 experiments with one donor in each (b,e,f,g,h,i) or show one of four experiments with similar results (a,c,d).
Figure 6
Figure 6. Mouse splenic ILCs express the plasma cell-helper factors APRIL and DLL1 and enhance TI IgG3 responses
(a) Flow cytometric analysis of frequency and absolute numbers of splenic Lin CD117+CD127+ ILCs from Rorc+/+ (n = 3) and Rorc–/– mice (n = 3). (b) qRT-PCR of Rorc (RORγt) Il22 (IL-22) Tnf (TNF), Lta (LT-α), Tnfsf13 (APRIL), Tnfsf13b (BAFF), CD40lg (CD40L) and Dll1 (DLL1) mRNAs from splenic ILCs, macrophages (Mϕ), DCs, neutrophils, NK cells, T cells or B cells. Results are normalized to Gapdh (glyceraldehyde 3-phosphate dehydrogenase) mRNA and presented as relative expression (RE) compared to the expression level in NK cells. (c) Flow cytometric analysis of frequency and absolute numbers of splenic IgG3E+IgG3Ilo B cells, IgG3EhiIgG3I+ plasmablasts (PBs) and IgG3E+IgG3Ihi plasma cells (PCs) from Rorc+/+ (n = 3) and Rorc–/– mice. E, extracellular; I, intracellular. (d) IFA of IgM (green), IgG3 (red) and MOMA-1 (blue) in spleens from Rorc+/+ and Rorc–/– mice. Original magnification, ×20. (e,f) ELISA of total (e) and PC-reactive (f) serum IgG3 from Rorc+/+ (n = 6-7) and Rorc–/– (n = 7-8) mice. (g) Frequency of IgG3-expressing B cells, PBs and PCs from spleens of Rorc+/–Cd3e–/– and Rorc–/–Cd3e–/– mice. (h) Serum IgG3 from Rorc+/–Cd3e–/– (n = 9) and Rorc–/–Cd3e–/– (n = 6) mice. Error bars, s.e.m. (b), s.d. (a,c); *P <0.05 (one-tailed unpaired Student's t test). Data show one of four experiments with similar results (a,d,g; c: cytograms) or summarize results from 3-8 animals per each group (a,c: bars; b,e,f,h).
Figure 7
Figure 7. Mouse splenic ILCs help plasmablasts and plasma cells emerging from TI IgG3 responses
(a) Flow cytometric analysis of frequency and absolute numbers of splenic LinCD117+CD127+ ILCs from Thy-1-disparate chimeric Rag1–/– mice treated with control (ctrl) (n = 7) or anti-Thy.1.2 antibodies (n = 7). (b) Frequency and absolute numbers of splenic IgG3E+IgG3Ilo B cells, IgG3EhiIgG3I+ plasmablasts (PBs) and IgG3EIgG3Ihi plasma cells (PCs) from Ctrl or ILC-depleted mice obtained as in (a). E, extracellular; I, intracellular. (c,d) ELISA of pre-immune total (c) and PC-reactive (d) serum IgG3 from Ctrl or ILC-depleted mice obtained as in (a). (e,f) Frequency and absolute numbers of splenic Lin CD117+CD127+ ILCs (e) and IgG3-expressing splenic B cells, PBs and PCs (f) from ILC+ (n = 3) or ILC (n = 3) bone marrow chimeric mice. (g) Pre-immune total serum IgG3 from ILC+ (n = 4) and ILC (n = 3) mice, age-matched Rorc+/+ mice (n = 10), and Rorc–/– mice (n = 5). Error bars, s.d.; *P <0.05 (one-tailed unpaired Student's t test). Data show one of four experiments with similar results (a,b,e,f: cytograms) or summarize results from 3-10 animals per each group (a,b,e,f: bars; c,d,g).
Figure 8
Figure 8. Mouse splenic neutrophils help plasma cells emerging from TI IgG3 responses and receive homeostatic signals from ILCs via GM-CSF
(a) IFA of IgG3 (green), Ly6G (red) and IgM (blue) in spleens from ILC+ or ILC bone marrow chimeric mice. Original magnification, ×20. (b) Flow cytometric analysis of the frequency of splenic Ly6G+CD11b+ neutrophils from ILC+ (n = 3) or ILC (n = 3) mice. (c) Frequency and absolute numbers of splenic Ly6G+CD11b+ neutrophils from ILC+ mice treated with control (Ctrl) (n = 4) or anti-Ly6G antibodies (n = 4). (d,e) Frequency and absolute numbers of splenic LinCD117+CD127+ (d) as well as splenic IgG3E+IgG3Ilo B cells, IgG3EhiIgG3I+ plasmablasts (PBs) and IgG3E+IgG3Ihi plasma cells (PCs) from ILC+ mice treated as in (c). E, extracellular; I, intracellular. (f) ELISA of total serum IgG3 from ILC+ mice treated as in (c). (g) qRT-PCR of Csf2 (GM-CSF) mRNA from splenic ILCs, macrophages (Mϕ), DCs, neutrophils, NK cells, T cells or B cells. Results are normalized to Gapdh (glyceraldehyde 3-phosphate dehydrogenase) mRNA and presented as relative expression (RE) compared to the expression level in NK cells. (h) Frequency and absolute numbers of splenic Ly6G+CD11b+ neutrophils from Csf2+/+ (n = 8) and Cfs2–/– (n = 12) mice before and after transfer of B16Cfs2 cells overexpressing GM-CSF (n = 3). (i) Frequency of splenic neutrophils in ILC-sufficient Rag1–/–Il2rg+/+ mice or ILC-insufficient Rag1–/–Il2rg–/– mice reconstituted or not with gut ILCs from Csf2+/+ or Cfs2–/– mice (n = 3). Error bars, s.e.m. (g-i), s.d. (b-e); *P <0.05 (one-tailed unpaired Student's t test). Data summarize results from at least two experiments with 3 mice in each group (b,c,d,e,h: bars; f,g,i) or show one of at least three experiments with similar results (a and b,c,d,e,h: cytograms).

Comment in

  • Innate lymphoid cells: support for indie B cells.
    Bordon Y. Bordon Y. Nat Rev Immunol. 2014 Apr;14(4):213. doi: 10.1038/nri3644. Epub 2014 Mar 14. Nat Rev Immunol. 2014. PMID: 24625843 No abstract available.
  • ILCs in the zone.
    Victora GD. Victora GD. Nat Immunol. 2014 Apr;15(4):313-4. doi: 10.1038/ni.2854. Nat Immunol. 2014. PMID: 24646589 No abstract available.

Similar articles

Cited by

References

    1. Balázs M, Martin F, Zhou T, Kearney JF. Blood dendritic cells interact with splenic marginal zone B cells to initiate T-independent immune responses. Immunity. 2002;17:341–352. - PubMed
    1. Kang YS, et al. A dominant complement fixation pathway for pneumococcal polysaccharides initiated by SIGN-R1 interacting with C1q. Cell. 2006;125:47–58. - PubMed
    1. Castagnaro L, et al. Nkx2-5(+)islet1(+) mesenchymal precursors generate distinct spleen stromal cell subsets and participate in restoring stromal network integrity. Immunity. 2013;38:782–791. - PMC - PubMed
    1. Cerutti A, Cols M, Puga I. Marginal zone B cells: virtues of innate-like antibody-producing lymphocytes. Nat. Rev. Immunol. 2013;13:118–132. - PMC - PubMed
    1. Yuan JS, Kousis PC, Suliman S, Visan I, Guidos CJ. Functions of notch signaling in the immune system: consensus and controversies. Annu. Rev. Immunol. 2010;28:343–365. - PubMed

Publication types

MeSH terms