

Individual differences in regional prefrontal gray matter morphometry and fractional anisotropy are associated with different constructs of executive function
- PMID: 24562372
- PMCID: PMC4320016
- DOI: 10.1007/s00429-014-0723-y
Individual differences in regional prefrontal gray matter morphometry and fractional anisotropy are associated with different constructs of executive function
Abstract
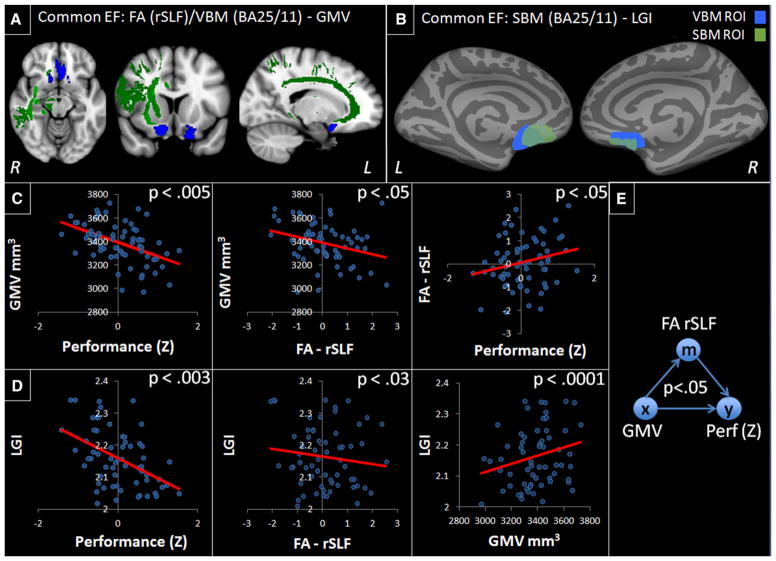
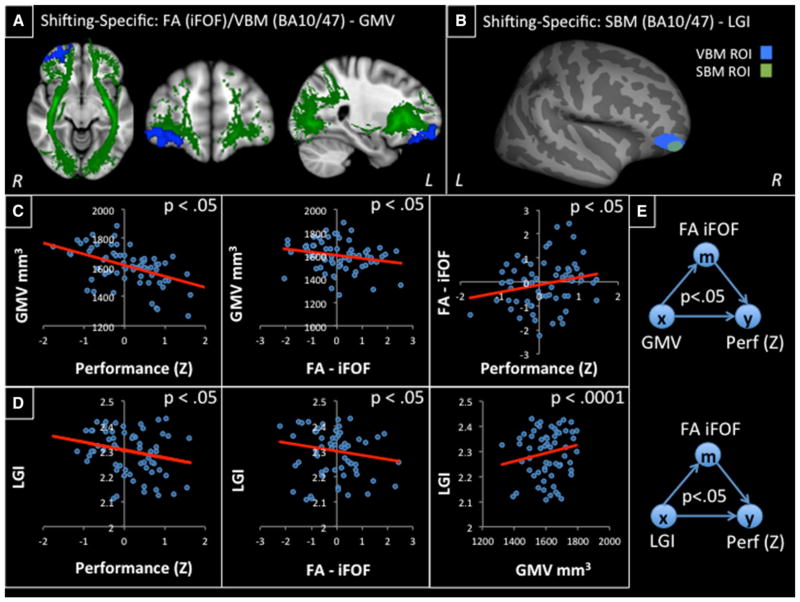
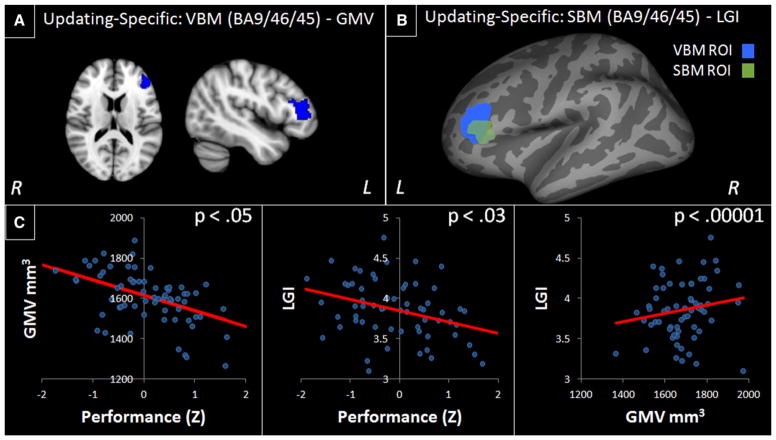
Although the relationship between structural differences within the prefrontal cortex (PFC) and executive function (EF) has been widely explored in cognitively impaired populations, little is known about this relationship in healthy young adults. Using optimized voxel-based morphometry (VBM), surface-based morphometry (SBM), and fractional anisotropy (FA) we determined the association between regional PFC grey matter (GM) morphometry and white matter tract diffusivity with performance on tasks that tap different aspects of EF as drawn from Miyake et al.'s three-factor model of EF. Reductions in both GM volume (VBM) and cortical folding (SBM) in the ventromedial PFC (vmPFC), ventrolateral PFC (vlPFC), and dorsolateral PFC (dlPFC) predicted better common EF, shifting-specific, and updating-specific performance, respectively. Despite capturing different components of GM morphometry, voxel- and surface-based findings were highly related, exhibiting regionally overlapping relationships with EF. Increased white matter FA in fiber tracts that connect the vmPFC and vlPFC with posterior regions of the brain also predicted better common EF and shifting-specific performance, respectively. These results suggest that the neural mechanisms supporting distinct aspects of EF may differentially rely on distinct regions of the PFC, and at least in healthy young adults, are influenced by regional morphometry of the PFC and the FA of major white matter tracts that connect the PFC with posterior cortical and subcortical regions.
Figures
Similar articles
-
Cortical morphometry and structural connectivity relate to executive function and estradiol level in healthy adolescents.Brain Behav. 2019 Dec;9(12):e01413. doi: 10.1002/brb3.1413. Epub 2019 Sep 30. Brain Behav. 2019. PMID: 31568680 Free PMC article.
-
Frontoparietal structural properties mediate adult life span differences in executive function.Sci Rep. 2020 Jun 3;10(1):9066. doi: 10.1038/s41598-020-66083-w. Sci Rep. 2020. PMID: 32494018 Free PMC article.
-
Gray and white matter differences in adolescents and young adults with prior suicide attempts across bipolar and major depressive disorders.J Affect Disord. 2019 Feb 15;245:1089-1097. doi: 10.1016/j.jad.2018.11.095. Epub 2018 Nov 22. J Affect Disord. 2019. PMID: 30699851 Free PMC article.
-
[Voxel-Based Morphometry and Cognitive Function].Brain Nerve. 2017 May;69(5):547-556. doi: 10.11477/mf.1416200781. Brain Nerve. 2017. PMID: 28479532 Review. Japanese.
-
Prefrontal cortex and executive functions in healthy adults: a meta-analysis of structural neuroimaging studies.Neurosci Biobehav Rev. 2014 May;42:180-92. doi: 10.1016/j.neubiorev.2014.02.005. Epub 2014 Feb 23. Neurosci Biobehav Rev. 2014. PMID: 24568942 Free PMC article. Review.
Cited by
-
Transcranial direct current stimulation over the right DLPFC selectively modulates subprocesses in working memory.PeerJ. 2018 May 28;6:e4906. doi: 10.7717/peerj.4906. eCollection 2018. PeerJ. 2018. PMID: 29868292 Free PMC article.
-
Neurocognitive factorial structure of executive functions: Evidence from neurotypicals and frontotemporal dementia.Cortex. 2021 Dec;145:79-96. doi: 10.1016/j.cortex.2021.08.015. Epub 2021 Oct 2. Cortex. 2021. PMID: 34689034 Free PMC article.
-
Negative and interactive effects of sex, aging, and alcohol abuse on gray matter morphometry.Hum Brain Mapp. 2016 Jun;37(6):2276-92. doi: 10.1002/hbm.23172. Epub 2016 Mar 7. Hum Brain Mapp. 2016. PMID: 26947584 Free PMC article.
-
Searching for behavior relating to grey matter volume in a-priori defined right dorsal premotor regions: Lessons learned.Neuroimage. 2017 Aug 15;157:144-156. doi: 10.1016/j.neuroimage.2017.05.053. Epub 2017 May 25. Neuroimage. 2017. PMID: 28552730 Free PMC article.
-
Shared grey matter correlates of reading and attention.Brain Lang. 2023 Feb;237:105230. doi: 10.1016/j.bandl.2023.105230. Epub 2023 Feb 1. Brain Lang. 2023. PMID: 36731345 Free PMC article.
References
-
- Kochunov P, Robin DA, Royall DR, Coyle T, Lancaster J, Kochunov V, Schlosser AE, et al. Can structural MRI indices of cerebral integrity track cognitive trends in executive control function during normal maturation and adulthood? Hum Brain Mapp. 2009;30(8):2581–2594. doi: 10.1002/hbm.20689. - DOI - PMC - PubMed
-
- Amunts K, Schleicher A, Bürgel U, Mohlberg H, Uylings H, Zilles K. Broca’s region revisited: cytoarchitecture and intersubject variability. J Comp Neurol. 1999;412(2):319–341. - PubMed
-
- Andersen S. Trajectories of brain development: point of vulnerability or window of opportunity? Neurosci Biobehav Rev. 2003;27(1–2):3–18. - PubMed
-
- Andersson JLR, Jenkinson M, Smith S. Non-linear optimisation. [Accessed 6 Jan 2013];FMRIB technical report TR07JA1. 2007a http://www.fmrib.ox.ac.uk/analysis/techrep.
Publication types
MeSH terms
Grants and funding
LinkOut - more resources
Full Text Sources
Other Literature Sources
Medical
Miscellaneous
