Clinical Trial
. 2014 Mar;20(3):313-8.
doi: 10.1038/nm.3462. Epub 2014 Feb 23.

In vivo imaging using fluorescent antibodies to tumor necrosis factor predicts therapeutic response in Crohn's disease

Affiliations
Clinical Trial

In vivo imaging using fluorescent antibodies to tumor necrosis factor predicts therapeutic response in Crohn's disease

Raja Atreya et al. Nat Med. 2014 Mar.

Abstract

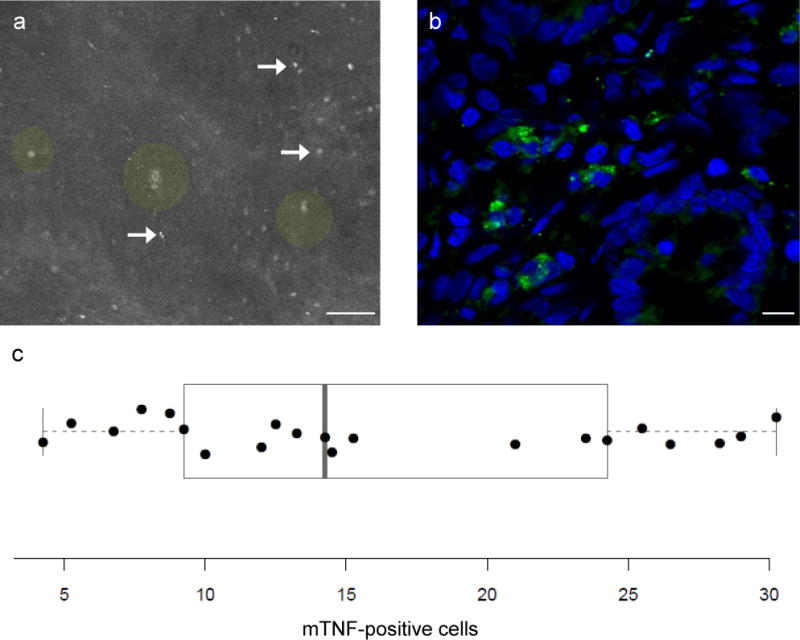
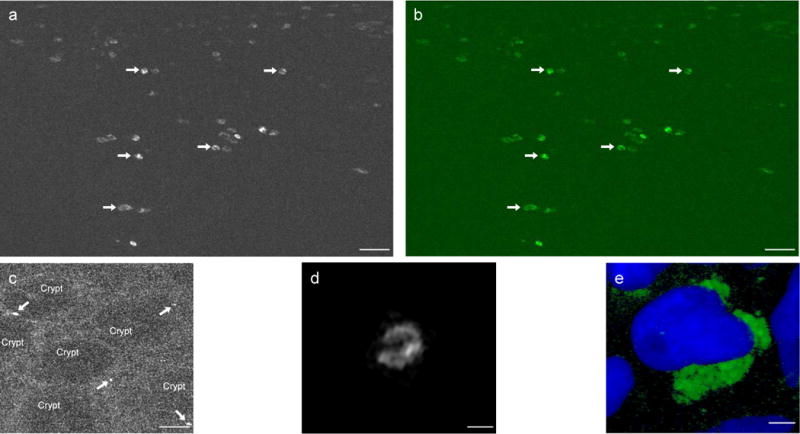
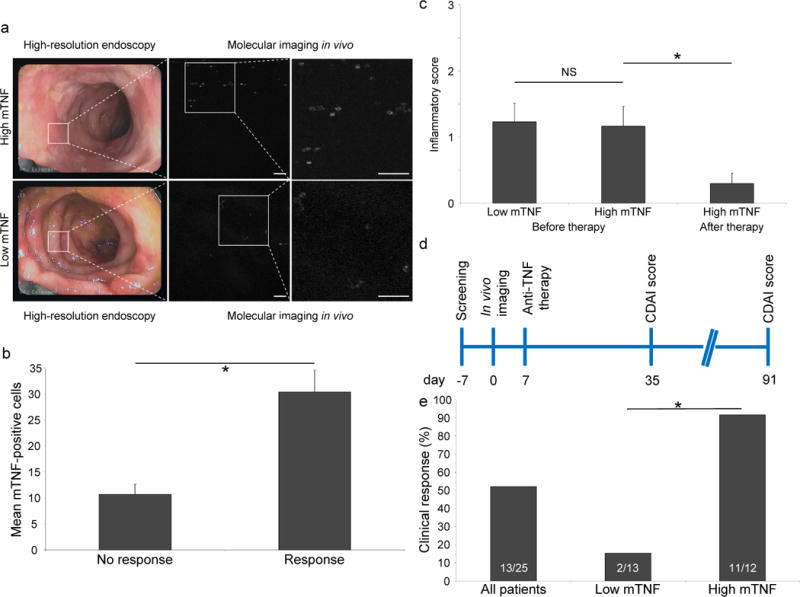
As antibodies to tumor necrosis factor (TNF) suppress immune responses in Crohn's disease by binding to membrane-bound TNF (mTNF), we created a fluorescent antibody for molecular mTNF imaging in this disease. Topical antibody administration in 25 patients with Crohn's disease led to detection of intestinal mTNF(+) immune cells during confocal laser endomicroscopy. Patients with high numbers of mTNF(+) cells showed significantly higher short-term response rates (92%) at week 12 upon subsequent anti-TNF therapy as compared to patients with low amounts of mTNF(+) cells (15%). This clinical response in the former patients was sustained over a follow-up period of 1 year and was associated with mucosal healing observed in follow-up endoscopy. These data indicate that molecular imaging with fluorescent antibodies has the potential to predict therapeutic responses to biological treatment and can be used for personalized medicine in Crohn's disease and autoimmune or inflammatory disorders.


Conflict of interest statement

COMPETING FINANCIAL INTERESTS

The authors declare competing financial interests: details are available in the online version of the paper.

Figures

Figure 1
Figure 1
Ex vivo molecular imaging of mTNF in intestinal gut samples of patients with Crohn’s disease using fluorescent adalimumab. (a) disease Ex vivo confocal imaging of intestinal gut samples of Crohn’s disease (n = 21) patients using fluorescent adalimumab showed a specific signal for mTNF+ mucosal cells (arrows). Single crypts with crypt lumina could also be differentiated (green circle overlay). Scale bar, 50 μm. (b) Confocal microscopy of a gut cryosection from the same patients upon immunohistochemical staining with fluorescent adalimumab. Confocal images show mTNF-expressing immune cells in the mucosa. Nuclei were counterstained with DAPI. One representative experiment out of five is shown. Scale bar, 10 μm. (c) The mean number of mTNF-expressing cells in inflamed intestinal gut samples per Crohn’s disease patient (n = 21) obtained by ex vivo molecular imaging (see “a”) is plotted, each dot representing one patient. As overlay, a boxplot according to Tukey is shown, the ends of the box representing the 1st and the 3rd quartile, and the middle line the median. Outliers, if within the 1.5-fold interquartile range, are shown as “whiskers”.
Figure 2
Figure 2
In vivo molecular imaging of mTNF+ mucosal immune cells in the gut of patients with Crohn’s disease. (a) Molecular imaging upon topical administration of fluorescent adalimumab to the inflamed gut of patients with Crohn’s disease in vivo yielded specific signals for mTNF+ mucosal cells (arrows). One representative image from 25 patients with Crohn’s disease is shown. Scale bar, 25 μm. (b) The confocal image contrast-enhanced by Fiji imaging technique to augment the contrast between mTNF+ mucosal cells in vivo (arrows) and background noise. Scale bar, 25 μm. (c) Digital postprocessing of confocal in vivo images allowed amplification of the background and illustrated molecular imaging of single mTNF+ cells (arrows) in mucosa below crypts in patients with Crohn’s disease. Scale bar, 25 μm. (d) High-magnification analysis of a single mTNF+ cell in the lamina propria of a patient with Crohn’s disease upon topical administration of fluorescent adalimumab in vivo. Detailed inspection revealed the membranous fluorescence pattern of the mTNF+ cell. Scale bar, 5 μm. (e) Immunohistochemistry staining with fluorescent adalimumab of targeted biopsies from mucosal areas where molecular imaging was performed showed mTNF+ cells.] Scale bar, 2.5 μm.
Figure 3
Figure 3
Clinical findings of the study. (a) Representative endoscopic images of the inflamed mucosa of patients with Crohn’s disease (n = 25). While there are similar levels of mucosal inflammation, molecular in vivo imaging revealed high (top) or low (bottom) mucosal mTNF expression. Scale bars, 50 μm. (b) Assessment of the mean number of mTNF+ cells obtained by in vivo molecular imaging in patients with Crohn’s disease that respond or do not respond to adalimumab therapy. Data are expressed as mean ± s.e.m.; *P = 0.0004 (two-sample Student’s t-test, two-sided). (c) Mean histological inflammatory score of sections from mucosal biopsies from the area where molecular imaging in vivo was performed (before therapy). The histological inflammatory score of 10 out of 12 patients with high mTNF expression on follow-up endoscopy (after therapy) is also shown. Inflammation in these histological sections was graded from 0 (no inflammation) to 3 (high inflammation). Data are expressed as mean ± s.e.m.; NS, not significant. *P = 0.024 (two sample Student’s t-test, two-sided). (d) Schematic diagram of study outline. After the screening procedure (day -7), in vivo molecular imaging with fluorescent adalimumab was performed in 25 Crohn’s disease patients (day 0). Anti-TNF therapy with adalimumab was initiated (day 7) and the CDAI score was evaluated (day 35 and 91). (e) Response rates for all patients with Crohn’s disease (n = 25), as well as for the subgroups of patients with low (n = 13) and high (n = 12) mTNF expression. *P = 0.0002 (Fisher’s exact test).

Comment in

References

    1. Strober W, Fuss I, Mannon P. The fundamental basis of inflammatory bowel disease. J Clin Invest. 2007;117:514–521. - PMC - PubMed
    1. Danese S. New therapies for inflammatory bowel disease: from the bench to the bedside. Gut. 2012;61:918–932. - PubMed
    1. Peyrin-Biroulet L, Loftus EV, Jr, Colombel JF, Sandborn WJ. The natural history of adult Crohn’s disease in population-based cohorts. Am J Gastroenterol. 2010;105:289–297. - PubMed
    1. Atreya R, et al. Blockade of interleukin 6 trans signaling suppresses T-cell resistance against apoptosis in chronic intestinal inflammation: evidence in Crohn disease and experimental colitis in vivo. Nat Med. 2000;6:583–588. - PubMed
    1. Wajant H, Pfizenmaier K, Scheurich P. Tumor necrosis factor signaling. Cell Death Differ. 2003;10:45–65. - PubMed

Publication types

MeSH terms