. 2014 Aug;128(2):231-46.
doi: 10.1007/s00401-014-1260-8. Epub 2014 Feb 25.

Oligodendroglia in cortical multiple sclerosis lesions decrease with disease progression, but regenerate after repeated experimental demyelination

Affiliations

Oligodendroglia in cortical multiple sclerosis lesions decrease with disease progression, but regenerate after repeated experimental demyelination

Enrique Garea Rodriguez et al. Acta Neuropathol. 2014 Aug.

Abstract

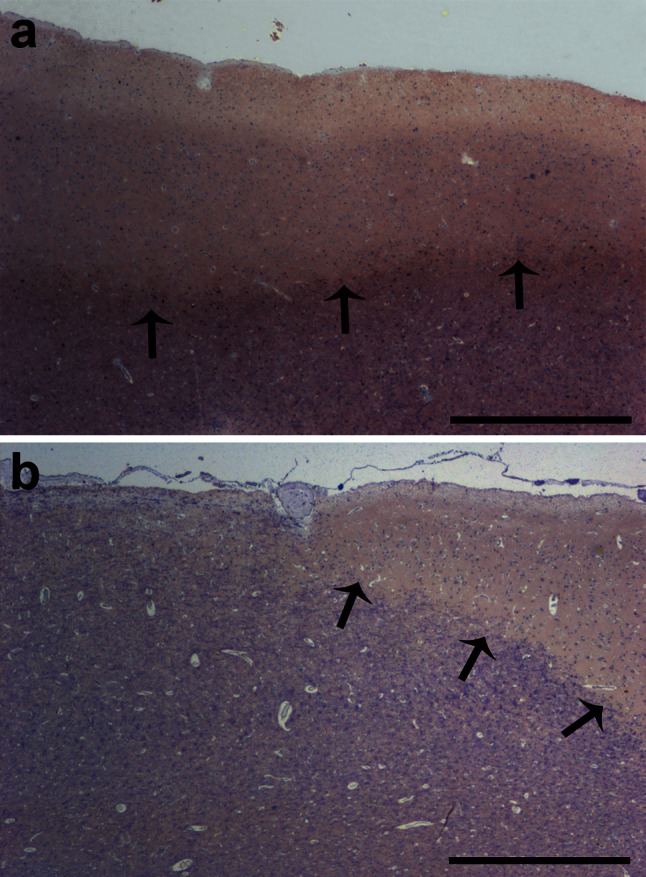
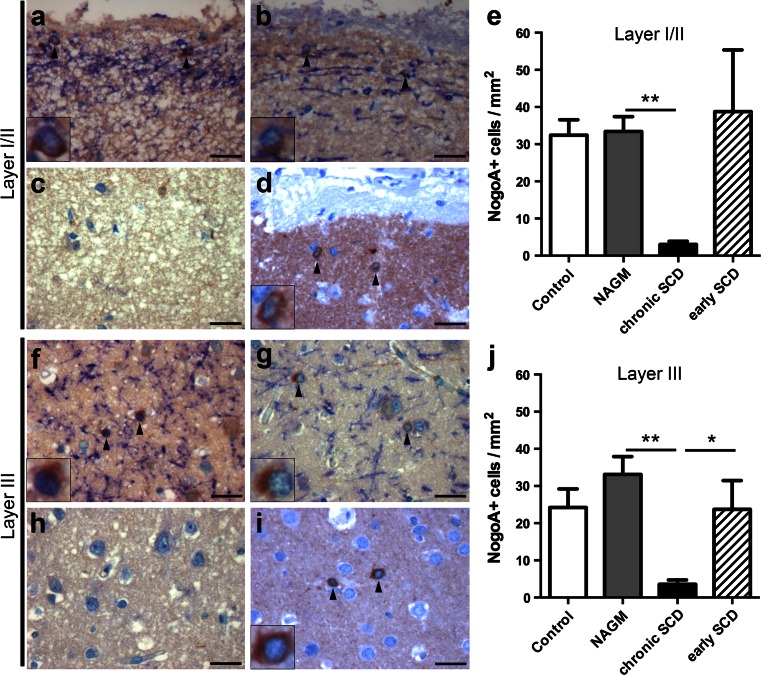
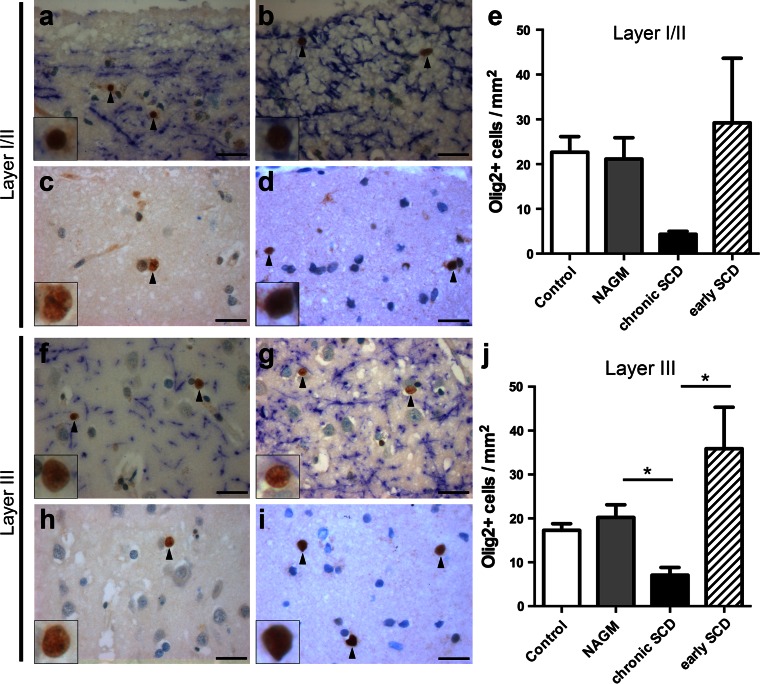
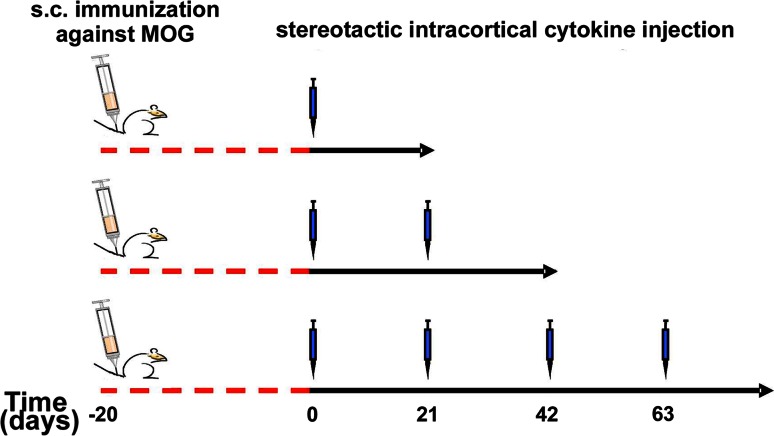
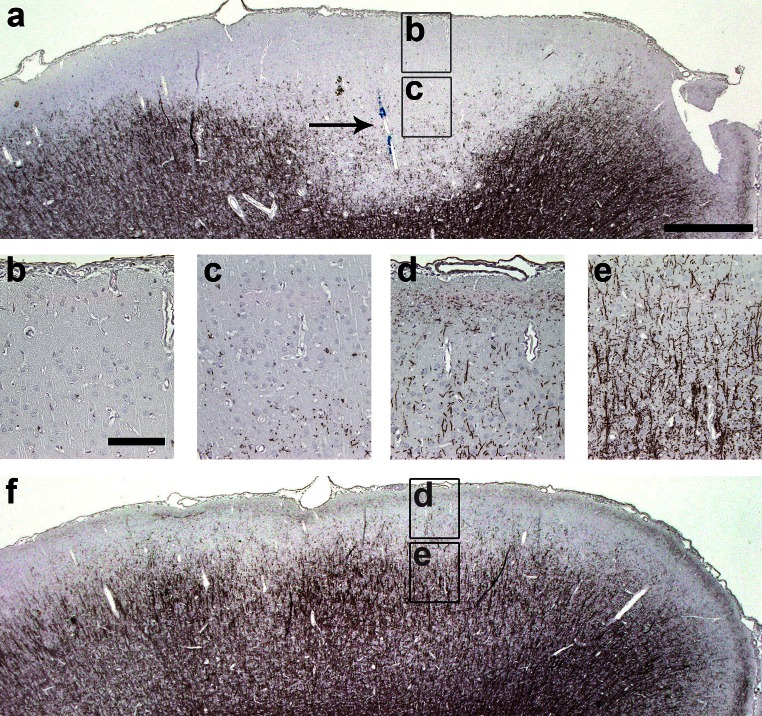
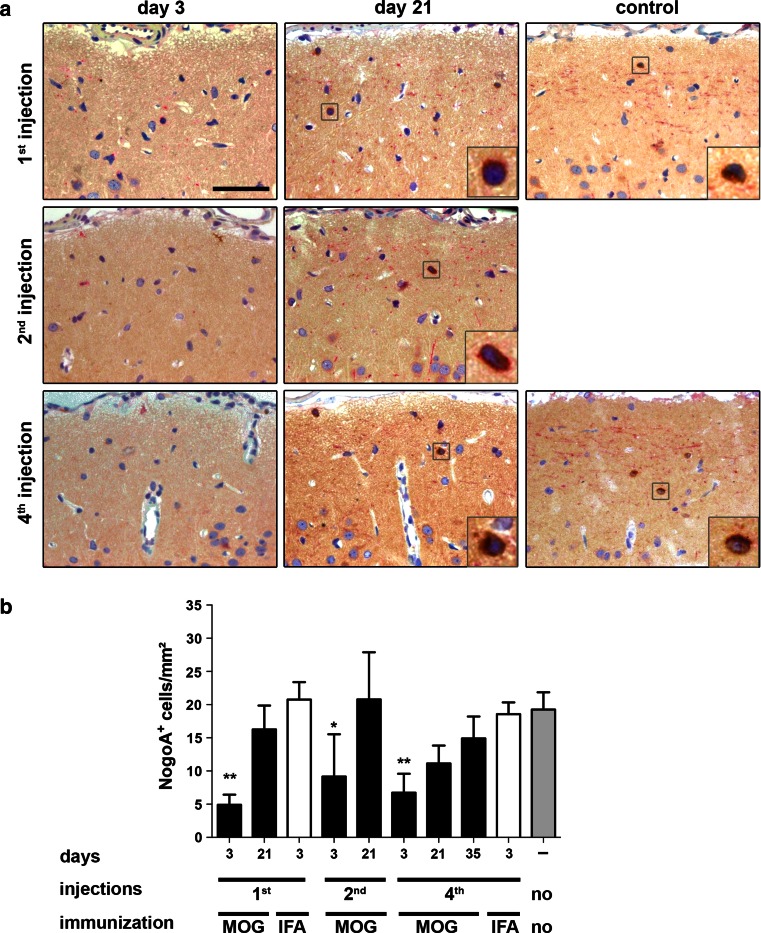
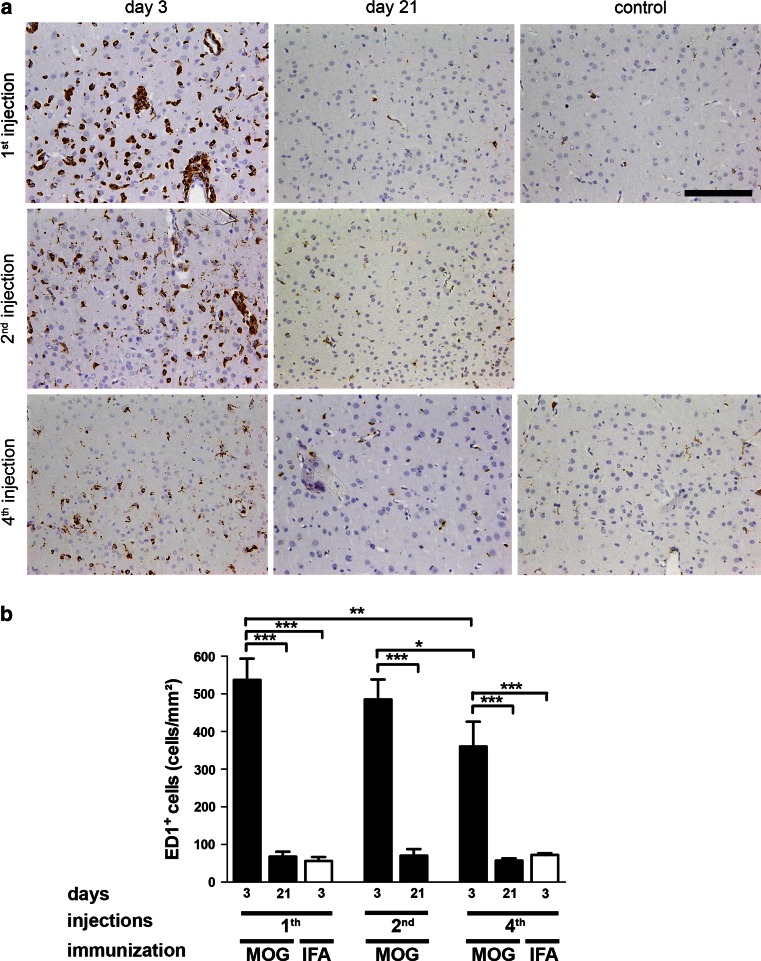
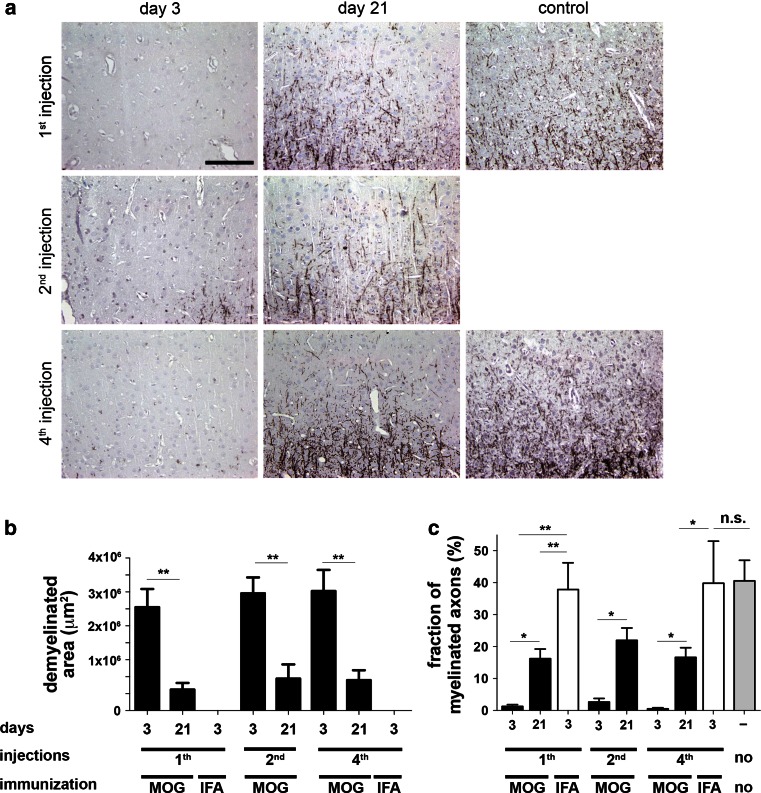
Cerebral cortex shows a high endogenous propensity for remyelination. Yet, widespread subpial cortical demyelination (SCD) is a common feature in progressive multiple sclerosis (MS) and can already be found in early MS. In the present study, we compared oligodendroglial loss in SCD in early and chronic MS. Furthermore, we addressed in an experimental model whether repeated episodes of inflammatory SCD could alter oligodendroglial repopulation and subsequently lead to persistently demyelinated cortical lesions. NogoA(+) mature oligodendrocytes and Olig2(+) oligodendrocyte precursor cells were examined in SCD in patients with early and chronic MS, normal-appearing MS cortex, and control cortex as well as in the rat model of repeated targeted cortical experimental autoimmune encephalomyelitis (EAE). NogoA(+) and Olig2(+) cells were significantly reduced in SCD in patients with chronic, but not early MS. Repeated induction of SCD in rats resulted only in a transient loss of NogoA(+), but not Olig2(+) cells during the demyelination phase. This phase was followed by complete oligodendroglial repopulation and remyelination, even after four episodes of demyelination. Our data indicate efficient oligodendroglial repopulation in subpial cortical lesions in rats after repeated SCD that was similar to early, but not chronic MS cases. Accordingly, four cycles of experimental de- and remyelination were not sufficient to induce sustained remyelination failure as found in chronic cortical MS lesions. This suggests that alternative mechanisms contribute to oligodendrocyte depletion in chronic cortical demyelination in MS.


Figures

Fig. 1
Fig. 1
Subpial cortical demyelination in early and chronic MS cases. Immunohistochemistry for MBP (blue) reveals subpial cortical demyelination (SCD) in early (biopsy) (a) and chronic (autopsy) (b) cases with MS. a Exemplary biopsy tissue from one of the patients with early MS shows confluent SCD affecting cortical layers I–III. b Exemplary section from one of the autopsy cases with long-standing MS displays the transition zone of normal-appearing myelinated cortex (on the left) and SCD (on the right). Arrows indicate the border of the cortical demyelination. Scale bars 1 mm in a and b
Fig. 2
Fig. 2
Marked microglia/macrophage activation in early, but not chronic subpial MS lesions. af Immunohistochemistry for KiM1P+ macrophages and microglia in SCD of chronic (autopsy) and early (biopsy) cases with MS. Representative images show KiM1P+ cells within early (a) and chronic (b) SCD of cortical layers I/II as well as the quantification thereof (c). Representative images show KiM1P+ cells in early (d) and chronic (e) SCD within cortical layer III as well as the quantification thereof (f). Black arrowheads point toward exemplary KiM1P+ cells. Insets in a, b, d and e show KiM1P+ cells in greater detail. Scale bars 25 μm in a, b, d, e; error bars indicate SEM. *p < 0.05
Fig. 3
Fig. 3
Reduction of oligodendrocytes in cortical layers I/II and layer III in chronic, but not early MS lesions. aj Immunohistochemistry for MBP (blue) and NogoA+ OLs (brown) within layers I/II (ad) or layer III (fi), respectively, and the corresponding quantitative evaluation (e, j). Representative images of control cortex (a, f), normal-appearing cortex (NAGM) of chronic MS (b, g) as well as chronic (c, h) or early (d, i) SCD. Similar numbers of NogoA+ cells are noted in cortical layers I/II (a, b, d, e) and layer III (f, g, i, j) in the control cortex (a, f), NAGM (b, g) and SCD from patients with early MS (d, i). In patients with chronic MS, NogoA+ cells are significantly reduced in chronic SCD (c, h) in cortical layers I/II (c) and III (h) each compared to the corresponding NAGM area. The densities of NogoA+ OLs in layer III are significantly decreased in chronic SCD compared to early SCD (j), whereas there is a trend for the group comparison within layers I/II (e) (p = 0.06). NogoA+ cells are indicated by black arrowheads and shown in detail in insets. Scale bars 25 μm in ad and fi; error bars indicate SEM. *p < 0.05, **p < 0.01
Fig. 4
Fig. 4
Reduced oligodendrocyte precursors in chronic, but not early MS lesions. aj Immunohistochemistry for OPCs with strong Olig2 expression (Olig2+ cells) (brown) and MBP-positive myelin (blue) within layers I/II (ad) or layer III (fi), respectively, and the corresponding quantitative evaluation (e, j). Representative images are shown of control cortex (a, f), normal-appearing cortex (NAGM) of chronic MS (b, g) as well as chronic (c, h) and early (d, i) SCD. Similar numbers of Olig2+ cells are noted in myelinated cortical layers I/II (e) or layer III (j) in control cortex, MS NAGM and SCD from patients with early MS. In layers I/II, there is a trend for decreased Olig2+ OPCs in chronic SCD (autopsy) (c) compared to either adjacent NAGM (p = 0.05) or demyelinated early SCD (biopsy) (p = 0.06) (e). In layer III Olig2+ cells are significantly reduced in chronic SCD (h, j) compared to NAGM and early SCD (p < 0.05 for both comparisons). Olig2+ cells are indicated by black arrowheads and shown in detail in insets. Scale bars 25 μm in ad and fi; error bars indicate SEM. *p < 0.05
Fig. 5
Fig. 5
Experimental setup for cortical targeted EAE induction in rats. Animals were immunized with rMOG emulsified in incomplete Freund’s adjuvant (IFA). Controls (not depicted in the graph) were immunized with IFA only. 20 days later, cytokines were stereotactically injected into the cortex either once (top row), twice (middle row) or four times (bottom row) with 3 weeks time interval(s) between each injection
Fig. 6
Fig. 6
Focal subpial cortical demyelination in the ipsilateral, but not contralateral cortex after intracerebral cytokine injection in rMOG-immunized rats. af Representative photographs of MBP-immunostained cortex of rMOG-primed rats on day 3 post-lesion induction (ac). Extensive ipsilateral demyelination is present 3 days after intracortical cytokine injection in rMOG-immunized rats. Targeted lesion is indicated by arrow marking the injected blue dye. df In contrast, the contralateral non-injected hemisphere displays intact myelin. Scale bars a and f 500 μm, be 100 μm
Fig. 7
Fig. 7
Efficient repopulation with cortical NogoA+ oligodendrocytes after repeated cycles of cortical demyelination in rats. a Representative photographs of NogoA-immunostained sections of lesioned subpial cortex at indicated time points and in different animal groups. b Quantification of NogoA+ cells. At 3 days post-lesion induction, NogoA+ cell density is significantly decreased followed by significant repopulation (on day 21) after one and two demyelinating events. After four episodes of cortical lesion induction, a trend toward lower OLs counts (p = 0.052) is noted in comparison to naive controls. However, 35 days after the fourth lesion induction the density increases again to control levels. Data are expressed as mean + SEM. For statistical evaluation, one-way ANOVA followed by post hoc LSD test is performed (*p < 0.05, **p < 0.01). Scale bar 50 μm, length of enlarged image 14 μm
Fig. 8
Fig. 8
No reduction of Olig2+ oligodendrocyte precursor population after repeated demyelination in rats. a Representative photographs of Olig2 and PLP double-immunostained sections within the cytokine-injected subpial cortex. Merged overview photographs show Olig2+ precursors (red), PLP+ myelin (green) and DAPI+ nuclei (blue). Arrows point toward Olig2+ OPCs and white squares indicate the area from which the insets are taken (upper image Olig2, middle: DAPI, lower merged image). b No significant reduction of Olig2+ cells is noted at any time point investigated compared to untreated controls. Furthermore, densities of Olig2+ cells are significantly higher on day 21 after the first injection and on day 3 after the fourth injection in rMOG-immunized mice. Data are expressed as mean + SEM. For statistical evaluation, one-way ANOVA followed by post hoc LSD test is performed (**p < 0.01). Scale bar 25 μm
Fig. 9
Fig. 9
Transient increase of activated macrophages and microglia shortly after single and repeated cytokine injection in rats. a Representative photographs show ED1-immunostained sections within the cytokine-injected cortex on days 3 and 21 after last lesion induction of the indicated experimental groups. b Quantification of ED1+ activated macrophages and microglia within cortical layer III. On day 3 after lesioning, the density of ED1+ macrophages and microglia is significantly higher in rMOG- than IFA-immunized animals after single or repeated, respectively, cytokine injection(s). Data are expressed as mean + SEM. For statistical evaluation one-way ANOVA followed by post hoc LSD test is performed (*p < 0.05, **p < 0.01, ***p < 0.001). Scale bar 100 μm
Fig. 10
Fig. 10
Unaltered remyelination after repeated cortical demyelination in rats. a Representative photographs show MBP-immunostained sections within cytokine-injected cortex on days 3 and 21 after last lesion induction in rMOG-immunized animals and controls. b Quantification of the demyelinated cortical area in rMOG- or IFA-immunized animals following intracerebral cytokine injection. Animals immunized with rMOG show a similar size of cortical demyelination on day 3 after single or repeated lesion induction. Likewise, the area of cortical demyelination is consistently decreased in these experimental groups on day 21 after single or repeated lesioning. In contrast, IFA-immunized controls (“IFA”) show no signs of demyelination. c Quantification of the myelinated axon fraction reveals a significant reduction of the myelinated axon fraction in demyelinated (day 3) animals compared to remyelinated (day 21) animals and controls. The fraction of myelinated axons remains stable at the remyelination time point (day 21) after single versus repeated injection, but is still significantly lower than in controls. Data are expressed as mean + SEM. For statistical evaluation, one-way ANOVA followed by post hoc LSD test is performed (**p < 0.01, ***p < 0.001). Scale bar 100 μm

Similar articles

Cited by

References

    1. Adelmann M, Wood J, Benzel I, et al. The N-terminal domain of the myelin oligodendrocyte glycoprotein (MOG) induces acute demyelinating experimental autoimmune encephalomyelitis in the Lewis rat. J Neuroimmunol. 1995;63:17–27. doi: 10.1016/0165-5728(95)00124-7. - DOI - PubMed
    1. Albert M, Antel J, Bruck W, Stadelmann C. Extensive cortical remyelination in patients with chronic multiple sclerosis. Brain Pathol. 2007;17:129–138. doi: 10.1111/j.1750-3639.2006.00043.x. - DOI - PMC - PubMed
    1. Bo L, Geurts JJ, van der Valk P, Polman C, Barkhof F. Lack of correlation between cortical demyelination and white matter pathologic changes in multiple sclerosis. Arch Neurol. 2007;64:76–80. doi: 10.1001/archneur.64.1.76. - DOI - PubMed
    1. Bo L, Vedeler CA, Nyland H, Trapp BD, Mork SJ. Intracortical multiple sclerosis lesions are not associated with increased lymphocyte infiltration. Mult Scler. 2003;9:323–331. doi: 10.1191/1352458503ms917oa. - DOI - PubMed
    1. Bo L, Vedeler CA, Nyland HI, Trapp BD, Mork SJ. Subpial demyelination in the cerebral cortex of multiple sclerosis patients. J Neuropathol Exp Neurol. 2003;62:723–732. - PubMed

Publication types

MeSH terms

LinkOut - more resources