. 2014 Jul;17(3):675-83.
doi: 10.1007/s10456-014-9423-8. Epub 2014 Feb 23.

Angiopoietin-like protein 2 regulates endothelial colony forming cell vasculogenesis

Affiliations

Angiopoietin-like protein 2 regulates endothelial colony forming cell vasculogenesis

Matthew R Richardson et al. Angiogenesis. 2014 Jul.

Abstract

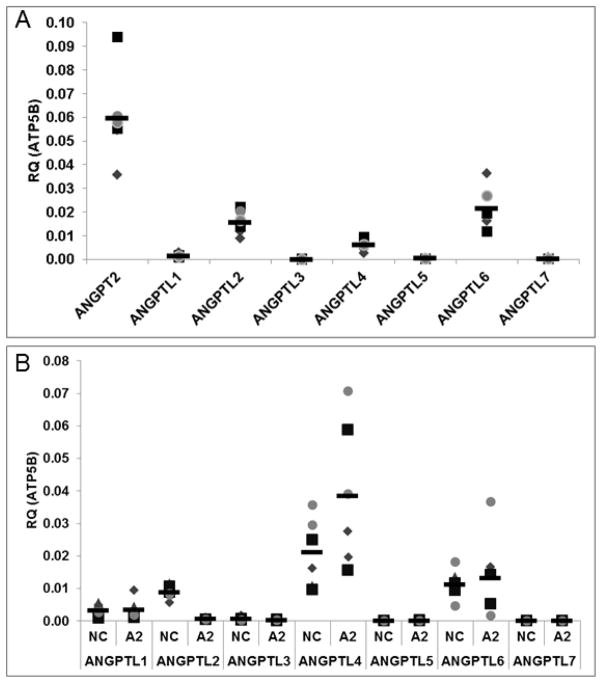
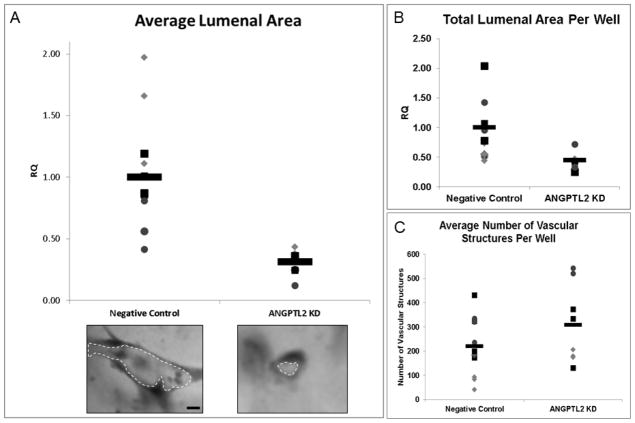
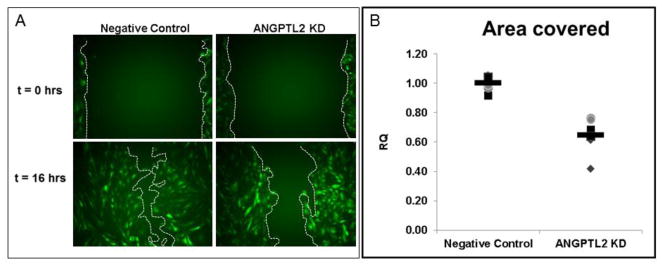
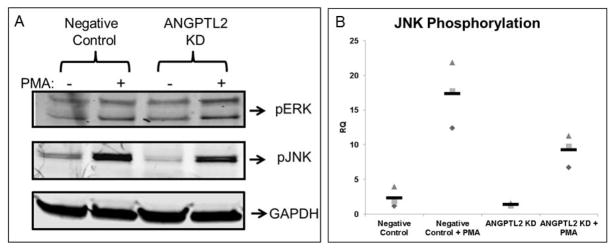
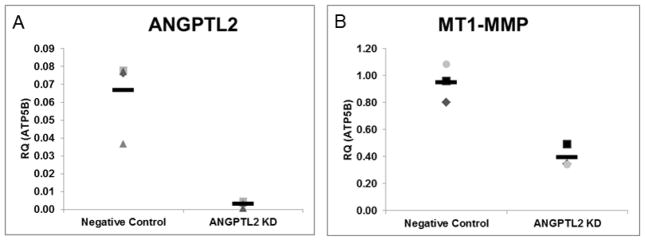
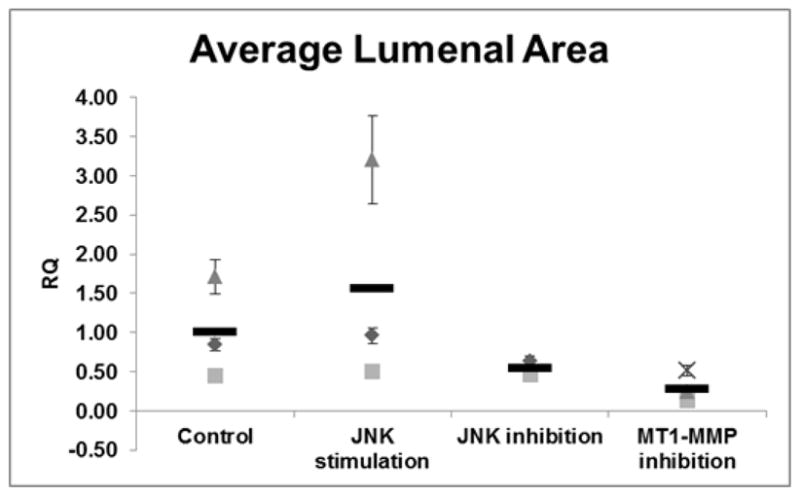
Angiopoietin-like 2 (ANGPTL2) has been reported to induce sprouting angiogenesis; however, its role in vasculogenesis, the de novo lumenization of endothelial cells (EC), remains unexplored. We sought to investigate the potential role of ANGPTL2 in regulating human cord blood derived endothelial colony forming cell (ECFC) vasculogenesis through siRNA mediated inhibition of ANGPTL2 gene expression. We found that ECFCs in which ANGPTL2 was diminished displayed a threefold decrease in in vitro lumenal area whereas addition of exogenous ANGPTL2 protein domains to ECFCs lead to increased lumen formation within a 3 dimensional (3D) collagen assay of vasculogenesis. ECFC migration was attenuated by 36 % via ANGPTL2 knockdown (KD) although proliferation and apoptosis were not affected. We subsequently found that c-Jun NH2-terminal kinase (JNK), but not ERK1/2, phosphorylation was decreased upon ANGPTL2 KD, and expression of membrane type 1 matrix metalloproteinase (MT1-MMP), known to be regulated by JNK and a critical regulator of EC migration and 3D lumen formation, was decreased in lumenized structures in vitro derived from ANGPTL2 silenced ECFCs. Treatment of ECFCs in 3D collagen matrices with either a JNK inhibitor or exogenous rhTIMP-3 (an inhibitor of MT1-MMP activity) resulted in a similar phenotype of decreased vascular lumen formation as observed with ANGPTL2 KD, whereas stimulation of JNK activity increased vasculogenesis. Based on gene silencing, pharmacologic, cellular, and biochemical approaches, we conclude that ANGPTL2 positively regulates ECFC vascular lumen formation likely through its effects on migration and in part by activating JNK and increasing MT1-MMP expression.


Figures

Figure 1
Figure 1. Angiopoietin-like mRNA expression in ECFCs
qRT-PCR was performed for the ANGPTL family members in ECFCs (A). ANGPTL2 and 6 were found to be expressed significantly in ECFCs compared to ANGPTL3 and 7. Expression of Angiopoietin-2 (ANGPT2) is included for comparison purposes. All data are normalized to the housekeeping gene ATP5B. Next qRT-PCR was performed for the ANGPTL family members in ECFCs treated with ANGPTL2 or negative control siRNA (B). ANGPTL2 silencing is demonstrated. ANGPTL4 expression was elevated in response to ANGPTL2 KD with no significant alterations in expression levels of the other ANGPTL genes (Figure 1B). Technical replicates are represented by the same symbol with each biological replicate represented by a unique symbol. NC = Negative Control; A2 = ANGPTL2 KD. RQ = relative quantity. (n = 3). Statistical analyses: Kruskal-Wallis test with Dunn post-test (Figure 1A) and Wilcoxon matched pairs test (Figure 1B).
Figure 2
Figure 2. Quantitation of ECFC lumen formation in response to ANGPTL2 silencing in a 3D assay of vasculogenesis
ANGPTL2 silencing significantly decreased the average vascular lumen area at 2 days compared to negative control siRNA treated ECFCs (A). Representative vascular structures for each group are shown. ANGPTL2 silencing significantly decreased the total lumenal area of 3D vascular structures compared to negative control siRNA treated ECFCs (B) but did not alter the average number of vascular structures (C). RQ = relative quantity; Bar = 10 μm. Technical replicates are represented by the same symbol with each biological replicate represented by a unique symbol (n = 3). Statistical analysis: Mann-Whitney test.
Figure 3
Figure 3. Quantitation of ECFC lumenal area in response to exogenous addition of rhANGPTL2 domains
The average lumenal area of ECFC derived 3D vascular structures treated with recombinant human angiopoietin-like protein 2 fibrinogen-like domain (FLD), coiled-coil domain (CCD), or vehicle (control) was calculated. CCD treatment but not FLD significantly improved lumen formation in ECFCs. RQ = relative quantity; n = 3. Since there were no technical replicates in this experiment, the standard error of the mean was included with the average of each biological replicate to illustrate the size range of the vascular structures measured; there were 324 structures measured on average per well. Statistical analysis: Kruskal-Wallis test with Dunn post-test.
Figure 4
Figure 4. Quantitative migration assay of ECFCs in response to ANGPTL2 silencing
Confluent monolayers of ECFCs were scratched with a 1000 μL pipette tip with the boundaries indicated by the red lines. Images were collected until the negative control siRNA treated ECFCs filled in the scratched area, which occurred no later than 16 hours after the initial scratch. There was a significant delay in migration in ANGPTL2 silenced ECFCs as determined by area covered. For the purposes of this figure to highlight differences in migration, images were collected from experiments conducted with transgenic ECFCs constitutively expressing GFP. RQ = relative quantity; Technical replicates are represented by the same symbol with each biological replicate represented by a unique symbol (n = 4). Statistical analysis: Mann-Whitney test.
Figure 5
Figure 5. MAP kinase phosphorylation analysis
Representative Western blots are shown (A) with quantification (B) of ECFCs pretreated with negative control or ANGPTL2 siRNA then serum starved for 5 hours followed by treatment with 50 nM PMA or vehicle prior to lysis. There was significantly less JNK but not ERK1/2 phosphorylation in ECFCs treated with ANGPTL2 siRNA compared to negative control siRNA. RQ = relative quantity; n = 4. Statistical analysis: Kruskal-Wallis test with Dunn post-test.
Figure 6
Figure 6. Quantitative RT-PCR analysis of ANGPTL2 and MT1-MMP gene expression from 3D ECFC vascular structures
3D vascular structures formed from siRNA treated ECFCs were lysed with RNA lysis buffer at 48 hours. Real time PCR was used to determine relative expression levels of ANGPTL2 and MT1-MMP in 3D in response to ANGPTL2 KD. Both transcripts were found to be decreased in ANGPTL2 silenced ECFCs in 3D. Data are normalized to the housekeeping gene ATP5B. RQ = relative quantity; n = 3. Statistical analysis: Mann-Whitney test.
Figure 7
Figure 7. Quantitation of ECFC lumenal area in response to activation or inhibition of JNK and inhibition MT1-MMP
The average lumenal area of ECFC derived 3D vascular structures treated with JNK activator, JNK inhibitor, or MT1-MMP inhibitor (TIMP-3). ECFCs display statistically significant diminished lumen formation through inhibition of JNK activity, whereas activation of JNK via anisomycin resulted in increased lumen formation compared to control ECFCs. Inhibition of MT1-MMP function using exogenous addition of rhTIMP-3 resulted in a statistically significant decrease in lumen formation. RQ = relative quantity; n = 3. Since there were no technical replicates in this experiment, the standard error of the mean was included with the average of each biological replicate to illustrate the size range of the vascular structures measured; there were 248 structures measured on average per well. Statistical analysis: Kruskal-Wallis test with Dunn post-test.

Similar articles

Cited by

References

    1. Iruela-Arispe ML, Davis GE. Cellular and molecular mechanisms of vascular lumen formation. Dev Cell. 2009;16(2):222–31. - PMC - PubMed
    1. Prater DN, et al. Working hypothesis to redefine endothelial progenitor cells. Leukemia. 2007;21(6):1141–9. - PubMed
    1. Czirok A, Little CD. Pattern formation during vasculogenesis. Birth Defects Res C Embryo Today. 2012;96(2):153–62. - PMC - PubMed
    1. Ingram DA, et al. Identification of a novel hierarchy of endothelial progenitor cells using human peripheral and umbilical cord blood. Blood. 2004;104(9):2752–60. - PubMed
    1. Richardson MR, Yoder MC. Endothelial progenitor cells: quo vadis? J Mol Cell Cardiol. 2011;50(2):266–72. - PMC - PubMed

Publication types

MeSH terms