

Mechanisms of pharmaceutical aerosol deposition in the respiratory tract
- PMID: 24563174
- PMCID: PMC4037474
- DOI: 10.1208/s12249-014-0092-0
Mechanisms of pharmaceutical aerosol deposition in the respiratory tract
Abstract
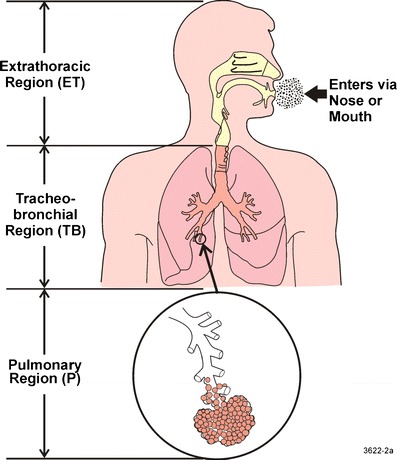
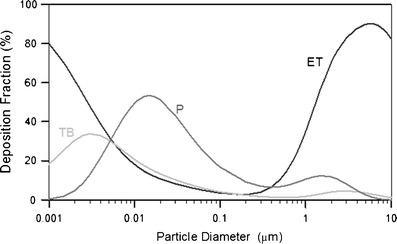
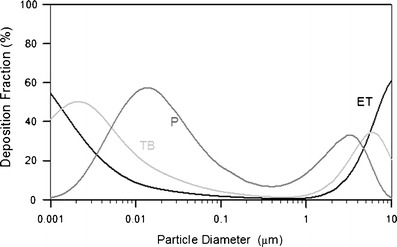
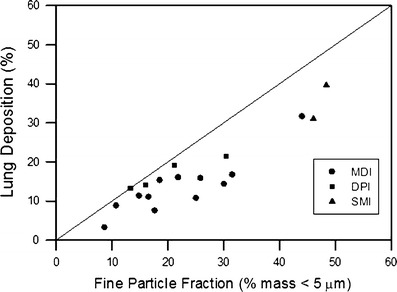
Aerosol delivery is noninvasive and is effective in much lower doses than required for oral administration. Currently, there are several types of therapeutic aerosol delivery systems, including the pressurized metered-dose inhaler, the dry powder inhaler, the medical nebulizer, the solution mist inhaler, and the nasal sprays. Both oral and nasal inhalation routes are used for the delivery of therapeutic aerosols. Following inhalation therapy, only a fraction of the dose reaches the expected target area. Knowledge of the amount of drug actually deposited is essential in designing the delivery system or devices to optimize the delivery efficiency to the targeted region of the respiratory tract. Aerosol deposition mechanisms in the human respiratory tract have been well studied. Prediction of pharmaceutical aerosol deposition using established lung deposition models has limited success primarily because they underestimated oropharyngeal deposition. Recent studies of oropharyngeal deposition of several drug delivery systems identify other factors associated with the delivery system that dominates the transport and deposition of the oropharyngeal region. Computational fluid dynamic simulation of the aerosol transport and deposition in the respiratory tract has provided important insight into these processes. Investigation of nasal spray deposition mechanisms is also discussed.
Figures
Similar articles
-
Pediatric in vitro and in silico models of deposition via oral and nasal inhalation.J Aerosol Med Pulm Drug Deliv. 2014 Jun;27(3):149-69. doi: 10.1089/jamp.2013.1075. J Aerosol Med Pulm Drug Deliv. 2014. PMID: 24870701 Review.
-
Hood nebulization: effects of head direction and breathing mode on particle inhalability and deposition in a 7-month-old infant model.J Aerosol Med Pulm Drug Deliv. 2014 Jun;27(3):209-18. doi: 10.1089/jamp.2013.1051. Epub 2013 Jun 29. J Aerosol Med Pulm Drug Deliv. 2014. PMID: 23808762
-
In vivo-in vitro correlations: predicting pulmonary drug deposition from pharmaceutical aerosols.J Aerosol Med Pulm Drug Deliv. 2010 Dec;23 Suppl 2:S59-69. doi: 10.1089/jamp.2010.0846. J Aerosol Med Pulm Drug Deliv. 2010. PMID: 21133801 Review.
-
Targeted drug-aerosol delivery in the human respiratory system.Annu Rev Biomed Eng. 2008;10:195-220. doi: 10.1146/annurev.bioeng.10.061807.160544. Annu Rev Biomed Eng. 2008. PMID: 18412536 Review.
-
Current Inhalers Deliver Very Small Doses to the Lower Tracheobronchial Airways: Assessment of Healthy and Constricted Lungs.J Pharm Sci. 2016 Jan;105(1):147-59. doi: 10.1016/j.xphs.2015.11.027. Epub 2016 Jan 13. J Pharm Sci. 2016. PMID: 26852850 Free PMC article.
Cited by
-
Nicotine forms: why and how do they matter in nicotine delivery from electronic cigarettes?Expert Opin Drug Deliv. 2020 Dec;17(12):1727-1736. doi: 10.1080/17425247.2020.1814736. Epub 2020 Sep 17. Expert Opin Drug Deliv. 2020. PMID: 32842785 Free PMC article. Review.
-
Effects of Temperature and Humidity on Laser Diffraction Measurements to Jet Nebulizer and Comparison with NGI.AAPS PharmSciTech. 2016 Apr;17(2):380-8. doi: 10.1208/s12249-015-0346-5. Epub 2015 Jul 14. AAPS PharmSciTech. 2016. PMID: 26169901 Free PMC article.
-
Repurposing of Plasminogen: An Orphan Medicinal Product Suitable for SARS-CoV-2 Inhalable Therapeutics.Pharmaceuticals (Basel). 2020 Nov 27;13(12):425. doi: 10.3390/ph13120425. Pharmaceuticals (Basel). 2020. PMID: 33260813 Free PMC article.
-
In Vitro and In Silico Investigations on Drug Delivery in the Mouth-Throat Models with Handihaler®.Pharm Res. 2022 Nov;39(11):3005-3019. doi: 10.1007/s11095-022-03386-9. Epub 2022 Sep 7. Pharm Res. 2022. PMID: 36071350
-
Ventilation Heterogeneity and Its Association with Nodule Formation Among Participants in the National Lung Screening Trial-A Preliminary Investigation.Acad Radiol. 2020 May;27(5):630-635. doi: 10.1016/j.acra.2019.07.024. Epub 2019 Aug 27. Acad Radiol. 2020. PMID: 31471206 Free PMC article.
References
-
- Derom E, Pauwels R. Relationship between airway deposition and effects for inhaled bronchodilators. In: Dalby R, Byron PR, Farr SJ, editors. Respiratory drug delivery VI. Buffalo Grove: Interpharm Press; 1998. pp. 35–44.
-
- Cheng YS. Modeling aerosol drug delivery. In: Gradon L, Marijnissen J, editors. Optimization of aerosol drug delivery. Dordrecht: Kluwer; 2003. pp. 165–188.
-
- Newman S, Bennett WD, Biddiscombe M, Devadason SG, Dolovich M, Fleming J, et al. Standardization of techniques for using planar (2D) imaging for aerosol deposition assessment of orally inhaled products. J Aerosol Med Pulmon Drug Deliv. 2012;25:S10–S28. - PubMed
-
- Fleming J, Bailey DL, Chan HK, Conway J, Kuehl PJ, Laube BL, et al. Standardization of techniques for using single-photon emission computed tomography (SPECT) for aerosol deposition assessment of orally inhaled products. J Aerosol Med Pulmon Drug Deliv. 2012;25:S29–S51. - PubMed
Publication types
MeSH terms
Substances
Grants and funding
LinkOut - more resources
Full Text Sources
Other Literature Sources
Medical
