. 2014 Feb;26(2):695-711.
doi: 10.1105/tpc.113.119974. Epub 2014 Feb 21.

ABD1 is an Arabidopsis DCAF substrate receptor for CUL4-DDB1-based E3 ligases that acts as a negative regulator of abscisic acid signaling

Affiliations

ABD1 is an Arabidopsis DCAF substrate receptor for CUL4-DDB1-based E3 ligases that acts as a negative regulator of abscisic acid signaling

Kyoung-In Seo et al. Plant Cell. 2014 Feb.

Abstract

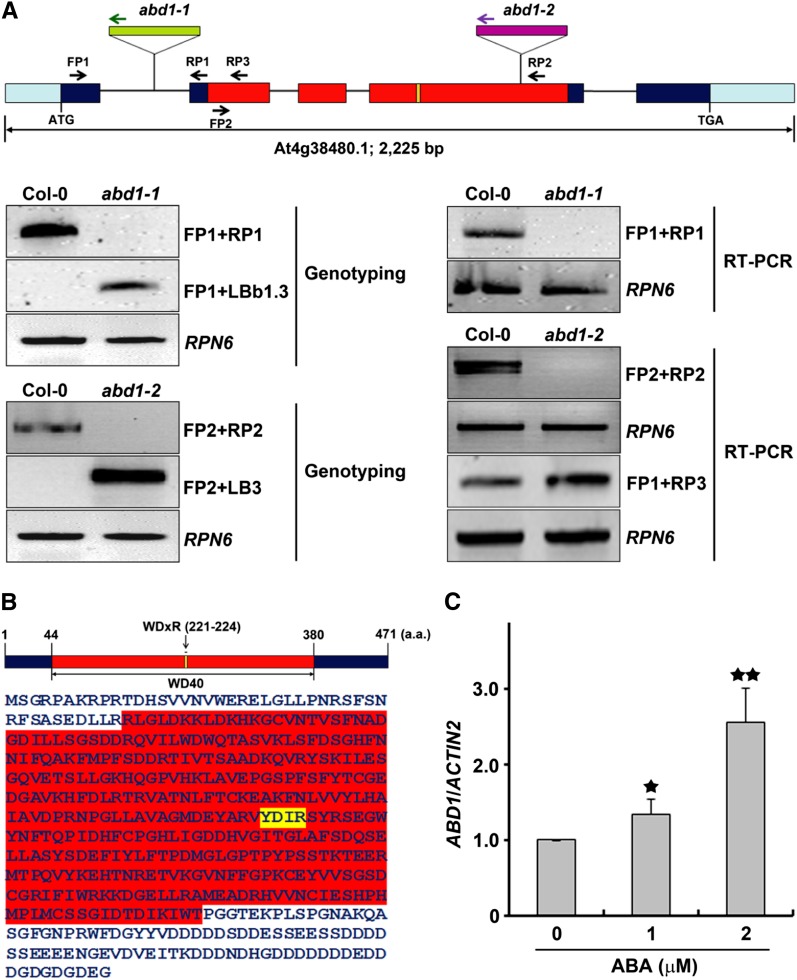
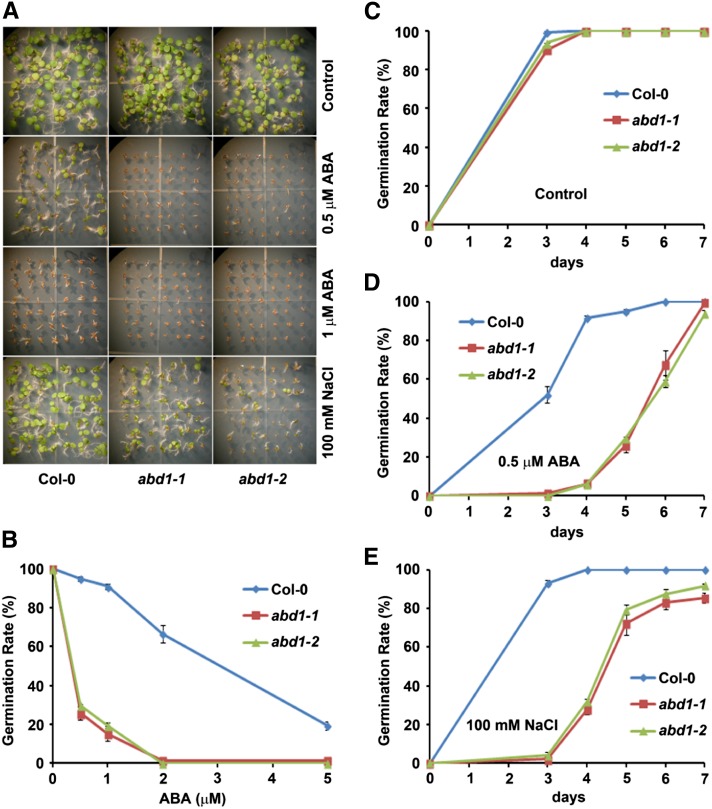
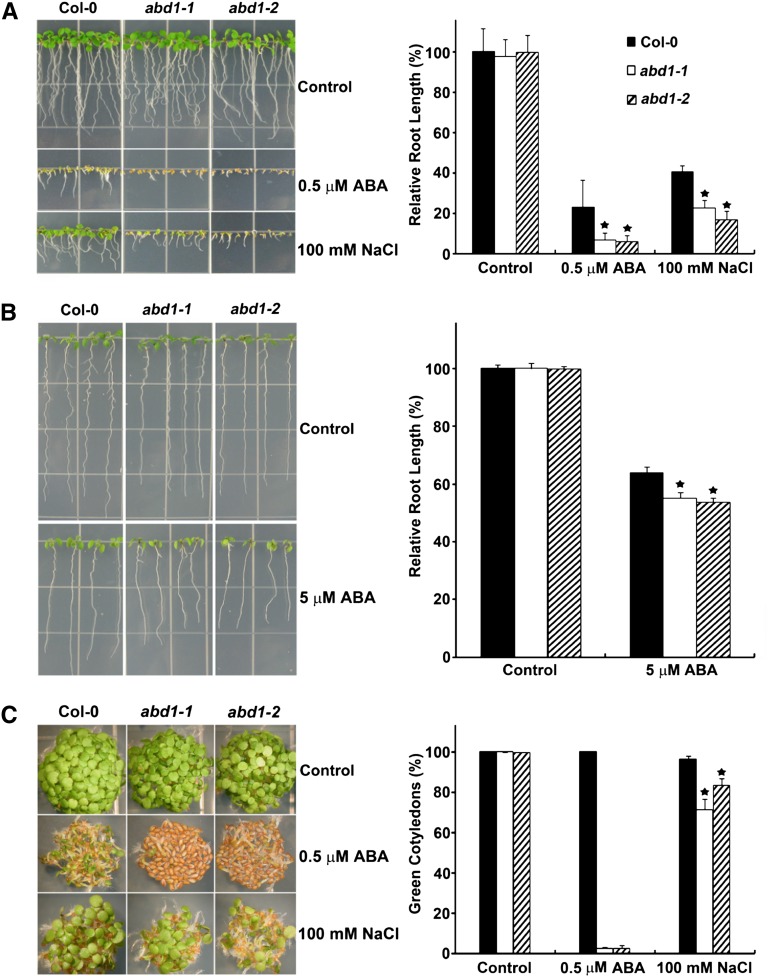
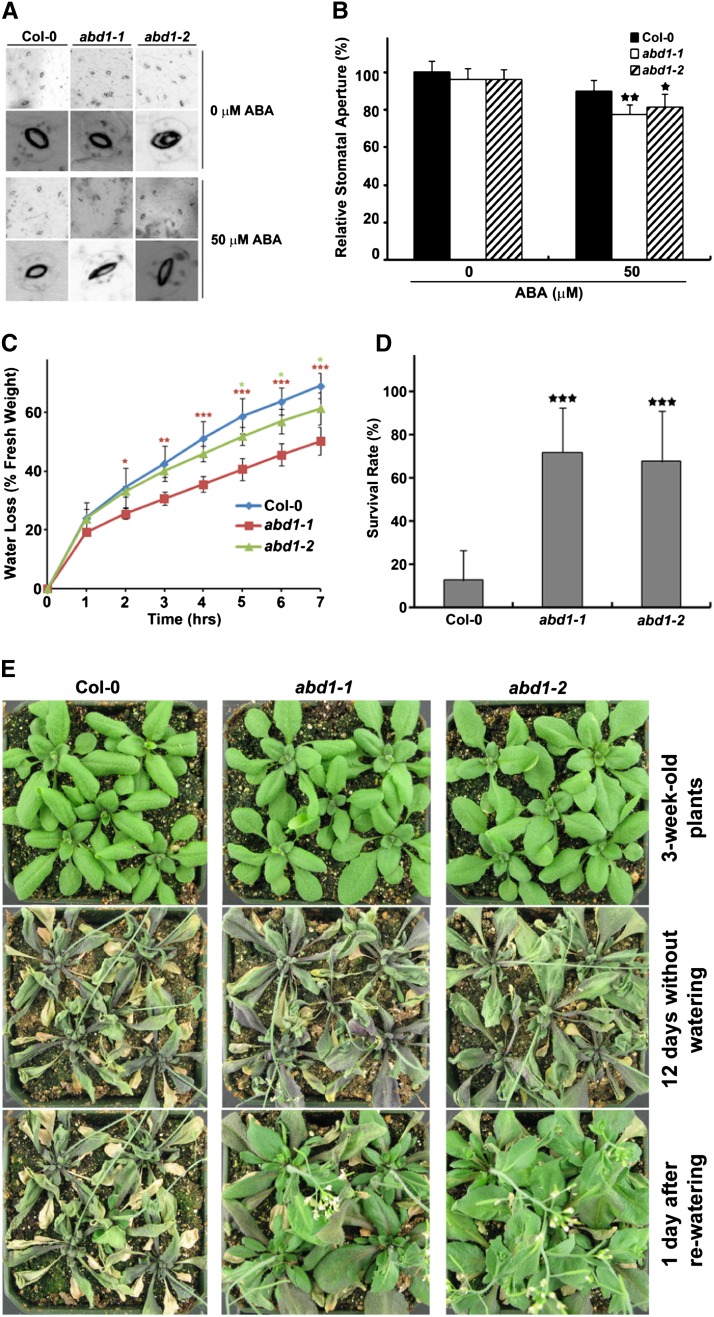
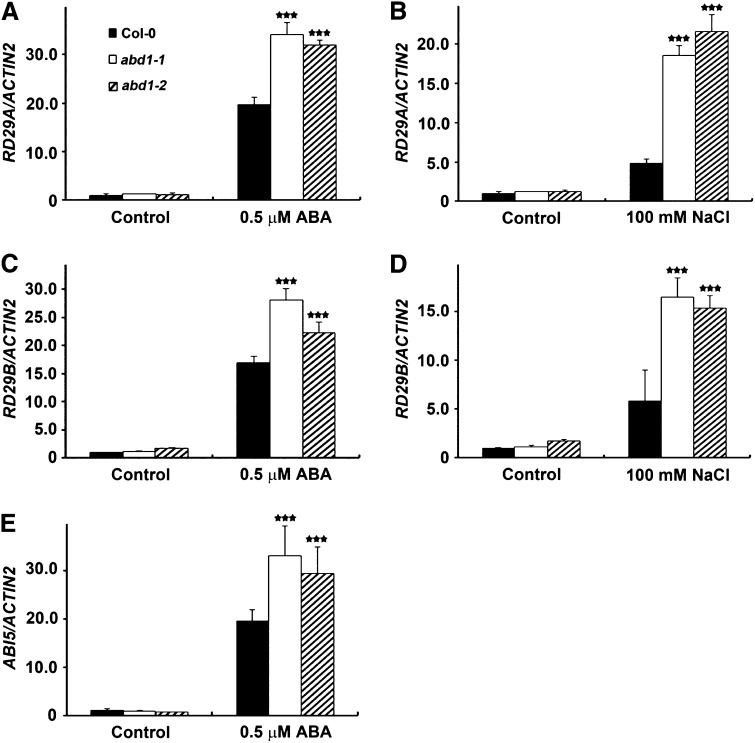
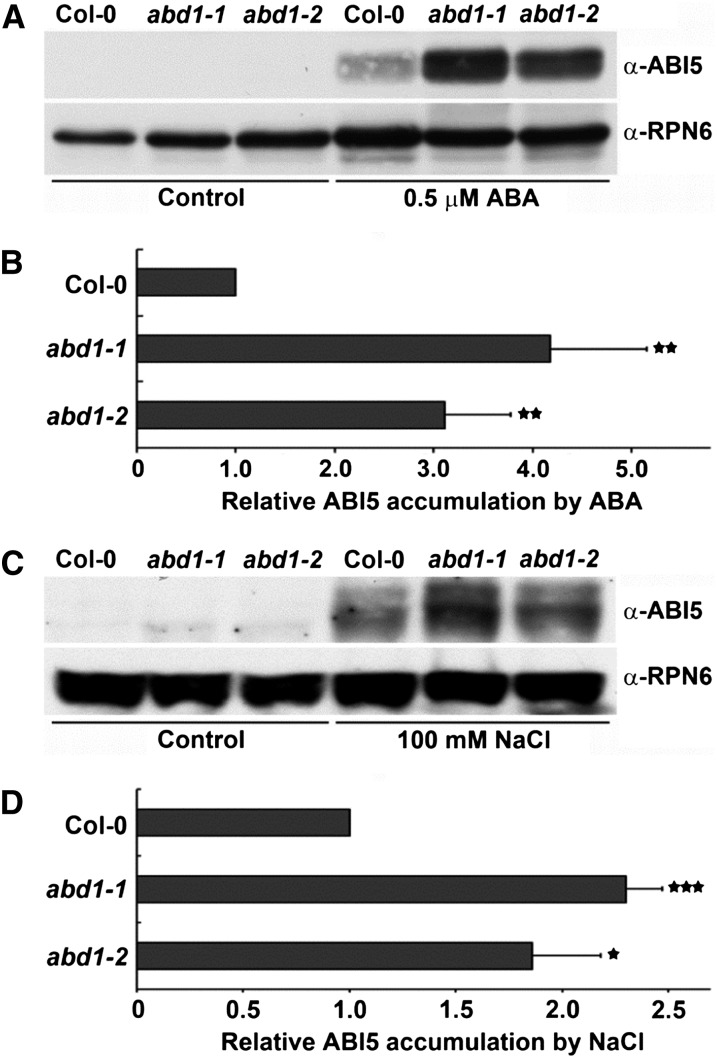
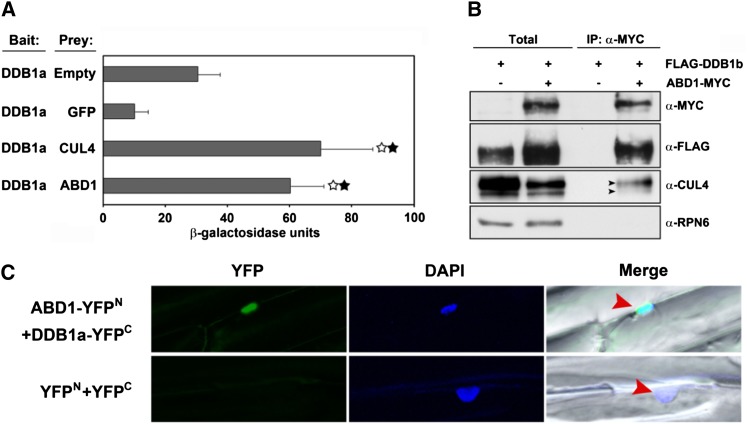
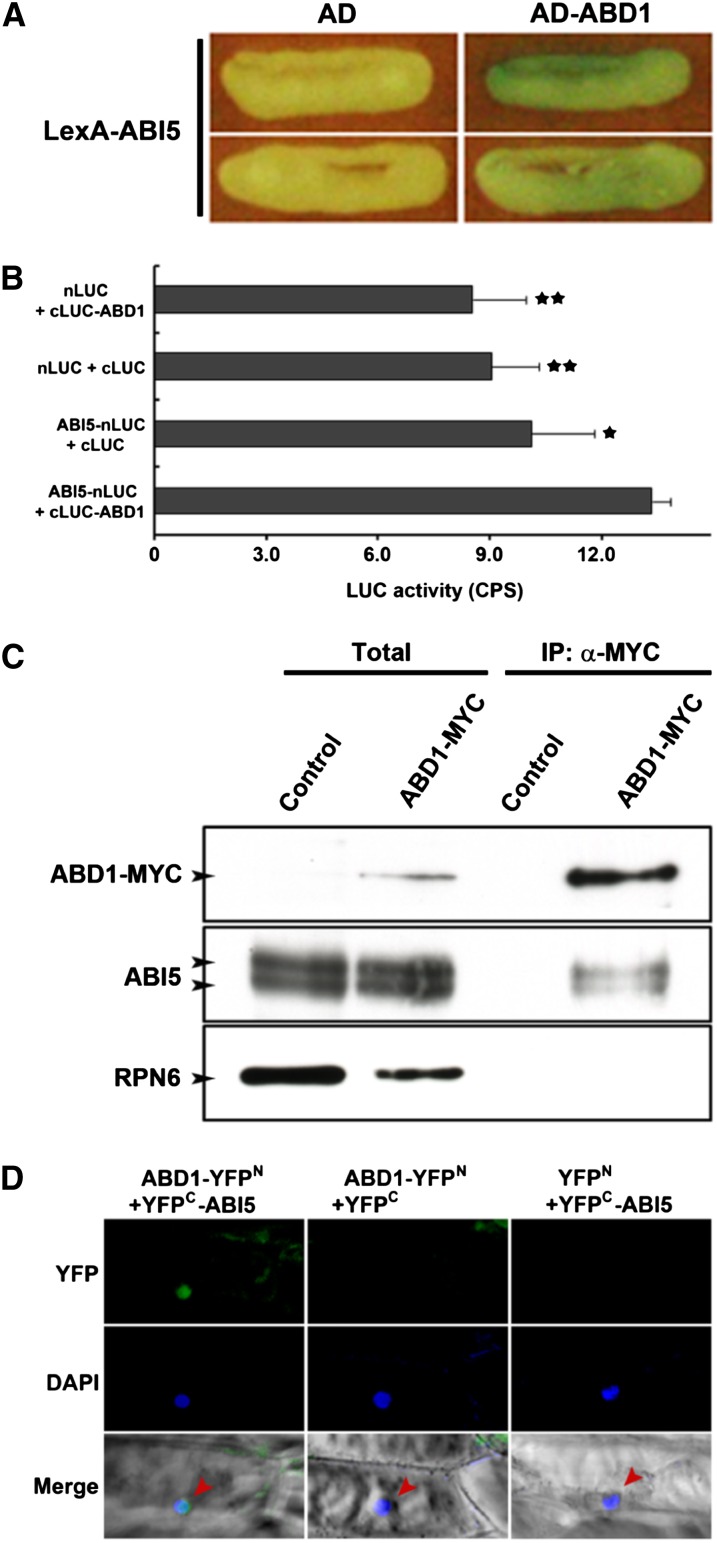
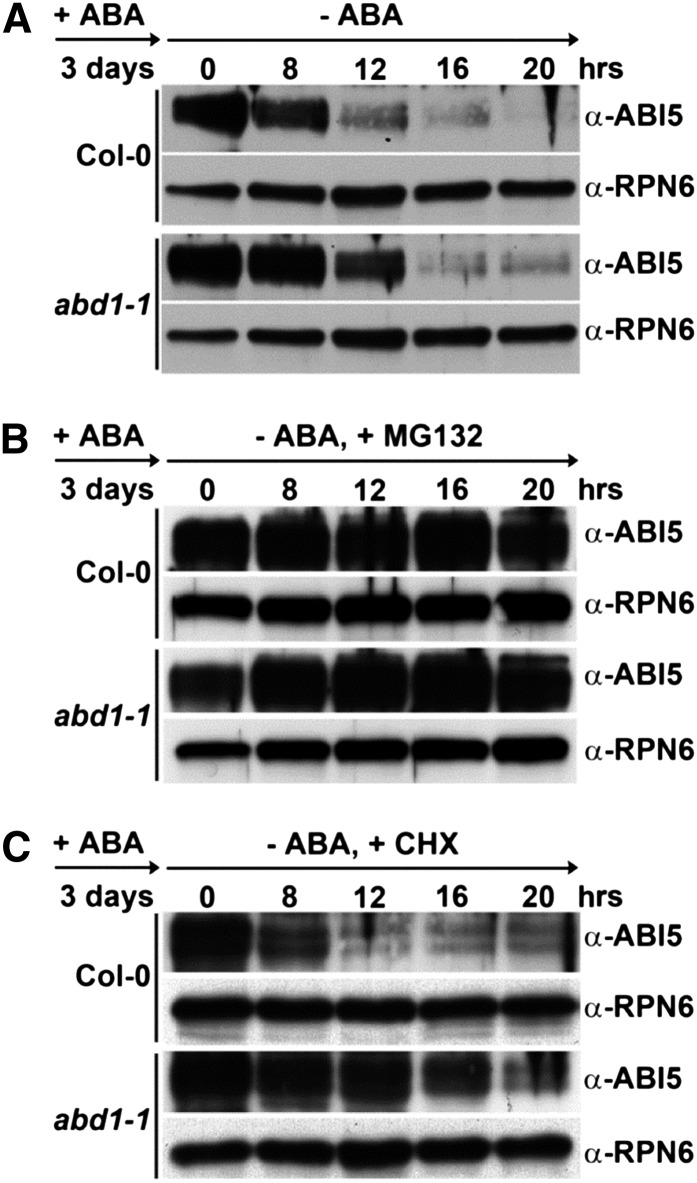
Members of the DDB1-CUL4-associated factors (DCAFs) family directly bind to DAMAGED DNA BINDING PROTEIN1 (DDB1) and function as the substrate receptors in CULLIN4-based E3 (CUL4) ubiquitin ligases, which regulate the selective ubiquitination of proteins. Here, we describe a DCAF protein, ABD1 (for ABA-hypersensitive DCAF1), that negatively regulates abscisic acid (ABA) signaling in Arabidopsis thaliana. ABD1 interacts with DDB1 in vitro and in vivo, indicating that it likely functions as a CUL4 E3 ligase substrate receptor. ABD1 expression is induced by ABA, and mutations in ABD1 result in ABA- and NaCl-hypersensitive phenotypes. Loss of ABD1 leads to hyperinduction of ABA-responsive genes and higher accumulation of the ABA-responsive transcription factor ABA INSENSITIVE5 (ABI5), hypersensitivity to ABA during seed germination and seedling growth, enhanced stomatal closure, reduced water loss, and, ultimately, increased drought tolerance. ABD1 directly interacts with ABI5 in yeast two-hybrid assays and associates with ABI5 in vivo by coimmunoprecipitation, and the interaction was found in the nucleus by bimolecular fluorescence complementation. Furthermore, loss of ABD1 results in a retardation of ABI5 degradation by the 26S proteasome. Taken together, these data suggest that the DCAF-CUL4 E3 ubiquitin ligase assembled with ABD1 is a negative regulator of ABA responses by directly binding to and affecting the stability of ABI5 in the nucleus.


Figures

Figure 1.
Figure 1.
Schematic Structure of ABD1 and Isolation of abd1-1 and abd1-2. (A) The genomic structure and T-DNA insertions in Arabidopsis ABD1. Exons are depicted as colored boxes, introns are represented by lines, and pale-blue boxes represent the 5′- and 3′-untranslated regions. The T-DNA insertion sites, abd1-1 and abd1-2, are represented by open inverted triangles. Genotyping and transcript analysis of abd1-1 and abd1-2. RPN6 primers were used as an internal control for the both the genotyping and transcript analyses. RT-PCR analysis of the ABD1 transcript was performed in wild-type, abd1-1, and abd1-2 mutant seedlings. (B) Protein structure of ABD1 depicting the predicted WD40 region in red and the WDxR motif in yellow. (C) Quantitative PCR analysis of ABD1 expression in 7-d-old Col-0 wild-type seedlings in the absence or presence of 1 or 2 μM ABA. Values are means ± sd (n = 3). Significant difference was determined by a Student’s t test; single or double stars indicate a P value of <0.05 or <0.01, respectively.
Figure 2.
Figure 2.
ABD1 Is Required for Normal Seed Germination and Postgerminative Growth in Response to ABA and NaCl. (A) Visual comparison of Col-0, abd1-1, and abd1-2 seed germination and postgerminative growth after 7 d in the absence or presence of 0.5 μM ABA, 1 μM ABA, or 100 mM NaCl. (B) Col-0 wild type, abd1-1, and abd1-2 were grown for 5 d on an increasing concentration of ABA, after which the germination rate was determined. Mean ± sd values were determined from three replicates (n = 144). (C) to (E) Germination rate of Col-0 wild type, abd1-1, and abd1-2 over 7 d in the absence (C) or presence (D) of 0.5 μM ABA or 100 mM NaCl (E). Mean ± sd values were determined from three replicates (n = 144).
Figure 3.
Figure 3.
ABA and NaCl Responses of Col-0 Wild-Type, abd1-1, and abd1-2 Plants in Terms of Seedling Growth. (A) ABA and NaCl hypersensitivity of abd1-1 and abd1-2. Root growth of Col-0 wild type, abd1-1, and abd1-2 that were vertically grown on MS medium in the absence or presence of 0.5 µM ABA or 100 mM NaCl for 7 d. Values are mean ± sd (n = 12). Significant difference was determined by a Student’s t test; a star indicates a P value of <0.0001. (B) Root growth inhibition of seedlings in the presence ABA. Seedlings were grown for 3 d on MS plates and then transferred to 0 or 5 μM ABA. After 5 d of growth, photographs were taken and root lengths were measured. Values are means ± sd (n = 10). Significant difference was determined by a Student’s t test; a star indicates a P value of <0.0001. (C) Cotyledon greening of Col-0 wild type, abd1-1, and abd1-2. Seedlings were germinated and grown on MS plates in the absence or presence of 0.5 µM ABA or 100 mM NaCl for 7 d, after which photographs were taken. Cotyledon greening percentage was determined from an average of >100 seeds with three independent experiments. Values are means ± sd (n = 144). Significant difference was determined by a Student’s t test; a star indicates a P value of <0.0001.
Figure 4.
Figure 4.
Loss of ABD1 Confers Increased Drought Tolerance. (A) ABA-induced stomatal closure of Col-0 wild type, abd1-1, and abd1-2. Epidermal peels from Col-0 wild type, abd1-1, and abd1-2 were measured for stomatal aperture in response to ABA as described by Li et al. (2011). (B) Relative stomatal aperture compared with that on ABA-free medium. Results are from three replicates, and values represent means ± sd (n = 30). Significant difference was determined by a Student’s t test; single and double stars indicate a P value 0.01 ≤ P < 0.05 and P < 0.01, respectively. (C) Water loss assay of Col-0 wild type, abd1-1, and abd1-2 detached leaves. Results are from three replicates, and values represent means ± sd (n = 3). Statistically significant difference was determined by a Student’s t test; single, double, and triple stars indicate P values of <0.05, <0.005, and <0.001, respectively. (D) Drought tolerance assay of 3-week-old Col-0 wild-type, abd1-1, and abd1-2 plants was performed by withholding water for 12 d and subsequently rewatering and examining after 1 d. Values represent means ± sd (n = 132). Significant difference was determined by a Student’s t test; triple stars indicate a P value of <0.0001. (E) Representative plants from drought tolerance assay described in (D).
Figure 5.
Figure 5.
abd1-1 and abd1-2 Seedlings Have Increased Expression of Abiotic Stress–Responsive Genes after ABA and NaCl Treatment. Seven-day-old Col-0 wild-type, abd1-1, and abd1-2 seeds were grown in the absence or presence of 0.5 μM ABA or 100 mM NaCl. mRNA levels were determined by quantitative real-time PCR analysis. Relative amounts of transcripts were normalized to the levels of ACTIN2 within the same sample. Results are from three biological replicates and values represent means ± sd (n = 9). Statically significant difference was determined by a Student’s t test; triple black stars indicate a significant difference between the wild type and the abd1 mutants (P < 0.0001). (A) RD29A after ABA treatment. (B) RD29A after NaCl treatment. (C) RD29B after ABA treatment. (D) RD29B after NaCl treatment. (E) ABI5 after ABA treatment.
Figure 6.
Figure 6.
ABD1 Represses the Accumulation of ABI5 Protein. (A) Col-0 wild type, abd1-1, and abd1-2 were grown on MS plates in the absence or presence of 0.5 µM ABA for 7 d. Proteins were extracted and ABI5 protein level was determined by immunoblot assay. The ABI5 bands represent the two predominant forms of ABI5. (B) Quantification of immunoblot assay. Relative amounts of ABI5 protein were normalized to the levels of RPN6 within the same sample. (C) Col-0 wild type, abd1-1, and abd1-2 were grown on MS plates in the absence or presence of 100 mM NaCl for 7 d. Proteins were extracted and ABI5 protein level was determined by immunoblot assay. (D) Quantification of immunoblot assay. Relative amounts of ABI5 protein were normalized to the levels of RPN6 within the same sample. Values are means ± sd (n = 3). Significant difference was determined by a Student’s t test; single, double, or triple stars indicate a P value of <0.05, <0.009, and <0.0001, respectively.
Figure 7.
Figure 7.
ABD1 Directly Interacts with DDB1. (A) Interaction between ABD1 and DDB1a by yeast two-hybrid assays. Assays were performed with ABD1 protein as prey and DDB1a as bait for monitoring their interactions. CUL4 was used as positive control, while empty vector and GFP were used as negative controls. β-Galactosidase activities were quantified after growing yeast strains in liquid culture using o-nitrophenyl-β-d-galactopyranoside as a substrate. Values are means ± sd (n = 3). Statistically significant difference was determined by a Student’s t test; white stars indicate a significant difference between the empty vector as prey (P < 0.02), and black stars indicate a significant difference between GFP as prey (P < 0.005). (B) In vivo co-IP of ABD1 and DDB1b. Transgenic Arabidopsis plants overexpressing FLAG-tagged DDB1b with or without MYC-tagged ABD1 were used to detect the interaction between ABD1 and DDB1b. An α-MYC affinity matrix was used for immunoprecipitation, and α-FLAG and α-MYC antibodies were used for immunoblotting. The immunoblot used RPN6 as an internal control. Total: 5 μg of total proteins from FLAG-DDB1b and FLAG-DDB1b; ABD1-MYC transgenic lines were loaded in each lane and were used as a control for the corresponding co-IP assays. (C) BiFC assay showing ABD1 directly interacts with DDB1a in the nucleus. Onion (Allium cepa) epidermal cells coexpressing ABD1-YFPN and DDB1a-YFPC fusion proteins through cobombardment. The nucleus, depicted in blue, is stained with 4′,6-diamidino-2-phenylindole (DAPI). The arrows indicate the nucleus in the merged image.
Figure 8.
Figure 8.
ABD1 Directly Interacts with ABI5. (A) Interaction between ABD1 and ABI5 by yeast two-hybrid assays. Assays were performed with ABD1 protein as prey and ABI5 as bait for monitoring their interactions. Empty vector was used as a negative control. Yeast was grown in the presence of X-Gal for 26 h, after which images were taken. (B) LCI assays showing that ABD1 and ABI5 interact in N. benthamiana leaf cells. Values are means ± sd (n = 3). Significant difference was determined by a Student’s t test; single or double stars indicate P values of <0.01 or <0.0007, respectively. (C) In vivo co-IP of ABD1 and ABI5. Transgenic Arabidopsis plants overexpressing MYC-tagged ABD1 were used to detect the interaction between ABD1 and ABI5. An α-MYC affinity matrix was used for immunoprecipitation. α-MYC and α-ABI5 antibodies were used for immunoblotting. The immunoblot used RPN6 as an internal control. Control, Col-0 wild type was used as a negative control; Total, 5 μg of total proteins from Col-0 wild type and the ABD1-MYC transgenic line were loaded in each lane and were used as a control for the corresponding co-IP assays. (D) BiFC assay showing ABD1 directly interacts with ABI5 in the nucleus. Onion epidermal cells coexpressing ABD1-YFPN and YFPC-ABI5 fusion proteins through cobombardment. The nucleus, depicted in blue, is stained with 4′,6-diamidino-2-phenylindole (DAPI). The arrows indicate the nucleus in the merged image.
Figure 9.
Figure 9.
ABI5 Protein Degradation after ABA Removal Requires ABD1. Immunoblot assays of ABI5 protein in Col-0 wild-type and abd1-1 seeds that were treated with 5 µM ABA in white light for 3 d and then harvested at the indicated times after the removal of ABA by either being washed out with liquid medium (A) or liquid medium supplemented with the proteasome inhibitor MG132 (50 µM) (B) or the protein synthesis inhibitor CHX (100 µM) (C). A total of 10 µg was used in each lane. RPN6 was used as a loading control. Experiments were repeated three times with similar results.

Similar articles

Cited by

References

    1. Abe H., Urao T., Ito T., Seki M., Shinozaki K., Yamaguchi-Shinozaki K. (2003). Arabidopsis AtMYC2 (bHLH) and AtMYB2 (MYB) function as transcriptional activators in abscisic acid signaling. Plant Cell 15: 63–78. - PMC - PubMed
    1. Agarwal P.K., Agarwal P., Reddy M.K., Sopory S.K. (2006). Role of DREB transcription factors in abiotic and biotic stress tolerance in plants. Plant Cell Rep. 25: 1263–1274. - PubMed
    1. Angers S., Li T., Yi X., MacCoss M.J., Moon R.T., Zheng N. (2006). Molecular architecture and assembly of the DDB1-CUL4A ubiquitin ligase machinery. Nature 443: 590–593. - PubMed
    1. Arroyo A., Bossi F., Finkelstein R.R., Leon P. (2003). Three genes that affect sugar sensing (abscisic acid insensitive 4, abscisic acid insensitive 5, and constitutive triple response 1) are differentially regulated by glucose in Arabidopsis. Plant Physiol. 133: 231–242. - PMC - PubMed
    1. Aubert Y., Vile D., Pervent M., Aldon D., Ranty B., Simonneau T., Vavasseur A., Galaud J.P. (2010). RD20, a stress-inducible caleosin, participates in stomatal control, transpiration and drought tolerance in Arabidopsis thaliana. Plant Cell Physiol. 51: 1975–1987. - PubMed

Publication types

MeSH terms

LinkOut - more resources