. 2014 Apr 4;289(14):9766-80.
doi: 10.1074/jbc.M114.557066. Epub 2014 Feb 21.

Trans-activation response (TAR) RNA-binding protein 2 is a novel modulator of transient receptor potential canonical 4 (TRPC4) protein

Affiliations

Trans-activation response (TAR) RNA-binding protein 2 is a novel modulator of transient receptor potential canonical 4 (TRPC4) protein

Jasmin Zimmermann et al. J Biol Chem. .

Abstract

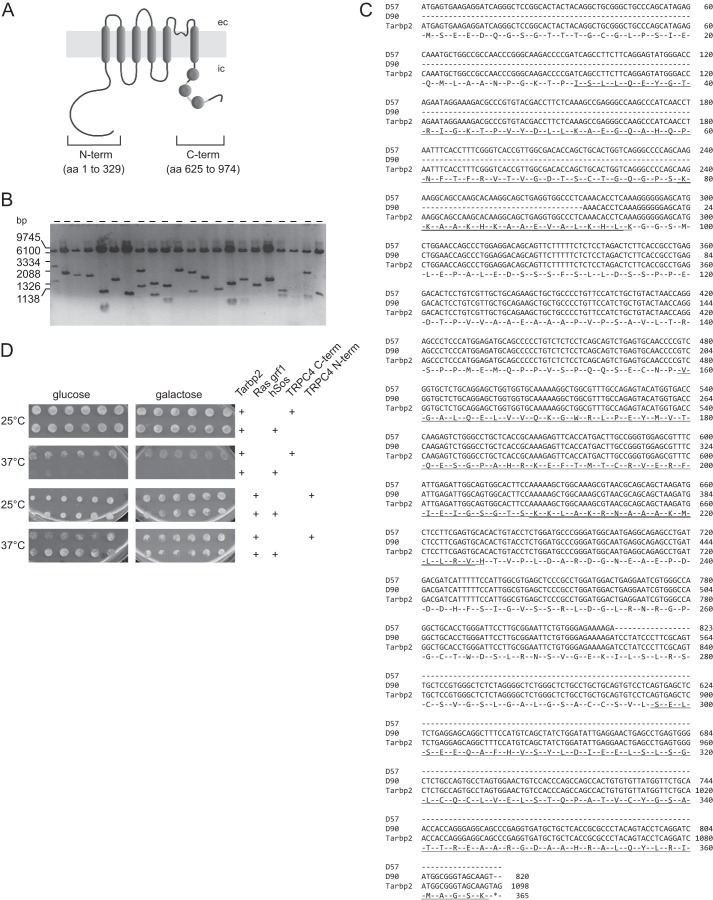
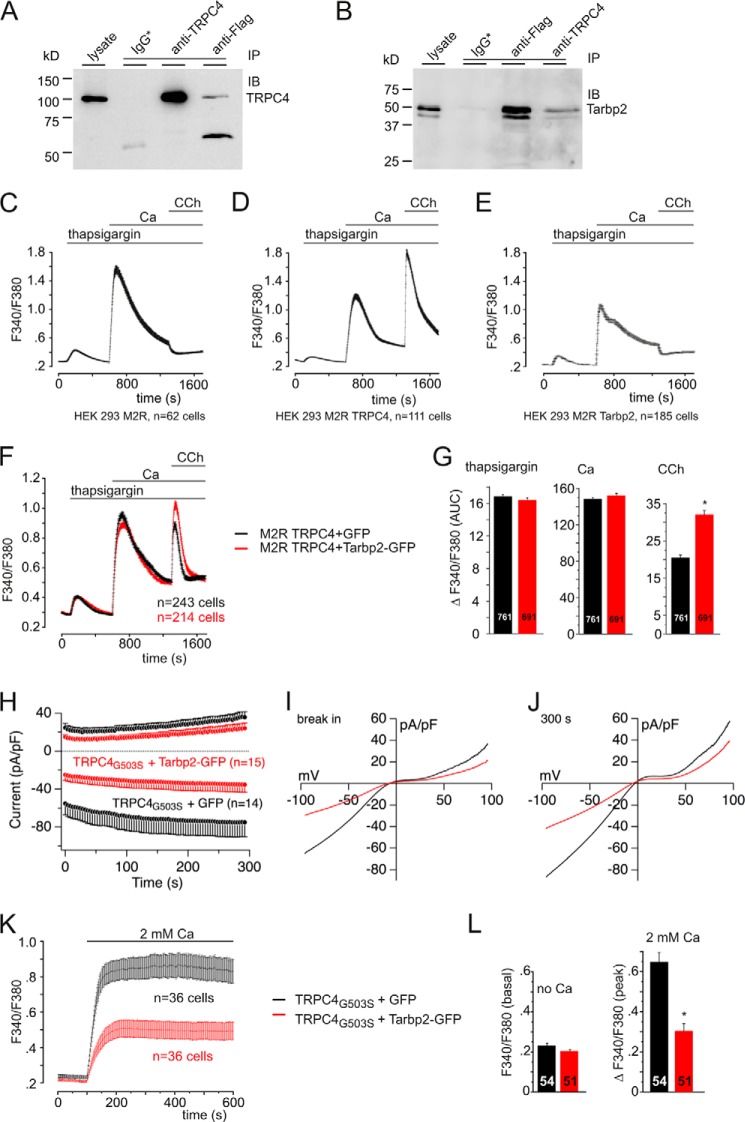
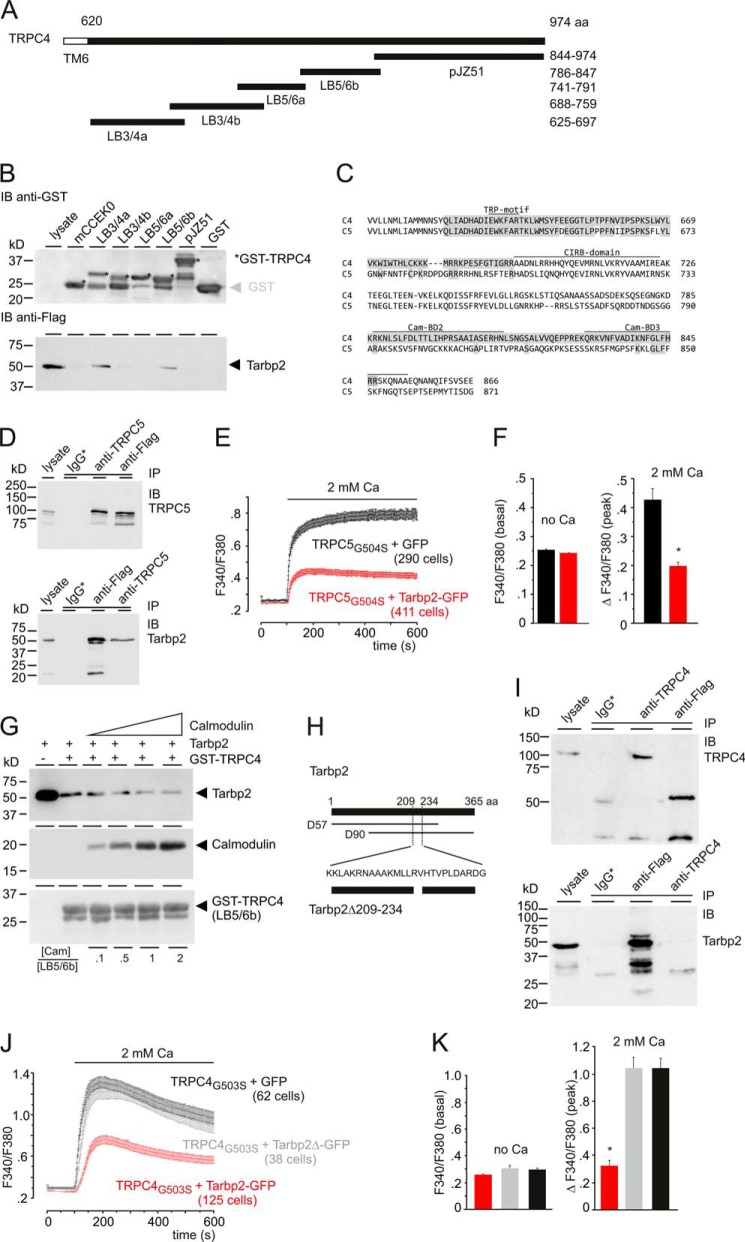
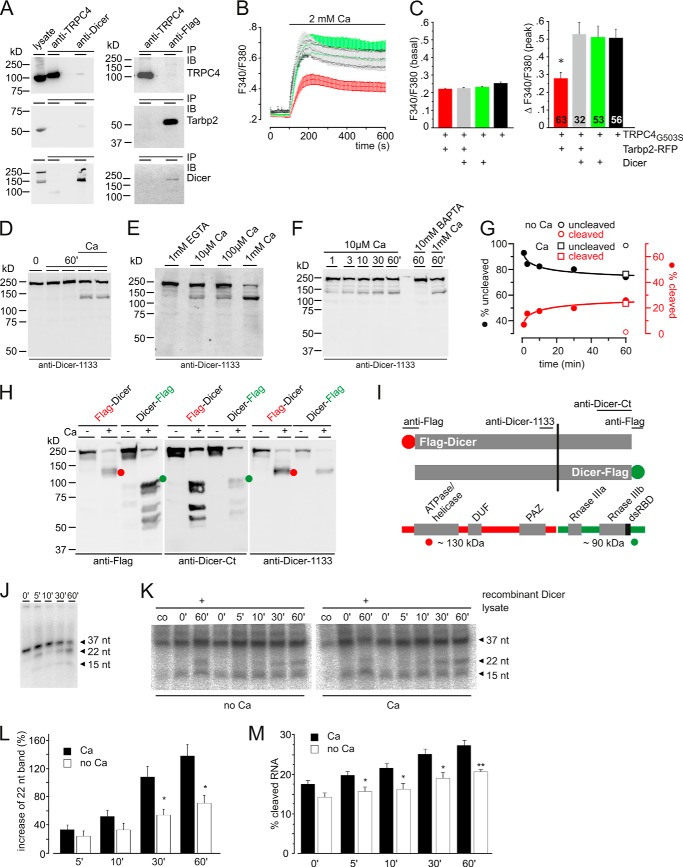
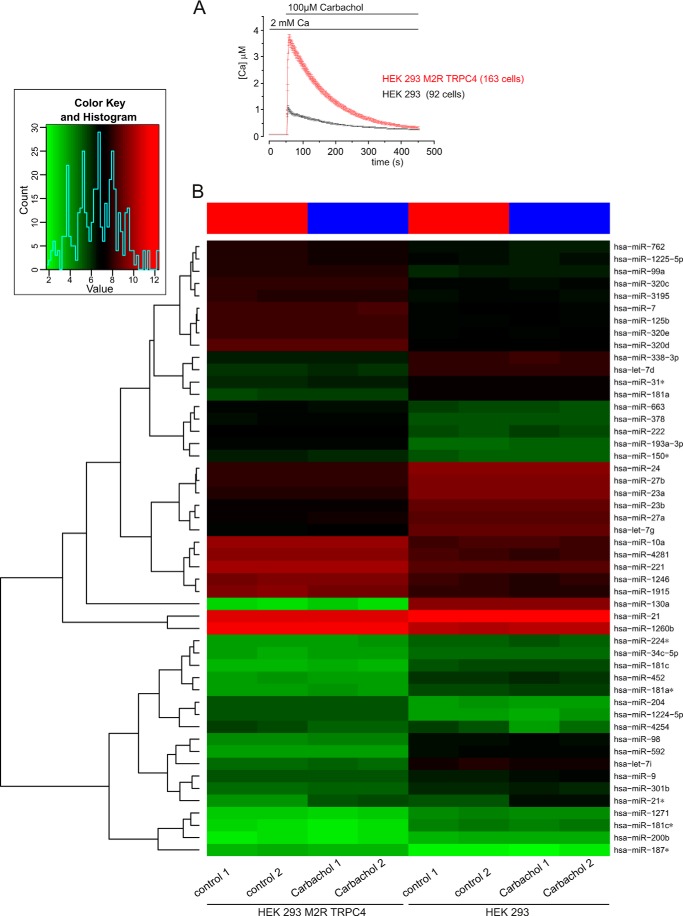
TRPC4 proteins function as Ca(2+) conducting, non-selective cation channels in endothelial, smooth muscle, and neuronal cells. To further characterize the roles of TRPC4 in vivo, detailed information about the molecular composition of native channel complexes and their association with cellular signaling networks is needed. Therefore, a mouse brain cDNA library was searched for novel TRPC4-interacting proteins using a modified yeast two-hybrid assay. This screen identified Trans-activation Response RNA-binding protein 2 (Tarpb2), a protein that recruits the Dicer complex to Ago2 for microRNA processing and gene silencing. Tarbp2 was found to bind to the C terminus of TRPC4 and TRPC5 and to modulate agonist-dependent TRPC4-induced Ca(2+) entry. A stretch of basic residues within the Tarbp2 protein is required for these actions. Tarbp2 binding to and modulation of TRPC4 occurs in the presence of endogenously expressed Dicer but is no longer detectable when the Dicer cDNA is overexpressed. Dicer activity in crude cell lysates is increased in the presence of Ca(2+), most probably by Ca(2+)-dependent proteolytic activation of Dicer. Apparently, Tarbp2 binding to TRPC4 promotes changes of cytosolic Ca(2+) and, thereby, leads to a dynamic regulation of Dicer activity, essentially at low endogenous Dicer concentrations.

Keywords: Calcium Signaling; Cell Signaling; Dicer; Protein-Protein Interactions; TRP Channels.


Figures

FIGURE 1.
FIGURE 1.
Yeast two-hybrid screen to identify protein binding partners of TRPC4. A, the TRPC4 protein comprises six predicted transmembrane domains. The cDNAs encoding the cytosolic domains of the TRPC4 N- and C terminus were used as prey. Disks within the C terminus indicate calmodulin binding domains 1, 2, and 3. ec, extracellular; ic, intracellular. B, control of insert sizes of the mouse brain cDNA library used as bait in the screen. Twenty-two randomly selected cDNA clones were run on agarose gel (6.1-kb fragment, pMyr vector without insert after EcoRI/XhoI cut). C, alignment of the two independent cDNA clones D57 and D90 of Tarbp2 identified in the screen (Tarbp2 GenBankTM accession number NM_009319). Underlined are dsRBD1 (aa 32 to 96), dsRBD2 (aa153 to 225), and a third domain bearing structural homology to the dsRBDs (aa 289 to 386); double underlined are the KR-helix motifs within dsRBD1 and dsRBD2. D, results of retransformation to check the interaction of the bait and prey proteins. Plasmids were retransformed into the temperature-sensitive yeast strain cdc25H. The expression of the bait proteins is under the control of the GAL1 promoter, so the expression is repressed on glucose and activated by galactose. The yeast strain is temperature-sensitive, and the interaction of bait and prey protein rescue this phenotype, which leads to growth at the restrictive temperature of 37 °C. As a control, the yeast strain cdc25H was cotransformed with the bait plasmids and the pSos vector. Six clones of each transformation were plated on dropout medium containing glucose or galactose, respectively. The clone coding for Ras grf1 was found with the TRPC4 N terminus. The retransformation showed that the Ras grf1 clone was able to grow on galactose at 37 °C without the prey protein (TRPC4 N terminus), indicating a false positive interaction. The Tarbp2 clone exhibited a positive interaction with the TRPC4 C terminus (growth on galactose at 37 °C but not with pSos alone).
FIGURE 2.
FIGURE 2.
Tarbp2 interacts with TRPC4 and modulates TRPC4 activity. A and B, Western blot analysis showing reciprocal immunoprecipitation (IP) after coexpressing the FLAG-tagged Tarbp2 and TRPC4 cDNAs in HEK293 cells using the anti-TRPC4 and anti-FLAG antibodies. Immunoblots (IB) were incubated with antibodies for TRPC4 (A) and FLAG (B), respectively. IgG*, nonspecific mouse (A) or rabbit IgGs (B) used for control precipitations. C–E, changes of cytosolic [Ca2+] in Fura-2-loaded HEK cells stably expressing the cDNAs of the metabotropic M2R (C), of the metabotropic M2R and TRPC4 (M2R TRPC4, D), and in Fura-2-loaded M2R cells coexpressing the Tarbp2 cDNA (E). CCh, carbachol. F and G, Tarbp2 increases carbachol-induced (100 μm), TRPC4-dependent Ca2+ entry (red trace) without affecting Ca2+ release in the presence of thapsigargin and in nominally Ca2+-free bath solution or Ca2+ entry after readdition of extracellular Ca2+ (F). The Tarbp2-IRES-GFP vector (red trace) and the IRES-GFP vector (black trace) as control were coexpressed in M2R TRPC4α cells. G, summary of three experiments like the one in F. Data are mean ± S.E. with the number of cells indicated. *, p < 0.001. AUC, area under the curve. H–J, Tarbp2 (red traces) reduces the fully activated current of TRPC4G503S mutant channels. H, inward and outward currents at −80 and 80 mV, respectively, from HEK293 cells expressing TRPC4G503S 24 h after induction plotted versus time in the absence (black traces) and in the presence of coexpressed Tarbp2-IRES-GFP cDNA (red trace). pA, picoampere; pF, picofarad. Shown are corresponding current-voltage relationships immediately after break-in (I) and after 300 s (J). n, number of cells. K and L, HEK293 cells expressing TRPC4G503S (18 h after induction) and coexpressing IRES-GFP (black trace) as control or the Tarbp2-IRES-GFP cDNA (red trace) were loaded with Fura-2-AM and kept in nominally Ca2+-free bath solution. Ca2+ influx was challenged by adding 2 mm Ca2+ to the bath solution, and the cytosolic [Ca2+], represented by the Fura-2 fluorescence ratio (F340/F380), was measured versus time (K). Note that no agonist is present. L, summary of two experiments. Data are mean ± S.E. The number of cells is indicated. *, p < 0.001.
FIGURE 3.
FIGURE 3.
Identification of the aa sequences involved in Tarbp2-TRPC4 binding. A, TRPC4-GST fusion proteins covering the TRPC4 C terminus (aa 625–974). Numbers indicate aa residues. TM6, predicted transmembrane segment 6. B, pulldown of the Tarbp2 protein from HEK cell lysates by the recombinant TRPC4-GST fusion proteins (12 μg each) and GST (control) bound to GSH-Sepharose. Shown is an immunoblot (IB) using antibody for GST (top panel) and for FLAG-tagged Tarbp2 (bottom panel), respectively. The asterisk indicates GST-TRPC4 fusion proteins of expected Mr. C, alignment of parts of the C termini of TRPC4 and TRPC5 covering the sequences of the two Tarbp2-binding domains LB3/4a and LB5/6b (shaded in gray) identified in B. The positions of the TRP-motif, the CIRB-domain, and calmodulin-binding domains (Cam-BD) 2 and 3 are indicated. D, Western blot analyses showing reciprocal immunoprecipitation (IP) after coexpressing the FLAG-tagged Tarbp2 and TRPC5 cDNAs in HEK293 cells using the anti-TRPC5 and anti-FLAG antibodies. Immunoblots were incubated with antibodies for TRPC5 (top panel) and FLAG (bottom panel), respectively. IgG*, nonspecific IgGs used for control precipitations. E, HEK293 cells expressing TRPC5G504S (19 h after induction) and coexpressing the IRES-GFP (black trace) as control or the Tarbp2-IRES-GFP cDNA (red trace) were loaded (48 h after transfection) with Fura-2-AM and kept in nominally Ca2+-free bath solution. Ca2+ influx was challenged by adding 2 mm Ca2+ to the bath solution, and the cytosolic [Ca2+], represented by the Fura-2 fluorescence ratio (F340/F380) was measured versus time. Note that no agonist is present. F, summary. Data are mean ± S.E. *, p < 0001. G, calmodulin competes with Tarbp2 for TRPC4 binding. Shown is a pulldown of the Tarbp2 protein from HEK cell lysates by the recombinant TRPC4-GST fusion protein LB5/6b (12 μg) in the absence and presence of increasing amounts of calmodulin (0.59, 2.97, 5.95, and 11.9 μg). Immunoblots with antibodies for Tarbp2-FLAG (top), calmodulin (center) and GST (bottom) are shown. The molar ratio [Cam]/[LB5/6b] is as indicated. H–K, amino acid sequence of Tarbp2 required for binding of Tarbp2 to TRPC4. H, positions of aa residues are indicated by numbers, D57 and D90 indicate cDNA clones identified and isolated in the screen. The aa residues deleted in Tarbp2Δ209–234, common to both D90 and D57, are indicated. I, Western blot analyses. Both proteins, TRPC4 and Tarbp2Δ209–234, are detectable in cell lysate. Shown is immunoprecipitation after coexpressing the FLAG-tagged Tarbp2Δ209–234 and TRPC4 cDNAs in HEK293 cells using the anti-TRPC4 and anti-FLAG antibodies. Immunoblots were incubated with antibodies for TRPC4 (top panel) and FLAG (bottom panel), respectively. IgG*, nonspecific mouse (top panel) and rabbit IgGs (bottom panel) used for control precipitations. J, HEK-293 cells expressing TRPC4G503S (18 h after induction) and coexpressing IRES-GFP (black) as control, Tarbp2-IRES-GFP cDNA (red), or Tarbp2Δ209–234-IRES-GFP cDNA (gray) were loaded with Fura-2/AM and kept in nominally Ca2+-free bath solution. Ca2+ influx was challenged by adding 2 mm Ca2+ to the bath solution, and the cytosolic [Ca2+], represented by the Fura-2 fluorescence ratio (F340/F380), was measured versus time. Note that no agonist is present. K, summary of J. Data are mean ± S.E. *, p < 0.001.
FIGURE 4.
FIGURE 4.
Interplay of Tarbp2, TRPC4, and Dicer. A, Western blot analyses. All proteins, TRPC4, Tarbp2, and Dicer, are detectable in cell lysate. Immunoprecipitation (IP) after coexpressing the cDNAs of FLAG-tagged Tarbp2, TRPC4, and Dicer in HEK293 cells using the anti-TRPC4, anti-Dicer, and anti-FLAG antibodies is shown. Immunoblots (IB) were incubated with antibodies for TRPC4 (top), Tarbp2-FLAG (center), and Dicer (bottom), respectively. B, HEK293 cells expressing TRPC4G503S (19 h after induction) and coexpressing the cDNAs of IRES-GFP plus TagRFP-T (black) as control, Tarbp2-TagRFP-T plus Dicer-GFP (gray), Dicer-GFP plus TagRFP-T (green), or Tarbp2-IRES-GFP plus TagRFP-T cDNA (red) were loaded (48 h after transfection) with Fura-2/AM and kept in nominally Ca2+-free bath solution. Ca2+ influx was challenged by adding 2 mm Ca2+ to the bath solution, and the cytosolic [Ca2+], represented by the fura-2 fluorescence ratio (F340/F380), was measured versus time. C, summary. Data are mean (peak after addition of Ca2+) ± S.E. *, p < 0.001. D, Ca2+-dependent cleavage of endogenous Dicer in HEK293/M2R/TRPC4 cells using Ca2+-free lysate buffer. Lysates (in duplicate) were incubated in the absence and presence of 2 mm Ca2+ for 60 min. Proteins were run on SDS-PAGE and blotted to a filter membrane, which was incubated with antibody for Dicer. E, Dicer cleavage in the absence and in the presence of increasing [Ca2+]. F and G, time course of cleavage in the presence of 10 μm Ca2+. F, Western blot analysis. G, densitometric analyses of band intensities. ○, values in the presence of 10 mm BAPTA (no Ca), 60 min; □, values in the presence of 1 mm Ca (Ca), 60 min. H, mapping of the Ca2+-dependent cleavage site using N-terminal (red) and C-terminal (green) FLAG-tagged human Dicer (expressed in HEK/M2R/TRPC4 cells) and antibodies for FLAG (anti-FLAG) and Dicer (anti-Dicer-Ct and anti-Dicer-1133). Cell lysates were prepared in the absence (−, 1 mm EGTA) and presence (+) of 1 mm Ca2+, and proteins were run on SDS-PAGE, blotted, and incubated with the indicated antibodies. Red, N-terminal tagged Dicer fragment; green, C-terminal tagged Dicer fragment. The red and green circles indicate the proteolytic fragment comprising the N-terminal (red) or C-terminal tag (green). I, summary of mapping experiments. Ca2+-dependent cleavage yields ∼130 (red) and ∼90 kDa (green) fragments that are visible in addition to the uncleaved full-length protein of ∼220 kDa (in H). The cleavage site maps near serine 1150 of human Dicer. J, time dependence of recombinant Dicer cleavage of the double-stranded, 37-bp RNA template 5′-phosphorylated at a single strand. Samples were run on polyacrylamide/urea gels and exposed to a PhosphorImager screen. K, Dicer activity at the time points indicated in HEK293 M2R TRPC4 lysates in the absence and presence of 2 mm Ca2+ using the double-stranded 37ab RNA as a template (3000 cpm/tube). As controls, the double-stranded 37-bp RNA template was applied without lysate (co), and recombinant Dicer (0.5 units) was spiked. Samples were run on polyacrylamide/urea gels and exposed to a PhosphorImager screen. L and M, densitometric analysis of Dicer-dependent cleavage of the double-stranded 37ab RNA. L, intensity of the 22-nt product in K normalized to the intensity of the 22-nt product obtained by recombinant Dicer in the absence of Ca2+. Data are the mean of four independent experiments ± S.E. *, p < 0.05. M, the percentage of cleaved dsRNA 37ab in K as calculated by the arbitrary units obtained by densitometric analysis of the 37- (a), 22- (b), and 15-nt (c) bands (percent of dsRNA 37ab cleavage = ((b + c) × 100)/(a + b + c)). Data are the mean of four independent experiments ± S.E. *, p < 0.05; **, p < 0.01.
FIGURE 5.
FIGURE 5.
miRNA expression in TRPC4-expressing cells. A, monitoring cytosolic [Ca2+] in the presence of carbachol. B, heat map of miRNAs derived from cells that were grown in the absence or presence of carbachol. HEK293/M2R/TRPC4 cells and HEK 293 cells were incubated in the presence of 100 μm carbachol for 15 min. Controls were performed without carbachol treatment for both HEK293/M2R/TRPC4 cells and HEK 293 cells. Each experiment was done in duplicate (carbachol 1/2 and control 1/2). miRNA expression was analyzed using SurePrint 8 × 60K human v16 miRNA microarrays (Agilent) that contained 40 replicates of 1205 miRNAs. A heat map was generated using the 50 miRNAs with highest expression variance over all samples. The miRNA expression values are visualized by the red-green color code, where green means low expression and red means high expression. The samples (with/without carbachol) are arranged in columns and the 50 selected miRNAs in rows. The heat map shows that HEK293/M2R/TRPC4 cells and HEK 293 cells cluster separately, indicating that each cell line has a specific miRNA expression pattern. For each cell line there is a clear differentiation between the carbachol treatments and controls, as indicated by the red (controls) and blue (carbachol) bars at the top of the heat map. The duplicates cluster closely together, indicating the high reproducibility of the data. The dendrogram on the left side of the heat map shows miRNAs clusters on the basis of the similarity of their expression levels. Inset, summary of the overall distribution of all miRNA counts according to their expression level, with the lowest expression level in green and the highest expression in red.

References

    1. Philipp S., Cavalié A., Freichel M., Wissenbach U., Zimmer S., Trost C., Marquart A., Murakami M., Flockerzi V. (1996) A mammalian capacitative calcium entry channel homologous to Drosophila TRP and TRPL. EMBO J. 15, 6166–6171 - PMC - PubMed
    1. Gees M., Colsoul B., Nilius B. (2010) The role of transient receptor potential cation channels in Ca2+ signaling. Cold Spring Harb. Perspect. Biol. 2, a003962. - PMC - PubMed
    1. Wu L. J., Sweet T. B., Clapham D. E. (2010) International Union of Basic and Clinical Pharmacology. LXXVI. Current progress in the mammalian TRP ion channel family. Pharmacol. Rev. 62, 381–404 - PMC - PubMed
    1. Flockerzi V. (2007) An introduction on TRP channels. Handb. Exp. Pharmacol. 179, 1–19 - PubMed
    1. Munsch T., Freichel M., Flockerzi V., Pape H. C. (2003) Contribution of transient receptor potential channels to the control of GABA release from dendrites. Proc. Natl. Acad. Sci. U.S.A. 100, 16065–16070 - PMC - PubMed

Publication types

MeSH terms

LinkOut - more resources