. 2014 Apr 11;289(15):10592-10606.
doi: 10.1074/jbc.M113.523068. Epub 2014 Feb 21.

Cross-talk between two essential nutrient-sensitive enzymes: O-GlcNAc transferase (OGT) and AMP-activated protein kinase (AMPK)

Affiliations

Cross-talk between two essential nutrient-sensitive enzymes: O-GlcNAc transferase (OGT) and AMP-activated protein kinase (AMPK)

John W Bullen et al. J Biol Chem. .

Abstract

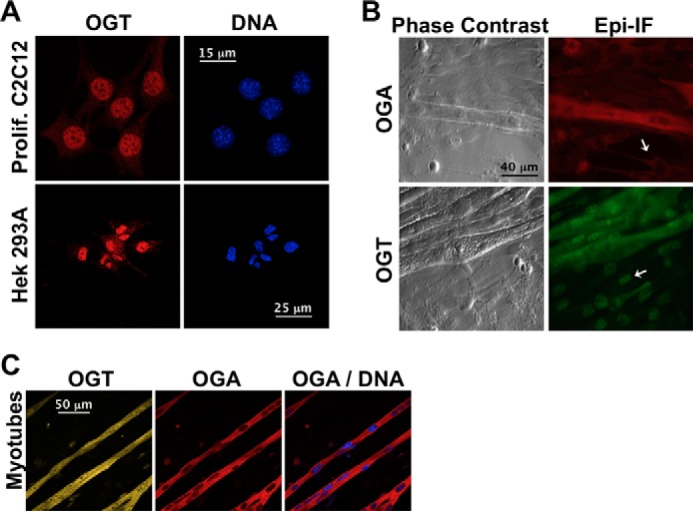
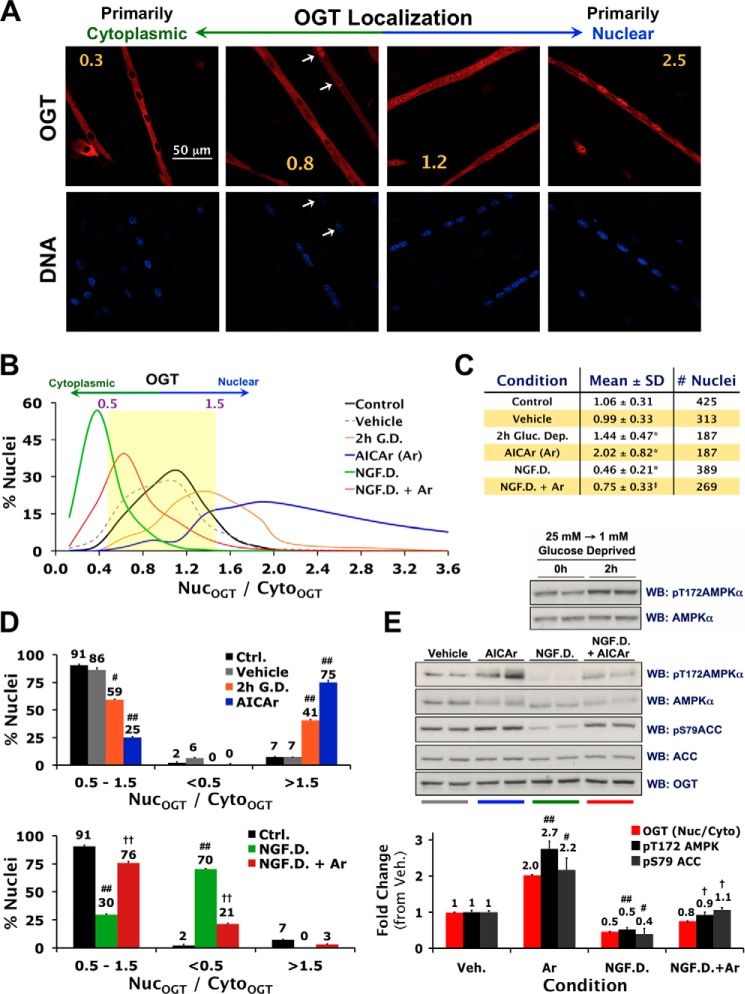
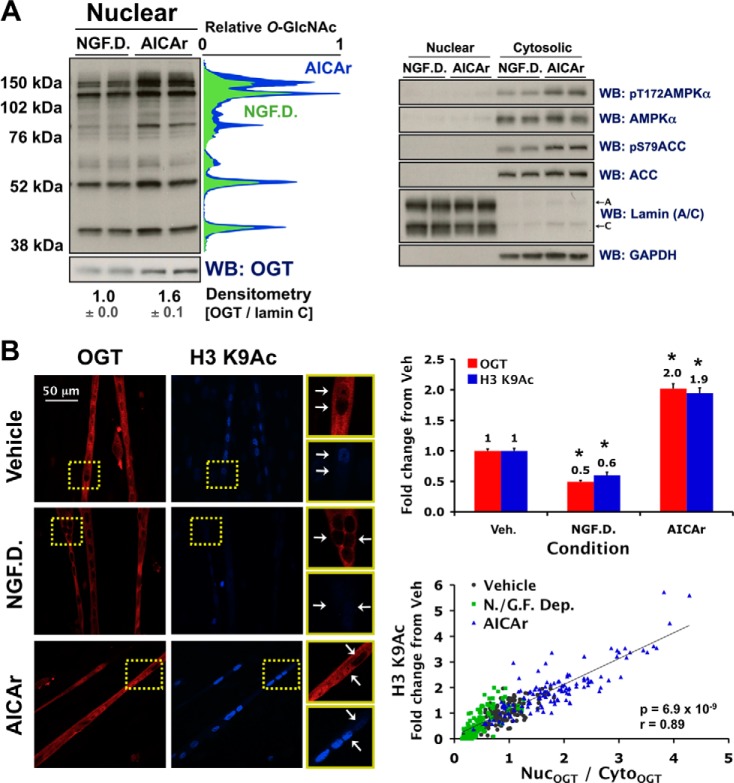
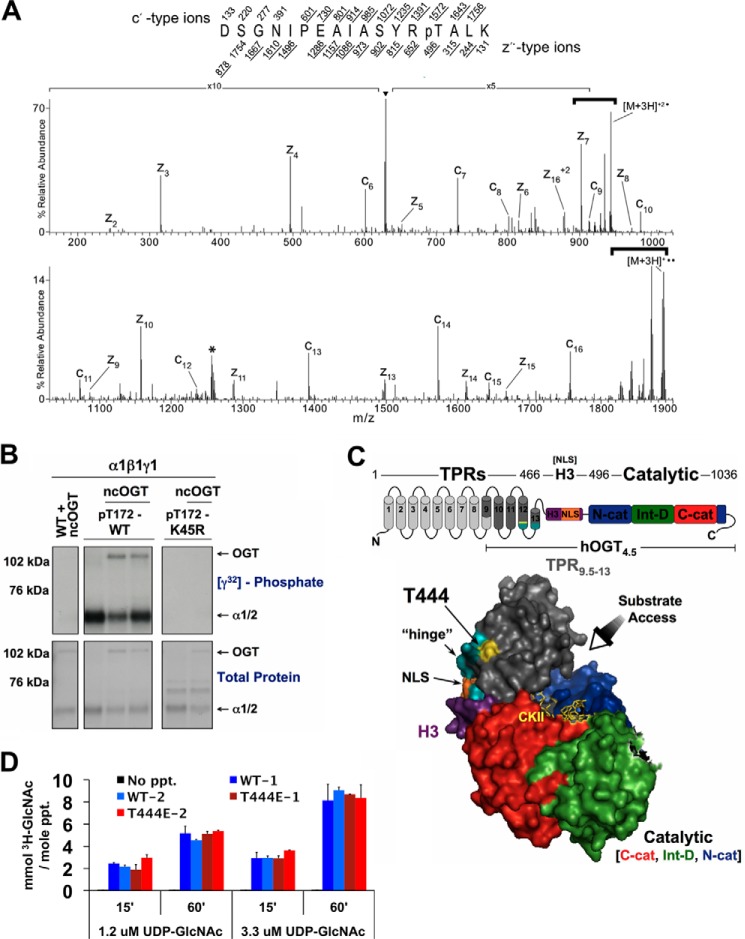
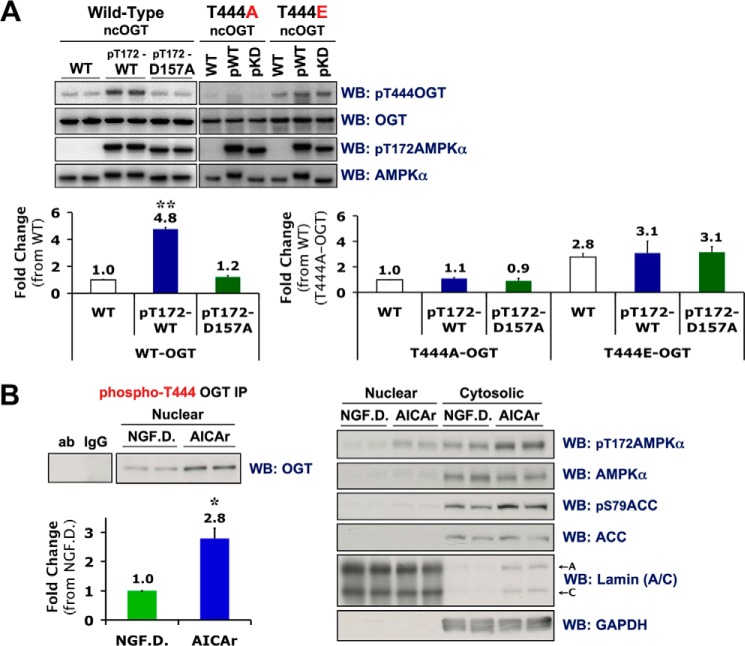
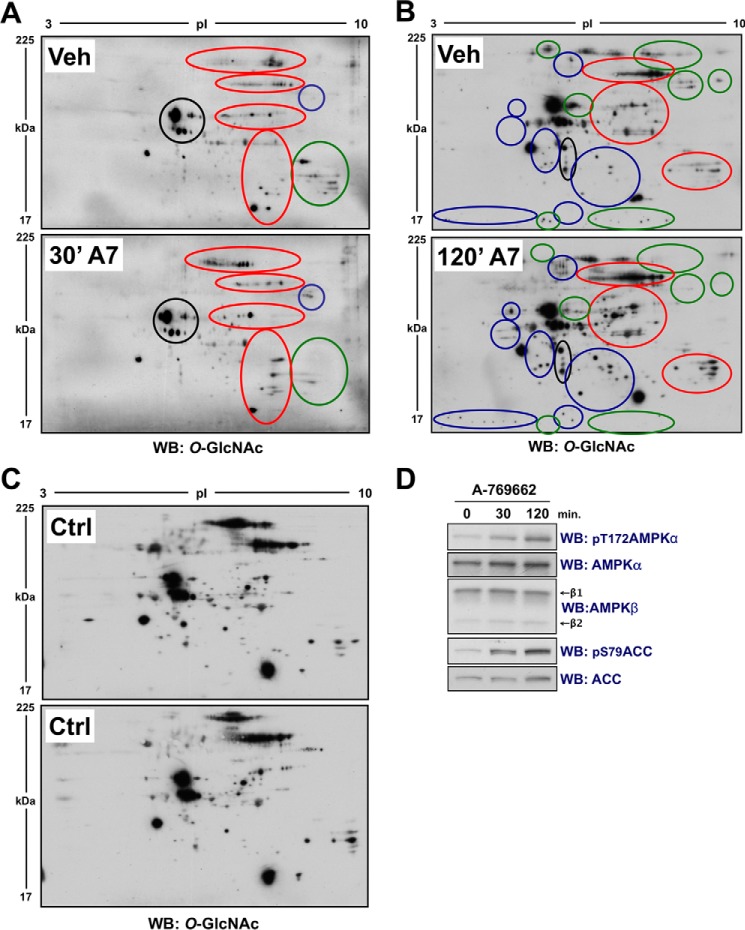
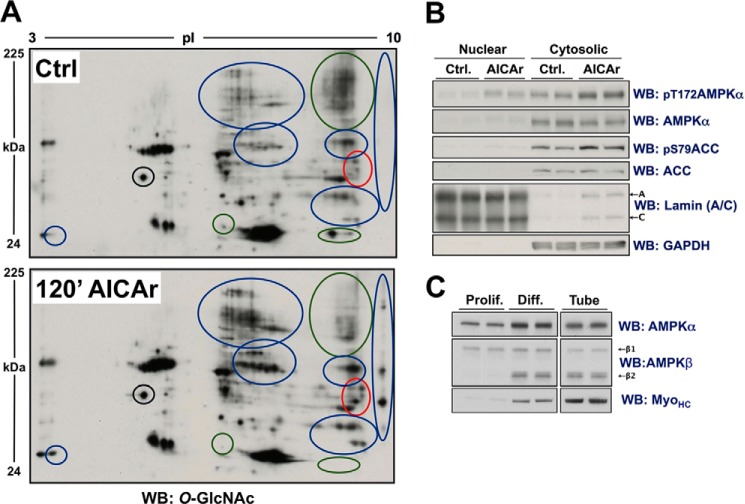
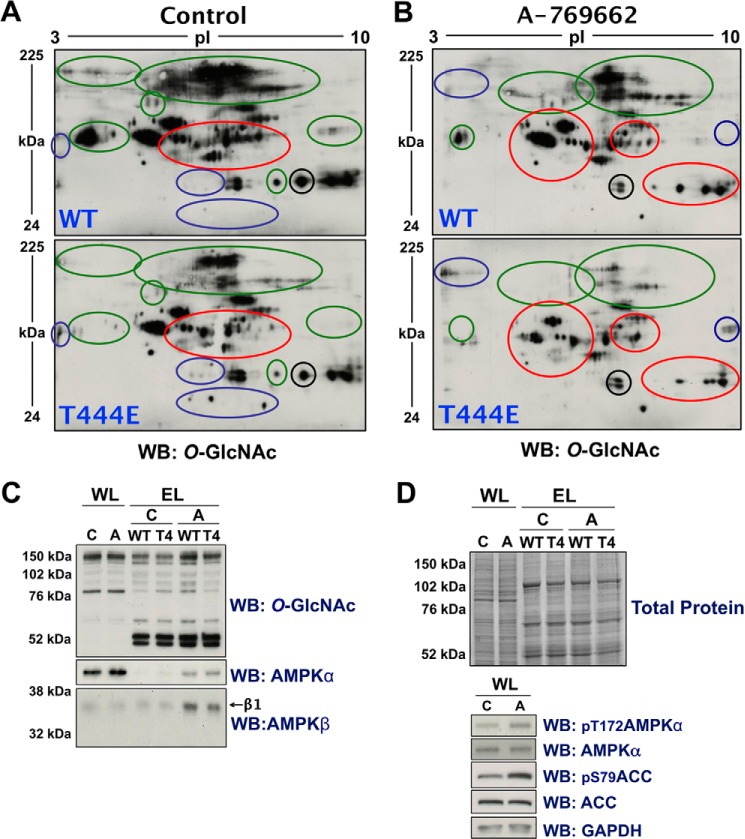
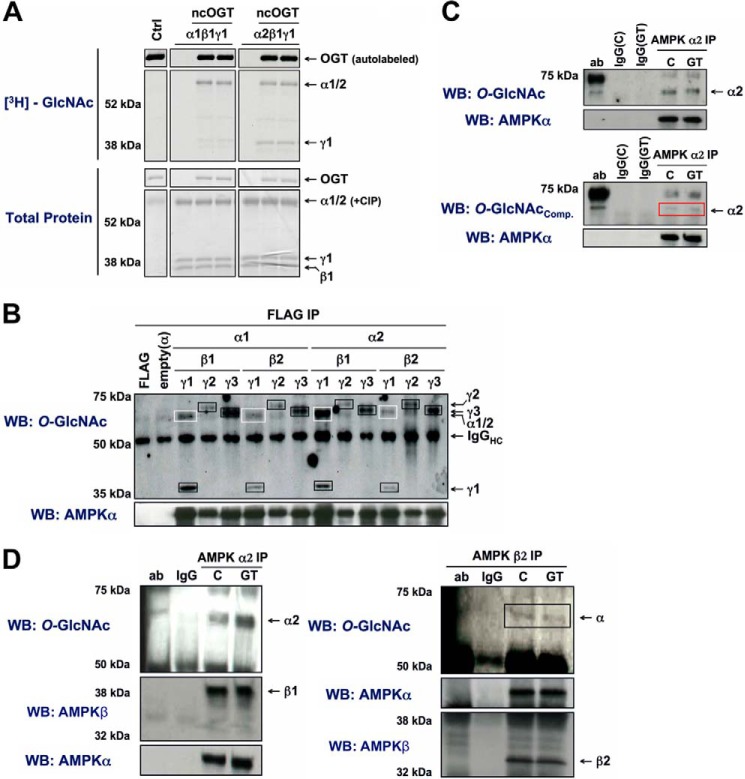
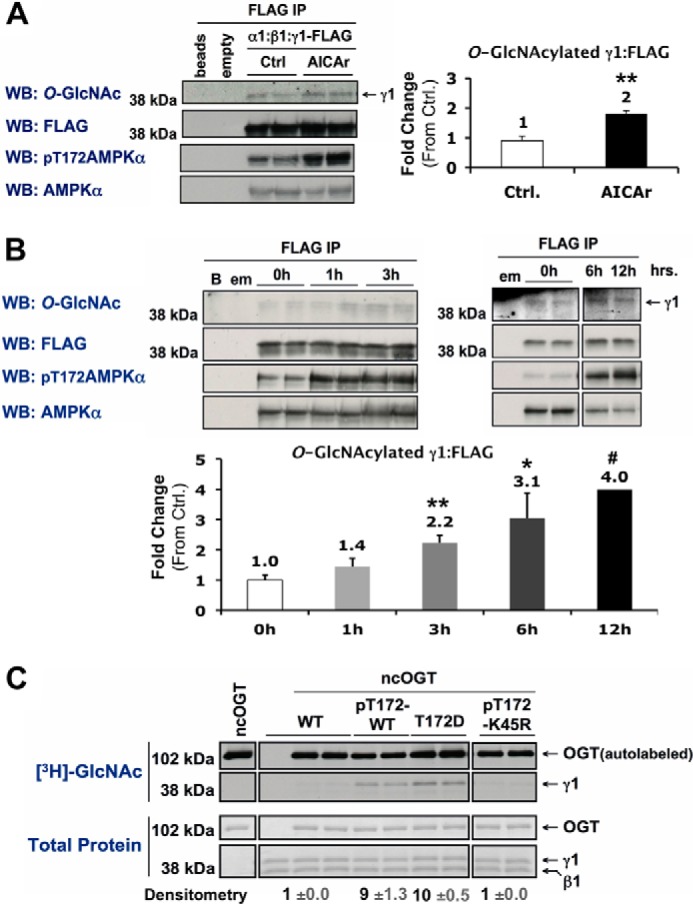
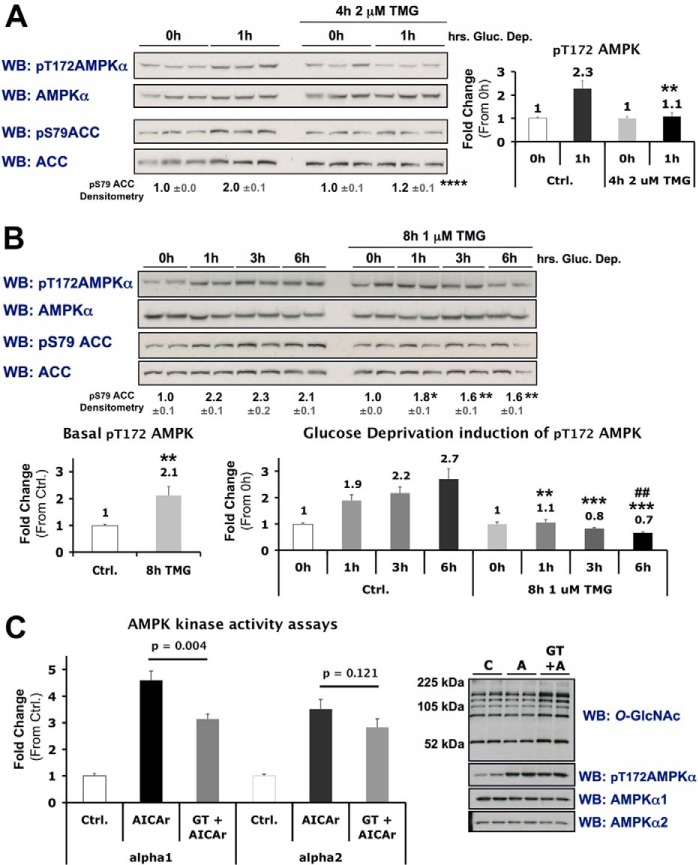
Nutrient-sensitive pathways regulate both O-GlcNAc transferase (OGT) and AMP-activated protein kinase (AMPK), cooperatively connecting metabolic homeostasis to regulation of numerous intracellular processes essential for life. Similar to phosphorylation, catalyzed by kinases such as AMPK, O-GlcNAcylation is a highly dynamic Ser/Thr-specific post-translational modification of nuclear, cytoplasmic, and mitochondrial proteins catalyzed exclusively by OGT. OGT and AMPK target a multitude of intracellular proteins, with the net effect to protect cells from the damaging effects of metabolic stress. Despite hundreds of studies demonstrating significant overlap in upstream and downstream signaling processes, no study has investigated if OGT and AMPK can directly regulate each other. We show acute activation of AMPK alters the substrate selectivity of OGT in several cell lines and nuclear localization of OGT in C2C12 skeletal muscle myotubes. Nuclear localization of OGT affects O-GlcNAcylation of numerous nuclear proteins and acetylation of Lys-9 on histone 3 in myotubes. AMPK phosphorylates Thr-444 on OGT in vitro; phosphorylation of Thr-444 is tightly associated with AMPK activity and nuclear localization of OGT in myotubes, and phospho-mimetic T444E-OGT exhibits altered substrate selectivity. Conversely, the α- and γ-subunits of AMPK are O-GlcNAcylated, O-GlcNAcylation of the γ1-subunit increases with AMPK activity, and acute inhibition of O-GlcNAc cycling disrupts activation of AMPK. We have demonstrated significant cross-talk between the O-GlcNAc and AMPK systems, suggesting OGT and AMPK may cooperatively regulate nutrient-sensitive intracellular processes that mediate cellular metabolism, growth, proliferation, and/or tissue function.

Keywords: AMP-activated Kinase (AMPK); Histones; Nuclear Translocation; Nutrient Sensing; O-GlcNAc; O-GlcNAc Transferase; O-GlcNAcylation; Skeletal Muscle.


Figures

FIGURE 1.
FIGURE 1.
Localization of OGT and OGA in proliferating cells and differentiated C2C12 skeletal muscle cells. A, confocal projections of proliferating C2C12 or Hek293A cells stained for OGT (red) and DNA (blue). B, phase contrast and epi-immunofluorescence (Epi-IF) images of differentiated C2C12 cells stained for OGA (red) or OGT (green). OGA and OGT localization in the myoblastic substrata are indicated (white arrows). C, confocal projections of C2C12 myotubes stained for OGT, OGA, and DNA.
FIGURE 2.
FIGURE 2.
Nuclear localization of OGT is tightly associated with AMPK activity in C2C12 myotubes. A, confocal projections of fixed C2C12 myotubes stained for OGT (red) and DNA (blue). Nuclear-to-cytoplasmic ratios of OGT immunofluorescence (NucOGT/CytoOGT) for each projection are indicated in yellow. A high degree of variability in nuclear localization of OGT within the same myotube is indicated with white arrows. B–D, quantification of NucOGT/CytoOGT values in C2C12 myotubes incubated for 2 h in fresh DMEM (Control or Ctrl.), serum-free DMEM (AICAr vehicle), 1 mm glucose DMEM (G.D.), AICAr (0.5 mm), a buffer deprived of all nutrients/growth factors except 25 mm glucose (NGF.D.), or 0.5 mm AICAr in NGF.D. buffer (NGF.D.+Ar). E, lysates from differentiated C2C12 cells exposed to the same conditions in parallel were immunoblotted (WB) as indicated. Mean NucOGT/CytoOGT and densitometric values of phospho- over total AMPK and ACC (±S.E.) are normalized to Ctrl. #, ##, and * denote statistical significance of p < 0.01, p < 0.0001, and p < 1 × 10⁻²⁸ versus Ctrl. and Veh., respectively. †, ††, and ‡ denote statistical significance of p < 0.01, p < 0.001, and p < 1 × 10−37 versus NGF.D., respectively.
FIGURE 3.
FIGURE 3.
Nuclear localization of OGT correlates with O-GlcNAcylation of nuclear proteins and H3 Lys-9 acetylation in C2C12 myotubes. A, cytosolic and/or nuclear extracts from differentiated C2C12 cells subjected to 2 h of NGF.D. or 0.5 mm AICAr were immunoblotted (WB) for O-GlcNAcylated protein, OGT, and controls as indicated, including lamin (A/C) (nuclear loading control) and GAPDH (cytosolic loading control). Quantified densitometric lane profiles (relative scale of 0 to 1) of the representative O-GlcNAc WB were normalized to lamin C (NGF.D. (green), AICAr (blue)). B, confocal projections of fixed C2C12 myotubes incubated for 2 h in vehicle, NGF.D. buffer, or AICAr (0.5 mm), and stained for OGT (red) and H3 K9Ac (blue). Examples of correlation between OGT and H3 K9Ac nuclear staining for each condition are cropped (yellow boxes), blown up (right panels), and indicated with white arrows. Correlative and mean value (± S.E.) quantification of the nuclear-to-cytoplasmic ratios of OGT immunofluorescence (NucOGT/CytoOGT) and H3 K9Ac nuclear immunofluorescence (normalized to vehicle; Veh.) are plotted (>120 nuclei/condition). * denotes statistical significance of p < 1 × 10⁻²⁰ versus Veh.
FIGURE 4.
FIGURE 4.
AMPK phosphorylates Thr-444 on OGT in vitro. A, ETD MS/MS spectra of [M+3H]3+ ions (m/z 629.6) of the phosphorylated ncOGT peptide, DSGNIPEAIASYRpTALK. Two ETD spectra were averaged to obtain this spectrum. The predicted monoisotopic c′ and z′-type fragment ion masses are listed above and below the peptide sequence, respectively. The predicted average mass for the doubly charged z16 ion is shown. All fragment ions identified within the spectrum are labeled while the corresponding predicted ion masses are underlined within the peptide sequence. Reduced charge species resulting from electron capture without dissociation are labeled within the spectrum with neutral losses from these species contained by heavy brackets. Species that fall within the prescribed 3 Da isolation window are represented by ▾, whereas those denoted with an asterisk correspond to reduced charge species resulting from a coeluting, doubly charged species. B, wild-type (WT), phosphorylated active wild-type (pT172-WT), or phosphorylated kinase-dead mutant (pT172-K45R) recombinant AMPK-α1β1γ1 complexes were incubated with recombinant O-GlcNAc transferase (ncOGT) in the presence of [γ-32P]ATP (an autoradiograph ([γ32]phosphate; top panels) of the same gel stained with G250 Coomassie Blue (total protein; bottom panels)). C, location of Thr-444 (yellow) on a surface representation of the crystal structure of hOGT4.5 complexed with UDP and CKII peptide (stick structure in the substrate-binding cleft of OGT). hOGT4.5 contains a truncated TPR domain (4.5 TPR units; gray) connected to the catalytic domain (N-terminal catalytic (N-cat; blue), intervening (Int-D; green) and C-terminal catalytic (C-cat; red) subdomains) via a transitional helix (H3; purple) which includes a predicted nuclear localization signal (NLS; orange). Pivoting about the hinge (represented as the last 6 amino acids of TPR 12 and first 6 amino acids of TPR 13 in teal) is postulated to facilitate access of a wide variety of substrates to the substrate-binding cleft of OGT. D, OGT activity assays of 2 separate purifications of recombinant WT- and T444E-ncOGT. Assays performed on no CKII peptide (No ppt.) were included as negative controls.
FIGURE 5.
FIGURE 5.
Phosphorylation of Thr-444 on OGT is tightly linked with AMPK activity and nuclear localization of OGT in C2C12 myotubes. A, wild-type (WT), phosphorylated active wild-type (pT172-WT or pWT), or phosphorylated kinase dead mutant (pT172-D157A or pKD) recombinant AMPK-α1β1γ1 complexes were incubated with WT, T444A mutant or T444E phospho-mimetic ncOGT in the presence of ATP and immunoblotted (WB) as indicated. Densitometric quantification (mean value ± S.E.) of phospho-Thr-444 OGT over total OGT immunoblots was normalized to respective WT controls. B, left panel, phospho-Thr-444 OGT immunoprecipitates (IP) of nuclear extracts from differentiated C2C12 cells subjected to 2 h of NGF.D. or 0.5 mm AICAr were immunoblotted for OGT. Primary antibody incubated without nuclear lysate (ab) and lysate incubated with nonspecific IgG (IgG) were included as negative controls. Densitometric quantification (mean value ± S.E.) of OGT immunoblots are normalized to NGF.D. Right panel, control immunoblots, including lamin (A/C) (nuclear loading control) and GAPDH (cytosolic loading control), of nuclear and cytosolic extracts used for immunoprecipitations. * and ** denote statistical significance of p < 1 × 10⁻⁸ and p < 1 × 10⁻¹⁰, respectively.
FIGURE 6.
FIGURE 6.
Highly specific activation of AMPK alters global O-GlcNAcylated protein status in proliferating cells. A and B, lysates from proliferating Hek293T cells incubated for 30 min (A) or 120 min (B) in vehicle (Veh; 0.1% DMSO in serum-free DMEM) or A-769662 (A7; 0.1 mm) were separated by two-dimensional electrophoresis (2DE) and immunoblotted (WB) for O-GlcNAcylated protein. Blue, green, and red circles highlight regions where A-769662 generally increased, decreased, or altered O-GlcNAcylated protein patterning, respectively. The black circle highlights a region that does not change, as reference for equal loading. C, O-GlcNAc immunoblots of untreated lysate from Hek293T cells processed and analyzed in parallel (analogous to data presented in A and B) confirms a low degree of intra-experimental variability. D, control immunoblots of the same lysate used for both the 30- and 120-min time points confirm time-dependent activation of AMPK.
FIGURE 7.
FIGURE 7.
AICAr-induced activation of AMPK in differentiated C2C12 cells alters O-GlcNAcylated protein immunoblot patterning of the cytosolic fraction of lysates separated by 2DE. A, the cytosolic fraction of lysates from differentiated C2C12 cells treated with vehicle (Ctrl.) or AICAr (0.5 mm, 120 min) were separated by two-dimensional electrophoresis (2DE) and immunoblotted (WB) for O-GlcNAcylated protein. Blue, green, and red circles highlight regions where AICAr generally increased, decreased, or altered O-GlcNAcylated protein patterning, respectively. The black circle highlights a region that does not change, as reference for equal loading. B, control immunoblots, including lamin (A/C) (nuclear loading control) and GAPDH (cytosolic loading control), of the nuclear and cytosolic fractions of the same lysates presented in panel A confirms activation of AMPK. C, lysates from proliferating (Prolif.) and differentiated (Diff.) C2C12 cells, and lysate from myotubes enriched from differentiated C2C12 cells (Tube) were immunoblotted as indicated (myosin heavy chain (MyoHC; myotube marker)), confirming β2-subunit harboring AMPK complexes as the predominantly expressed isoenzyme in myotubes.
FIGURE 8.
FIGURE 8.
Phospho-mimetic (T444E) recombinant ncOGT exhibits altered substrate selectivity. A and B, lysates from Hek293T cells incubated for 2 h in either vehicle (Control; 0.1% DMSO in serum-free DMEM) (A) or A-769662 (0.1 mm) (B) were enriched for either WT or T444E ncOGT-interacting proteins, separated by two-dimensional electrophoresis and immunoblotted (WB) for O-GlcNAcylated protein. Blue, green and red circles highlight regions where O-GlcNAcylated protein patterning is generally increased, decreased, or altered, respectively. The black circle highlights a region that does not change, as reference for equal loading. C, whole-cell lysates (WL) and enriched lysates (EL) from the experiments used in panels A and B were immunoblotted for O-GlcNAcylated protein, and the α- and β-subunits of AMPK. D, top panel, G250 Coomassie Blue staining (Total Protein) and bottom panel, control immunoblots of WL and EL confirm equal loading and activation of AMPK, respectively.
FIGURE 9.
FIGURE 9.
The α1-, α2-, γ1-, γ2-, and γ3-subunits of AMPK are O-GlcNAcylated. A, recombinant AMPK-α1β1γ1 or -α2β1γ1 complexes were incubated with recombinant O-GlcNAc transferase (ncOGT) in the presence of UDP-[3H]-GlcNAc [an autofluorograph ([3H]-GlcNAc; top panel) of the same gel stained with G250 Coomassie Blue (Total Protein; bottom panel)]. Reactions without AMPK (Ctrl) or ncOGT were included as negative controls. B, 12 possible AMPK heterotrimeric combinations of Myc-α1/2, β1/2, and γ1/2/3-FLAG were co-expressed in Hek293A cells and immunoprecipitated (IP) with anti-FLAG beads. IPs were immunoblotted (WB) for O-GlcNAcylated protein and AMPK-α. Anti-FLAG beads incubated without cell lysate (FLAG), and anti-FLAG IPs of cells expressing an empty (α) vector were included as negative controls. White boxes and black boxes outline bands corresponding to O-GlcNAcylated α- and γ-subunits, respectively. C, AMPK-α2 immunoprecipitates from Hek293A cells treated with vehicle (C) or GT (10 μm, 2 h) were immunoblotted for O-GlcNAcylated protein (CTD 110.6) and AMPK-α. Competition of CTD 110.6 antibody reactivity by 1 m GlcNAc (lower panel) confirms the specificity of the antibody for O-GlcNAcylated protein. The red box highlights where nonspecific CTD 110.6 reactivity of the α2-subunit would be. Primary antibody incubated without cell lysate (ab) and lysate incubated with nonspecific IgG (IgG) were included as negative controls. D, AMPK-α2 or -β2 immunoprecipitates of HeLa cells treated with vehicle (C) or GT (10 μm, 6 h) were immunoblotted for O-GlcNAcylated protein, AMPK-α and AMPK-β. The black box highlights O-GlcNAcylated α-subunit co-immunoprecipitated with β2. Primary antibody incubated without cell lysate (ab), and lysate incubated with nonspecific IgG (IgG) were included as negative controls.
FIGURE 10.
FIGURE 10.
Activation of AMPK increases O-GlcNAcylation of its γ1-subunit. A and B, Myc-α1, β1, and γ1-FLAG constructs were co-expressed in Hek293A cells incubated in vehicle (Ctrl) or AICAr (1 mm, 2 h) (A), or 0 mm glucose for 0, 1, and 3 h or 0, 6, and 12 h (B). AMPK α:β:γ1-FLAG complexes were immunoprecipitated (IP) with anti-FLAG beads and immunoblotted (WB) for O-GlcNAcylated protein and controls as indicated. Anti-FLAG beads incubated without cell lysate (beads or B), and anti-FLAG IPs of cells expressing an empty (α) vector (empty or em) were included as negative controls. C, wild-type (WT), phosphorylated active wild-type (pT172-WT), constitutively active mutant (T172D), or phosphorylated kinase-dead mutant (pT172-K45R) recombinant AMPK α1β1γ1 was incubated with recombinant O-GlcNAc transferase (ncOGT) in the presence of UDP-[3H]GlcNAc (an autofluorograph ([3H]GlcNAc; top panels) of the same gel stained with G250 Coomassie Blue (Total Protein; bottom panels)). Densitometric quantification of O-GlcNAcylated γ1 pixel intensities (mean value ± S.E.) were normalized to respective controls. *, **, and *** denote statistical significance of p < 0.05, p < 0.01, and p < 0.001, respectively. #, 12h time point is representative of one experiment.
FIGURE 11.
FIGURE 11.
Inhibition of O-GlcNAc cycling blunts activation of AMPK in differentiated C2C12 skeletal muscle cells. A and B, lysates from differentiated C2C12 cells incubated in 0 mm glucose for 0 or 1 h ± 4 h treatment with TMG (A), or 0, 1, 3 or 6 h ± 8 h treatment with TMG (B), were immunoblotted (WB) as indicated. Densitometric quantification of phospho- over total AMPK or ACC immunoblots are represented as graphs or bold numbers normalized to Ctrl., respectively. C, kinase activity assays were performed on AMPK-α1 and -α2 immunoprecipitates of lysates from differentiated C2C12 cells treated with vehicle (C or Ctrl.), AICAr (A; 1 mm, 30 min), or pre-incubated in GT (10 μm, 2 h) prior to AICAr treatment (GT+A). Right panels, representative control immunoblots of lysate used for kinase activity assays. All quantification represent mean values ± S.E. *, **, ***, and **** denote statistical significance of p < 0.05, p < 0.01, p < 0.001, and p < 0.0001, respectively, for TMG versus Ctrl for each time point. ## denotes a statistical significance of p < 0.01 when comparing the 0h versus 6h time points in TMG-treated cells.

References

    1. Copeland R. J., Bullen J. W., Hart G. W. (2008) Cross-talk between GlcNAcylation and phosphorylation: roles in insulin resistance and glucose toxicity. Am. J. Physiol. Endocrinol. Metab. 295, E17-E28 - PMC - PubMed
    1. Hanover J. A., Krause M. W., Love D. C. (2012) Post-translational modifications: Bittersweet memories: linking metabolism to epigenetics through O-GlcNAcylation. Nat. Rev. Mol. Cell Biol. 13, 312–321 - PubMed
    1. Hardie D. G., Ross F. A., Hawley S. A. (2012) AMPK: a nutrient and energy sensor that maintains energy homeostasis. Nat. Rev. Mol. Cell Biol. 13, 251–262 - PMC - PubMed
    1. Chatham J. C., Nöt L. G., Fülöp N., Marchase R. B. (2008) Hexosamine biosynthesis and protein O-glycosylation: the first line of defense against stress, ischemia, and trauma. Shock 29, 431–440 - PubMed
    1. Kuhajda F. P. (2008) AMP-activated protein kinase and human cancer: cancer metabolism revisited. International Journal of Obesity 32, S36–S41 - PMC - PubMed

Publication types

MeSH terms

Substances

LinkOut - more resources