. 2014 May;13(5):1341-51.
doi: 10.1074/mcp.M113.030593. Epub 2014 Feb 21.

Improved normalization of systematic biases affecting ion current measurements in label-free proteomics data

Affiliations

Improved normalization of systematic biases affecting ion current measurements in label-free proteomics data

Paul A Rudnick et al. Mol Cell Proteomics. 2014 May.

Abstract

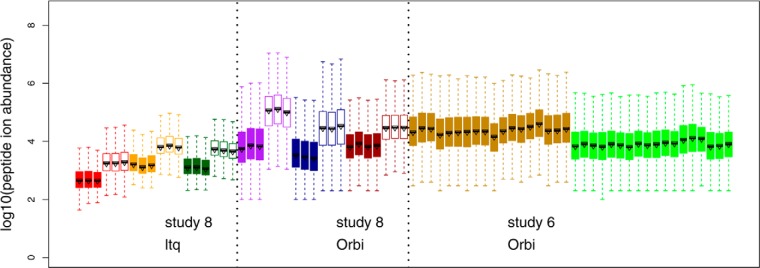
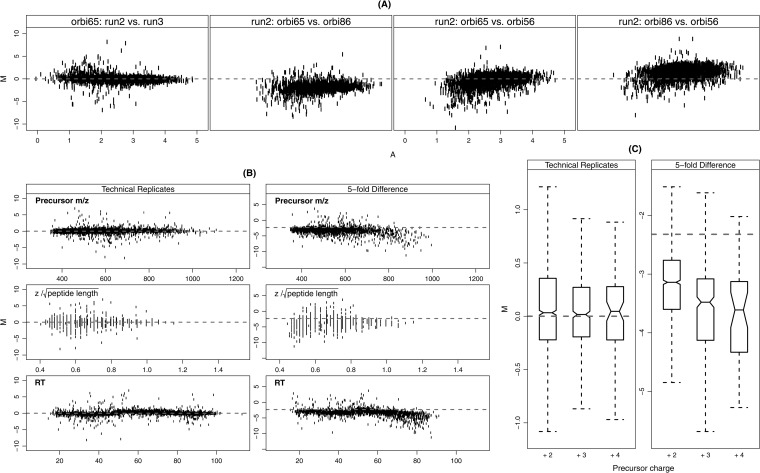
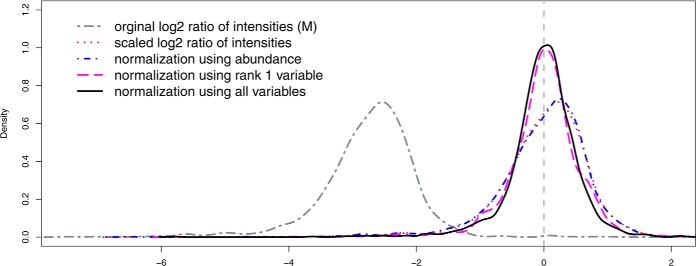
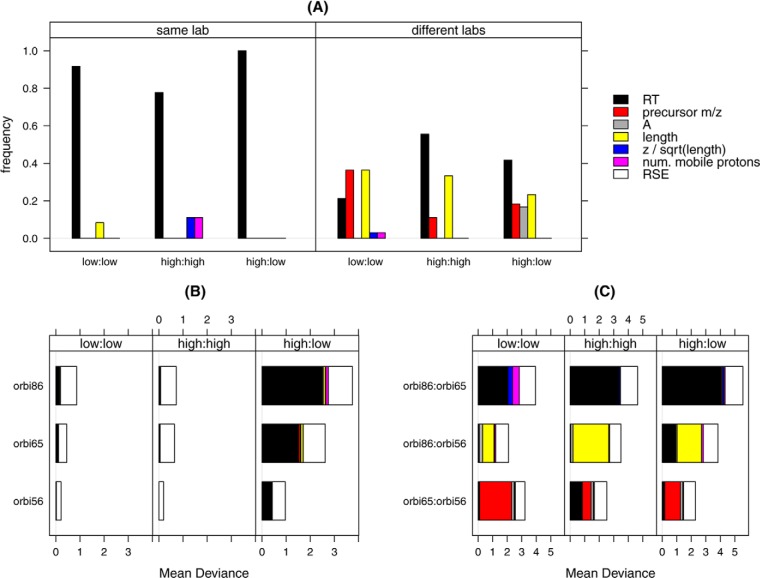
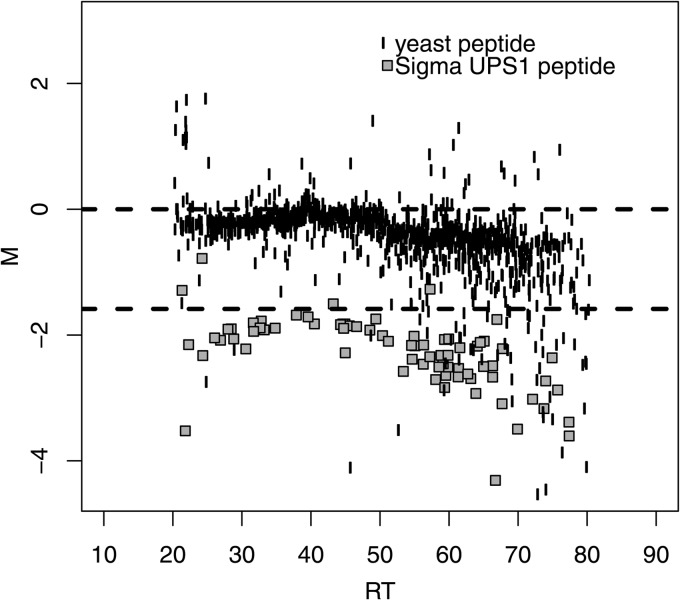
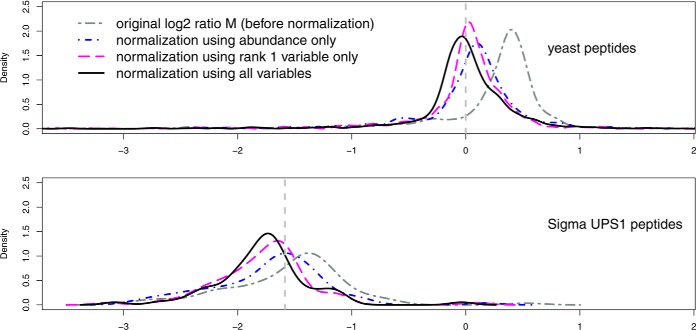
Normalization is an important step in the analysis of quantitative proteomics data. If this step is ignored, systematic biases can lead to incorrect assumptions about regulation. Most statistical procedures for normalizing proteomics data have been borrowed from genomics where their development has focused on the removal of so-called 'batch effects.' In general, a typical normalization step in proteomics works under the assumption that most peptides/proteins do not change; scaling is then used to give a median log-ratio of 0. The focus of this work was to identify other factors, derived from knowledge of the variables in proteomics, which might be used to improve normalization. Here we have examined the multi-laboratory data sets from Phase I of the NCI's CPTAC program. Surprisingly, the most important bias variables affecting peptide intensities within labs were retention time and charge state. The magnitude of these observations was exaggerated in samples of unequal concentrations or "spike-in" levels, presumably because the average precursor charge for peptides with higher charge state potentials is lower at higher relative sample concentrations. These effects are consistent with reduced protonation during electrospray and demonstrate that the physical properties of the peptides themselves can serve as good reporters of systematic biases. Between labs, retention time, precursor m/z, and peptide length were most commonly the top-ranked bias variables, over the standardly used average intensity (A). A larger set of variables was then used to develop a stepwise normalization procedure. This statistical model was found to perform as well or better on the CPTAC mock biomarker data than other commonly used methods. Furthermore, the method described here does not require a priori knowledge of the systematic biases in a given data set. These improvements can be attributed to the inclusion of variables other than average intensity during normalization.


Figures

Fig. 1.
Fig. 1.
Raw peptide ion intensities from CPTAC Study 8 (no SOP) and a subset of runs from Study 6 (with SOP). Data in Study 8 include 2 LTQs and 3 Orbitrap instruments. Three experimental runs of two samples (2 μl injections), 60 ng/μl (“low,” filled boxplots) and 300 ng/μl (“high,” unfilled boxplots) of the yeast material (Sample QC2) were included in the analysis of Study 8. For Study 6, a subset of runs on two Orbitraps were also included. The runs were plotted in the order specified as below, each with three replicates: (1) Sample 6A yeast + UPS1 at 0.25 fmol/μl, (2) Sample 6B, yeast + UPS1 at 0.74 fmol/μl, (3) Sample 6C, yeast + UPS1 at 2.2 fmol/μl, (4) Sample 6D, yeast + UPS1 at 6.7 fmol/μl, (5) Sample 6E, yeast + UPS1 at 20 fmol/μl, (6) Sample 6-QC2 yeast only.
Fig. 2.
Fig. 2.
Systematic biases in ion current measurements measured by the relative intensities (M) and its relationship with selected variables. Relative intensity M is defined as the log2 ratio, M = log2 (IR1/IR2), where IR1 and IR2 are the intensities for the experimental run R1 and R2, respectively. The selected variables included the average abundance A = 0.5 [log10 (IR1) + log10 (IR2)], precursor m/z, z/peptidelength, and retention time (RT). A, The relative intensity (M) versus abundance (A) within and across instruments. All runs are 300 ng/μl yeast samples (high). Panel 1: orbitrap 65 (2nd run) versus orbitrap 65 (3rd run); panel 2: orbitrap 65 (2nd run) versus orbitrap 86 (2nd run); panel 3: orbitrap 65 (2nd run) versus orbitrap 56 (2nd run); panel 4: orbitrap 86 (2nd run) versus orbitrap 56(2nd run). B, relative intensities (M) versus precursor m/z, z/peptidelength, and retention time (RT). All runs are from Orbitrap 65 in Study 8. The technical replicate pair is the 2nd and the 3rd runs in the 300 ng/μl yeast samples (high). The fivefold difference pair is the 2nd run in the 300 ng/μl yeast sample (high) and the 2nd run in the 60 ng/μl yeast sample (low). The left column shows technical replicates pairs and the right column shows fivefold difference pairs. These plots illustrate that systematic bias is more significant between the high and low samples with fivefold difference. C, Boxplots of the relative intensities (M) under the three observed charge states (+2, +3, +4) on experimental runs from Orbitrap 65 in Study 8. The same experimental runs were used for the pairs of technical replicates and fivefold difference as in B. The boxplot bounds in the form of [IQR (median)] are as follows: technical replicates: +2 [0.58(0.03)], +3 [0.46(0.02)], +4 [0.49 (0.05)]; fivefold difference: +2 [0.84(−3.13)], +3 [1.05(−3.48)], +4 [1.20 (−3.61)]. The distribution similarity was tested by a two-sample Wilcoxon rank test. The distributions of M between the charge states in high versus low samples (fivefold difference) were statistically different (p value <0.001) with the exception of +3 compared with +4 (p value = 0.46). The distributions of M were not significantly different under different charge states for technical replicates (p value > 0.15).
Fig. 3.
Fig. 3.
The densities of the relative intensities M (M = log2 (IR1/IR2)) under different normalization methods. The data used in the pair were the 1st run of 60 ng/μl yeast sample (low) and the 2nd run of 300 ng/μl yeast sample (high) on the ltq73 instrument in Study 8. The dark gray curve (“two-dash”) is for the original relative intensities M (before normalization). The red curve (“dotted”) is for the scaled relative intensities M by removing the sample mean of M (approximately −2.7 for the data used). The blue curve (“dot-dash”) is the normalized relative intensities M using peptide abundance (A) only. The purple curve (“long-dash”) is the normalized relative intensities M using Rank 1 variable only. The black curve (“solid”) is the normalized relative intensities M using all variables. The dashed gray line is the reference line at log2(M) = 0.
Fig. 4.
Fig. 4.
Ranking and mean deviances of the normalization variables. The data used were 19 experimental runs on the 3 Orbitrap instruments from Study 8, including 60 ng/μl (low) and 300 ng/μl (high) yeast samples. A, The frequency of the variables as Rank 1 for runs within the same lab or across different labs. B, The magnitude of the mean deviance adjusted by each variable, as well as the remaining mean deviance (represented by RSE) when experimental runs were from the same labs. C, The magnitude of the mean deviance adjusted by each variable as well as the remaining mean deviance (represented by RSE) when experimental runs were from different labs.
Fig. 5.
Fig. 5.
The relative intensities (M) versus retention time (RT) of Sample 6C (yeast + UPS1 at 2. 2 fmol/μl) against Sample 6D (yeast + UPS1 at 6.7 fmol/μl) in Study 6. The yeast matrix peptide ions (unfilled circles) were expected to be centered on the reference line at 0. The peptide ions for Sigma UPS1 spike-ins (filled gray squares) were expected to be centered around the reference line at log2(M) = −log2(3) (approximately [−1.58]) because the Sigma UPS1 spike-ins differed by threefolds between the samples analyzed. Systematic bias existed in the observed peptide ions intensities for both the yeast matrix and the Sigma UPS1.
Fig. 6.
Fig. 6.
Densities of relative intensities M (M = log2 (IR1/IR2)) under different normalization methods for run pairs Sample 6C (yeast + UPS1 at 2. 2 fmol/μl) against Sample 6D (yeast + UPS1 at 6.7 fmol/μl) (3-fold difference) in Study 6. In normalization and ranking, common peptides were selected based on the global invariant-ranking set (18). The top panel is for the yeast peptides ions, whose relative intensities were expected to be centered on the reference line at 0. The bottom panel is for the Sigma UPS1 spike-in peptides, whose relative intensities were expected to be centered on the threefold difference reference line at [–log2(3)] (approximately [-1.58]). The dark gray curve (two-dash) shows the original relative intensities M (before normalization). The blue curve (dot-dash) represents the normalized relative intensities M using peptide abundance (A). The purple curve (long-dash) is for the normalized relative intensities M using Rank1 variable only. The black curve (solid) is for the normalized relative intensities using all variables.

References

    1. Ong S. E., Blagoev B., Kratchmarova I., Kristensen D. B., Steen H., Pandey A., Mann M. (2002) Stable isotope labeling by amino acids in cell culture, SILAC, as a simple and accurate approach to expression proteomics. Mol. Cell. Proteomics 1, 376–386 - PubMed
    1. Mueller L. N., Brusniak M. Y., Mani D. R., Aebersold R. (2008) An assessment of software solutions for the analysis of mass spectrometry based quantitative proteomics data. J. Proteome Res 7, 51–61 - PubMed
    1. Florens L., Carozza M. J., Swanson S. K., Fournier M., Coleman M. K., Workman J. L., Washburn M. P. (2006) Analyzing chromatin remodeling complexes using shotgun proteomics and normalized spectral abundance factors. Methods 40, 303–311 - PMC - PubMed
    1. Jaffe J. D., Keshishian H., Chang B., Addona T. A., Gillette M. A., Carr S. A. (2008) Accurate inclusion mass screening: a bridge from unbiased discovery to targeted assay development for biomarker verification. Mol. Cell. Proteomics 7, 1952–1962 - PMC - PubMed
    1. Silva J. C., Gorenstein M. V., Li G.-Z., Vissers J. P. C., Geromanos S. J. (2006) Absolute quantification of proteins by LCMSE: a virtue of parallel MS acquisition. Mol. Cell. Proteomics 5, 144–156 - PubMed

Publication types

LinkOut - more resources