

A new approach to decoupling of bacterial adhesion energies measured by AFM into specific and nonspecific components
- PMID: 24563576
- PMCID: PMC3927919
- DOI: 10.1007/s00396-013-3017-7
A new approach to decoupling of bacterial adhesion energies measured by AFM into specific and nonspecific components
Abstract
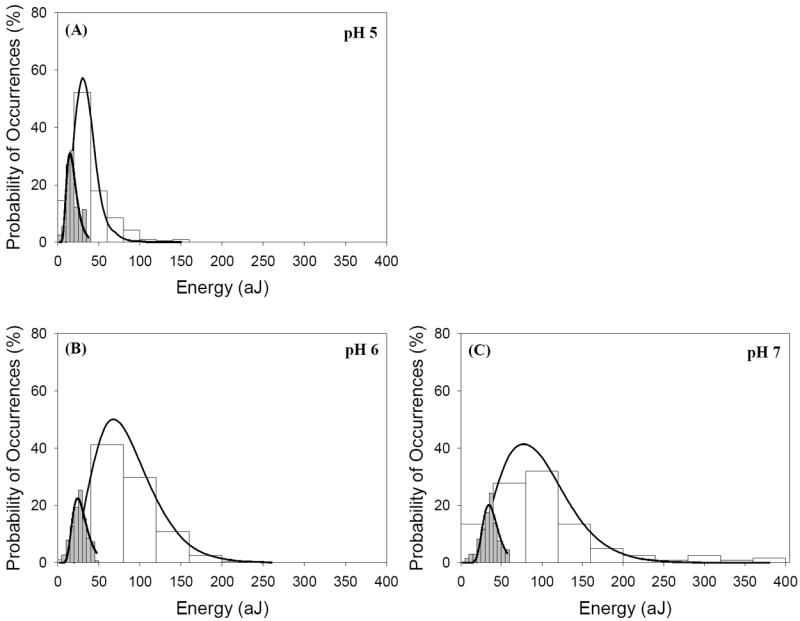
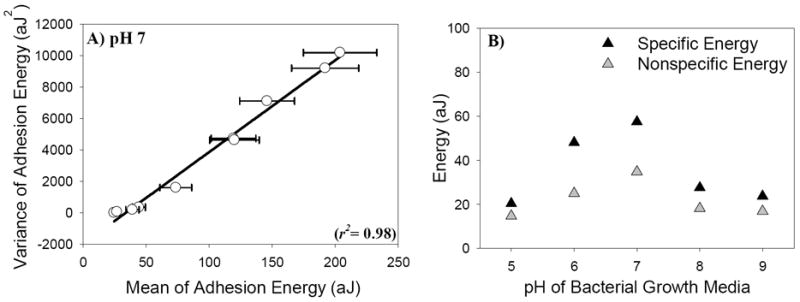
A new method to decoupling of bacterial interactions measured by atomic force microscopy (AFM) into specific and nonspecific components is proposed. The new method is based on computing the areas under the approach and retraction curves. To test the efficacy of the new method, AFM was used to probe the repulsion and adhesion energies present between L. monocytogenes cells cultured at five pH values (5, 6, 7, 8 and 9) and silicon nitride (Si3N4). Overall adhesion energy was then decoupled into its specific and nonspecific components using the new method as well as using Poisson statistical approach. Poisson statistical method represents the most commonly used approach to decouple bacterial interactions into their components. For all pH conditions investigated, specific energies dominated the adhesion and a transition in adhesion and repulsion energies for cells cultured at pH 7 was observed. When compared, the differences in the specific and nonspecific energies obtained using Poisson analysis and the new method were on average 2.2% and 6.7%, respectively. The relatively close energies obtained using the two approaches demonstrate the efficacy of the new method as an alternative way to decouple adhesion energies into their specific and nonspecific components.
Keywords: AFM; Listeria monocytogenes; adhesion energy; pH and Poisson model; repulsion energy.
Figures


Similar articles
-
Combined Poisson and soft-particle DLVO analysis of the specific and nonspecific adhesion forces measured between L. monocytogenes grown at various temperatures and silicon nitride.Environ Sci Technol. 2012 Sep 18;46(18):10089-98. doi: 10.1021/es300653w. Epub 2012 Sep 4. Environ Sci Technol. 2012. PMID: 22917240
-
Force-Averaging DLVO Model Predictions of the Adhesion Strengths Quantified for Pathogenic Listeria monocytogenes EGDe Grown under Variable pH Stresses.Langmuir. 2020 Aug 4;36(30):8947-8964. doi: 10.1021/acs.langmuir.0c01500. Epub 2020 Jul 24. Langmuir. 2020. PMID: 32633976
-
The role of growth temperature in the adhesion and mechanics of pathogenic L. monocytogenes: an AFM study.Langmuir. 2012 Jan 17;28(2):1360-73. doi: 10.1021/la203639k. Epub 2011 Dec 19. Langmuir. 2012. PMID: 22133148
-
Statistical analysis of long- and short-range forces involved in bacterial adhesion to substratum surfaces as measured using atomic force microscopy.Appl Environ Microbiol. 2011 Aug;77(15):5065-70. doi: 10.1128/AEM.00502-11. Epub 2011 Jun 3. Appl Environ Microbiol. 2011. PMID: 21642399 Free PMC article. Review.
-
[Application of atomic force microscopy (AFM) to study bacterial biofilms].Sheng Wu Gong Cheng Xue Bao. 2017 Sep 25;33(9):1399-1410. doi: 10.13345/j.cjb.170190. Sheng Wu Gong Cheng Xue Bao. 2017. PMID: 28956391 Review. Chinese.
Cited by
-
Changes in Cellular Elasticities and Conformational Properties of Bacterial Surface Biopolymers of Multidrug-Resistant Escherichia coli (MDR-E. coli) Strains in Response to Ampicillin.Cell Surf. 2019 Dec;5:100019. doi: 10.1016/j.tcsw.2019.100019. Epub 2019 Mar 4. Cell Surf. 2019. PMID: 31179402 Free PMC article.
-
AFM Force Mapping Elucidates Pilus Deployment and Key Lifestyle-Dependent Surface Properties in Bdellovibrio bacteriovorus.Langmuir. 2023 Mar 28;39(12):4233-4244. doi: 10.1021/acs.langmuir.2c03134. Epub 2023 Mar 16. Langmuir. 2023. PMID: 36926913 Free PMC article.
-
High Mannose N-Glycans Promote Migration of Bone-Marrow-Derived Mesenchymal Stromal Cells.Int J Mol Sci. 2020 Sep 29;21(19):7194. doi: 10.3390/ijms21197194. Int J Mol Sci. 2020. PMID: 33003435 Free PMC article.
References
-
- Gristina AG, Naylor P, Myrvik Q. Infections from biomaterials and implants: A race for the surface. Med Prog Technol. 1988;14:205–224. - PubMed
-
- Bushnak IA, Labeed FH, Sear RP, Keddie JL. Adhesion of microorganisms to bovine submaxillary mucin coatings: Effect of coating deposition conditions. Biofouling. 2010;26:387–397. - PubMed
-
- Katsikogianni M, Missirlis YF. Concise review of mechanisms of bacterial adhesion to biomaterials and of techniques used in estimating bacteria-material interactions. European Cells & Materials. 2004;8:37–57. - PubMed
-
- van Oss CJ. Energetics of cell-cell and cell-biopolymer interactions. Cell biophysics. 1989;14:1–16. - PubMed
-
- Rabinovich YI, Adler JJ, Ata A, Singh RK, Moudgil BM. Adhesion between nanoscale rough surfaces I. Role of asperity geometry. Journal of Colloid and Interface Science. 2000;232:10–16. - PubMed
Grants and funding
LinkOut - more resources
Full Text Sources
Other Literature Sources
Miscellaneous