. 2014 Jan;41(1):23-38.
doi: 10.1111/jbi.12171.

Community phylogenetics at the biogeographical scale: cold tolerance, niche conservatism and the structure of North American forests

Affiliations
Free PMC article

Community phylogenetics at the biogeographical scale: cold tolerance, niche conservatism and the structure of North American forests

Bradford A Hawkins et al. J Biogeogr. 2014 Jan.
Free PMC article

Abstract

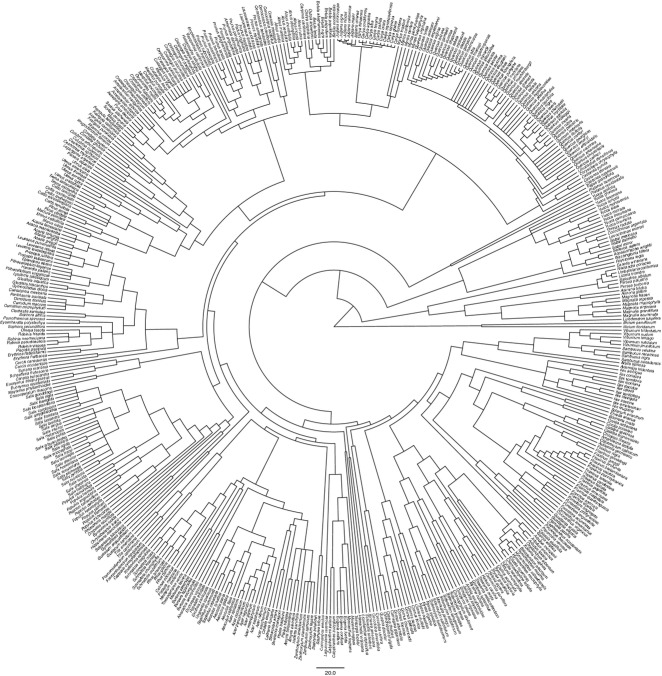
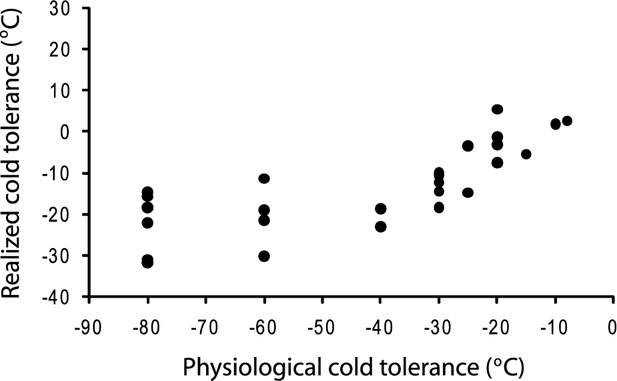
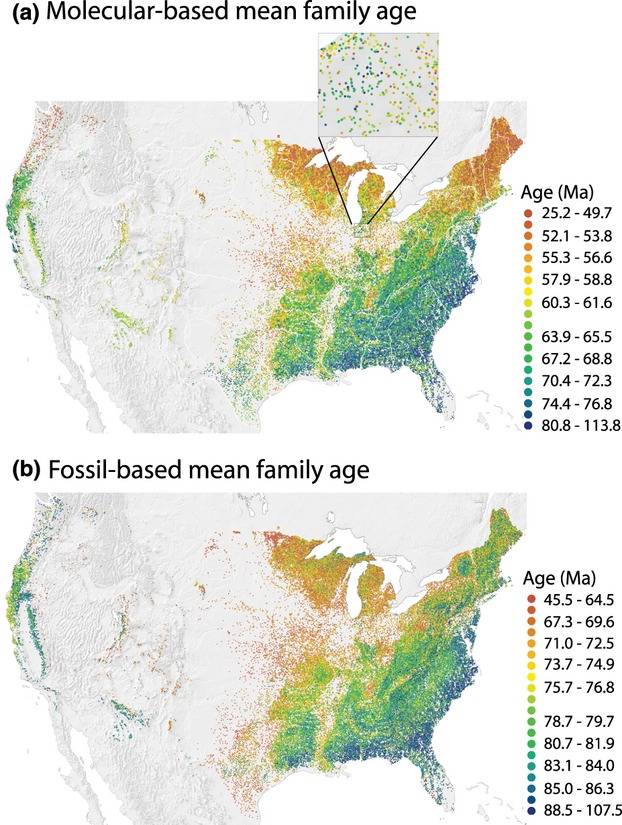
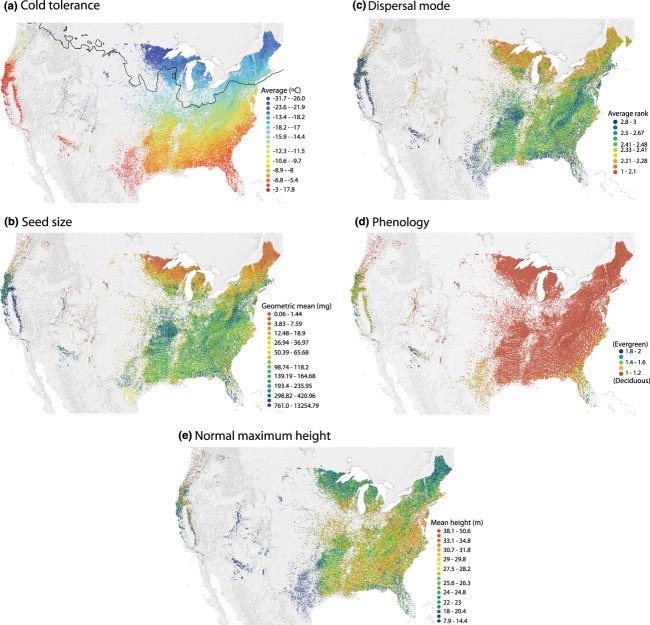
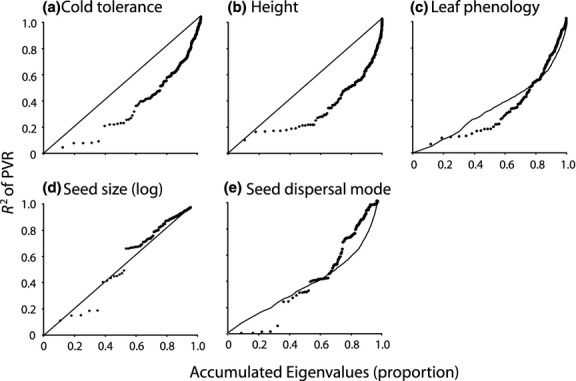
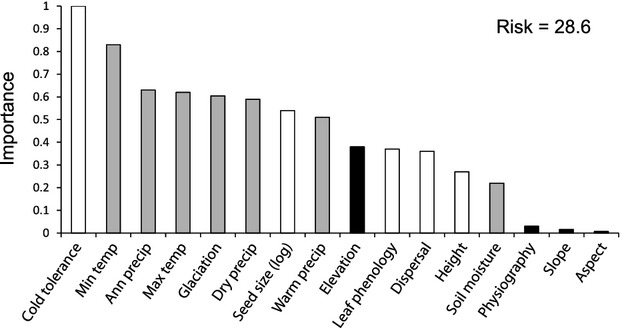
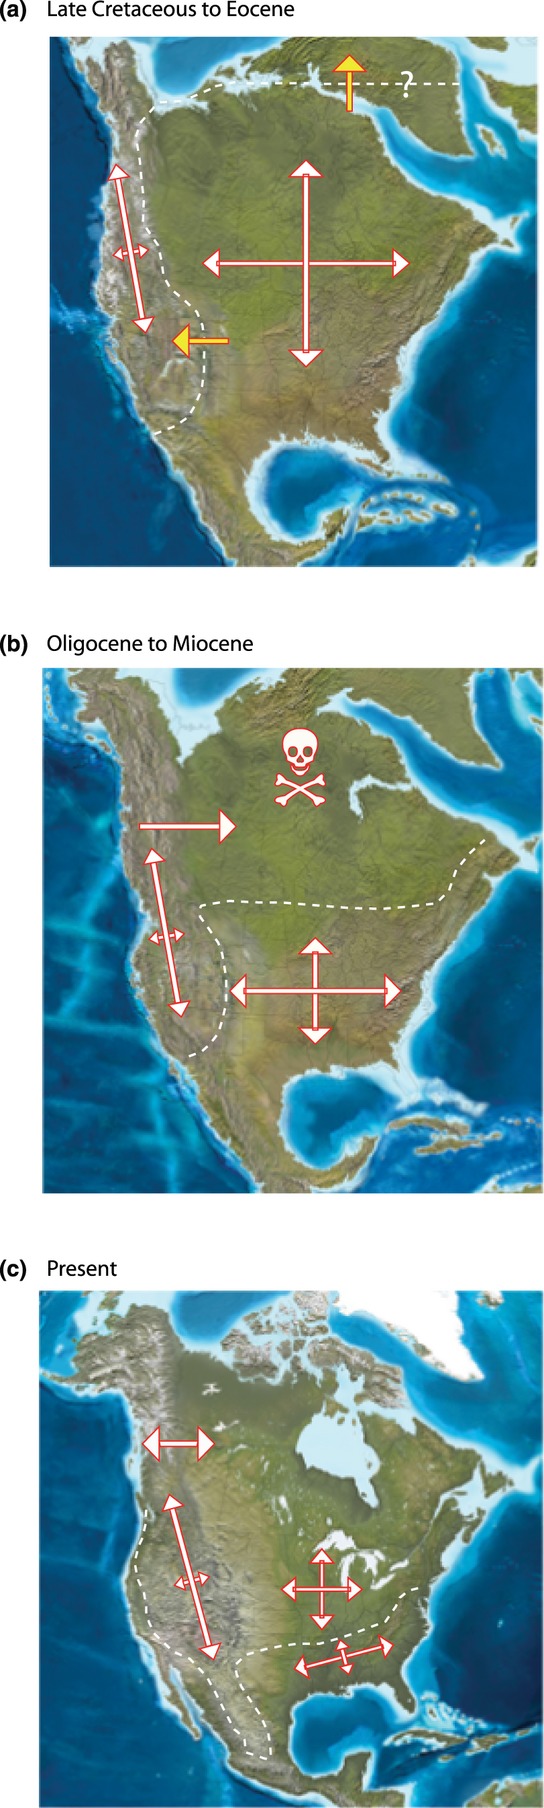
AimThe fossil record has led to a historical explanation for forest diversity gradients within the cool parts of the Northern Hemisphere, founded on a limited ability of woody angiosperm clades to adapt to mid-Tertiary cooling. We tested four predictions of how this should be manifested in the phylogenetic structure of 91,340 communities: (1) forests to the north should comprise species from younger clades (families) than forests to the south; (2) average cold tolerance at a local site should be associated with the mean family age (MFA) of species; (3) minimum temperature should account for MFA better than alternative environmental variables; and (4) traits associated with survival in cold climates should evolve under a niche conservatism constraint. LocationThe contiguous United States. MethodsWe extracted angiosperms from the US Forest Service's Forest Inventory and Analysis database. MFA was calculated by assigning age of the family to which each species belongs and averaging across the species in each community. We developed a phylogeny to identify phylogenetic signal in five traits: realized cold tolerance, seed size, seed dispersal mode, leaf phenology and height. Phylogenetic signal representation curves and phylogenetic generalized least squares were used to compare patterns of trait evolution against Brownian motion. Eleven predictors structured at broad or local scales were generated to explore relationships between environment and MFA using random forest and general linear models. ResultsConsistent with predictions, (1) southern communities comprise angiosperm species from older families than northern communities, (2) cold tolerance is the trait most strongly associated with local MFA, (3) minimum temperature in the coldest month is the environmental variable that best describes MFA, broad-scale variables being much stronger correlates than local-scale variables, and (4) the phylogenetic structures of cold tolerance and at least one other trait associated with survivorship in cold climates indicate niche conservatism. Main conclusionsTropical niche conservatism in the face of long-term climate change, probably initiated in the Late Cretaceous associated with the rise of the Rocky Mountains, is a strong driver of the phylogenetic structure of the angiosperm component of forest communities across the USA. However, local deterministic and/or stochastic processes account for perhaps a quarter of the variation in the MFA of local communities.

Keywords: Forest phylogenetics; National Forest Inventory; North America; niche conservatism; phylogenetic signal representation; random forests; trait evolution; tree communities; tropical conservatism hypothesis.


Figures

Figure 1
Figure 1
Phylogeny for 500 North American angiosperm tree species. Branch lengths are in millions of years. See high resolution linear version of Fig. 1 in Appendix S2 and Newick version in Appendix S1.
Figure 2
Figure 2
Relationship between realized cold tolerances (minimum temperature experienced within current distribution) and physiological cold tolerances estimated by Sakai & Weiser (1973) for 30 North American angiosperm tree species.
Figure 3
Figure 3
Geographical pattern of mean family age for North American angiosperm tree species across 91,340 plots based on (a) molecular dates from Davies et al. (2004), and (b) fossil dates. Major rivers are shown in white. The insert in (a) exemplifies variation at local scales.
Figure 4
Figure 4
Geographical patterns of (a) mean realized cold tolerance, (b) geometric mean seed size, (c) mean ranked dispersal mode, (d) mean categorized leaf phenology and (e) mean normal maximum height across 91,340 plots for North American angiosperm tree species. The black line in (a) delimits the extent of the ice sheets during the Last Glacial Maximum.
Figure 5
Figure 5
Phylogenetic signal representation curves (black dots) for (a) cold tolerance, (b) height, (c) leaf phenology, (d) seed size and (e) seed dispersal mode of North American tree species. The diagonal in the continuous traits (a,b,d) is the relationship expected under a Brownian motion model of evolution. The Brownian expectations for the discrete traits (c,e) are average R2 values derived from 250 simulations.
Figure 6
Figure 6
Variable importance values from a random forest model (based on 100 regression trees) of mean family age of North American angiosperm tree species across 91,340 plots, with the inclusion of all trait and environmental predictors in the models. Traits are in white, broad-scale environmental variables are in grey, and local-scale environmental variables are in black. Non-abbreviated variable names are given in Table 2.
Figure 7
Figure 7
Spatial correlogram of mean family age for North American angiosperm tree species using a random sample of 15,000 sites (raw data and residuals from a random forest model that included five tree traits and eleven environmental variables operating over local or broad scales). All Moran's I values for the residuals are between −0.020 and 0.036.
Figure 8
Figure 8
Key features of a hypothesized biogeographical history of angiosperm trees over the last 75 million years in North America. (a) At 60 Ma, during the Laramide orogeny that formed the initial rise of the Rocky Mountains. (b) During mid-Tertiary cooling that started 34 Ma. (c) At the present day (with the continent recently joined to South America). Dashed lines stylistically delimit zones within which freezing due to altitudinal or latitudinal gradients in temperature developed. White arrows represent the addition of species by speciation and dispersal, with longer arrows indicating more such addition. Note the increasing latitudinal restriction outside the zone of freezing through time. Yellow arrows reflect selection gradients to which some tree clades were able to respond via the evolution of cold tolerance. Species are assumed to have been going extinct continuously, but particularly high extinction occurred in cold areas as the freeze line moved south; families comprising species that have been unable to evolve cold tolerance have disappeared from these parts of the continent. The figure is intended to represent spatially the tropical conservatism hypothesis as set out by Wiens & Donoghue (2004), the effects on trees of mid-Tertiary climate change as envisaged by Latham & Ricklefs (1993), and the role of high mountain chains and cool climates at high palaeolatitudes in accounting for the apparent evolution of cold tolerance in some clades prior to the Oligocene. The base maps were generated by Ron Blakey and Colorado Plateau Geosystems and are available at http://www.cpgeosystems.com/index.html (accessed in November, 2012).

Similar articles

Cited by

References

    1. Angiosperm Phylogeny Group. An update of the Angiosperm Phylogeny Group classification for the orders and families of flowering plants: APG III. Botanical Journal of the Linnean Society. 2009;161:105–121.
    1. Ashlock PD. The uses of cladistics. Annual Review of Ecology and Systematics. 1974;5:81–99.
    1. Bell CD, Soltis DE, Soltis PS. The age and diversification of the angiosperms rerevisited. American Journal of Botany. 2010;97:1296–1303. - PubMed
    1. Broecker WS, Kennett JP, Flower BP, Teller JT, Trumbore S, Bonani G, Wolf W. Routing of meltwater from the Laurentide Ice Sheet during the Younger Dryas cold episode. Nature. 1989;341:318–321.
    1. Butler MA, King AA. Phylogenetic comparative analysis: a modeling approach for adaptive evolution. The American Naturalist. 2004;164:683–695. - PubMed