

Trend and socio-demographic differentials of Caesarean section rate in Addis Ababa, Ethiopia: analysis based on Ethiopia demographic and health surveys data
- PMID: 24563907
- PMCID: PMC3925324
- DOI: 10.1186/1742-4755-11-14
Trend and socio-demographic differentials of Caesarean section rate in Addis Ababa, Ethiopia: analysis based on Ethiopia demographic and health surveys data
Abstract
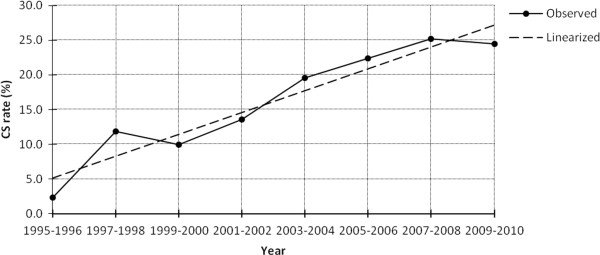
Background: According to the World Health Organization, Caesarean Section (CS) rate (percentage of births managed by CS) exceeding 15% lacks medical justification and it could be linked with adverse maternal and child health consequences. Nonetheless, the rate in Addis Ababa city is beyond the aforementioned level. The objectives of the study were to assess the trend and socio-demographic differentials of CS rate in the city.
Methods: The study was made based on the three Ethiopia Demographic and Health Surveys (EDHS) data (EDHS 2000, 2005 and 2011). The trend over the period of 1995–2010 was assessed using simple linear regression analysis whereas the differentials of CS rate were identified based on DHS 2011 data. CS rates were compared across categories of various socio-economic variables using chi-square test.
Results: The CS rate increased significantly from 2.3% in 1995–1996 to 24.4% in 2009–2010. From 2003 onwards, it persisted above 15%. The rates among women with secondary (32.3%) or higher (33.3%) levels of education were nearly two times higher than the corresponding figures in the illiterates (14.8%) and women with primary education (15.8%) (P < 0.001). The level among women from the ‘rich’ households (28.6%) was higher than those from the ‘poor’ (16.4%) and ‘middle’ (19.5%) households (P = 0.016). The rate also significantly increased with rising parity (P = 0.023). The rate among women who delivered in private health institutions (41.7%) was twice higher than their counterparts who delivered in public institutions (20.6%).
Conclusion: The CS rate in Addis Ababa has exceeded beyond the level recommended by the WHO. Accordingly, It should be maintained within the optimum 5-15% range by introducing medical audit for labor management both in the private and public health institutions.
Figures
Similar articles
-
Patterns of caesarean-section delivery in Addis Ababa, Ethiopia.Afr J Prim Health Care Fam Med. 2016 Jul 8;8(2):e1-6. doi: 10.4102/phcfm.v8i2.953. Afr J Prim Health Care Fam Med. 2016. PMID: 27542289 Free PMC article.
-
Multilevel modelling of factors associated with caesarean section in Ethiopia: community based cross sectional study.BMC Res Notes. 2019 Nov 6;12(1):724. doi: 10.1186/s13104-019-4705-2. BMC Res Notes. 2019. PMID: 31694680 Free PMC article.
-
Trend and associated factors of cesarean section rate in Ethiopia: Evidence from 2000-2019 Ethiopia demographic and health survey data.PLoS One. 2023 Mar 16;18(3):e0282951. doi: 10.1371/journal.pone.0282951. eCollection 2023. PLoS One. 2023. PMID: 36928080 Free PMC article.
-
Cesarean section in Ethiopia: prevalence and sociodemographic characteristics.J Matern Fetal Neonatal Med. 2019 Apr;32(7):1130-1135. doi: 10.1080/14767058.2017.1401606. Epub 2017 Nov 20. J Matern Fetal Neonatal Med. 2019. PMID: 29103331
-
Observed trends in the magnitude of socioeconomic and area-based inequalities in use of caesarean section in Ethiopia: a cross-sectional study.BMC Public Health. 2020 Aug 11;20(1):1222. doi: 10.1186/s12889-020-09297-x. BMC Public Health. 2020. PMID: 32781997 Free PMC article.
Cited by
-
Does delivery in private hospitals contribute largely to Caesarean Section births? A path analysis using generalised structural equation modelling.PLoS One. 2020 Oct 8;15(10):e0239649. doi: 10.1371/journal.pone.0239649. eCollection 2020. PLoS One. 2020. PMID: 33031397 Free PMC article.
-
Determinants of Cesarean Section Deliveries in Public Hospitals of Addis Ababa, Ethiopia, 2018/19: A Case-Control Study.Obstet Gynecol Int. 2020 Apr 20;2020:9018747. doi: 10.1155/2020/9018747. eCollection 2020. Obstet Gynecol Int. 2020. PMID: 32373175 Free PMC article.
-
Caesarean section delivery rates and associated factors in a faith-based referral hospital in Ghana: A retrospective analysis.PLoS One. 2024 May 16;19(5):e0301634. doi: 10.1371/journal.pone.0301634. eCollection 2024. PLoS One. 2024. PMID: 38753814 Free PMC article.
-
Exploring the evolution and future prospects of Amharic to English machine translation: a systematic review.Front Artif Intell. 2025 May 23;8:1456245. doi: 10.3389/frai.2025.1456245. eCollection 2025. Front Artif Intell. 2025. PMID: 40486917 Free PMC article.
-
Task shifting of emergency caesarean section in south Ethiopia: are we repeating the brain drain.Pan Afr Med J. 2020 Jul 1;36:145. doi: 10.11604/pamj.2020.36.145.19330. eCollection 2020. Pan Afr Med J. 2020. PMID: 32874409 Free PMC article.
References
-
- Althabe F, Sosa C, Beliza’n JM, Gibbons L, Jacquerioz F, Bergel E. Caesarean section rates and maternal and neonatal mortality in low-, medium-, and high-income countries: an ecological study. Birth. 2006;4:270–277. - PubMed
-
- Volpe FM. Correlation of Caesarean rates to maternal and infant mortality rates: an ecologic study of official international data. Rev Panam Salud Publica. 2011;29(5):301–308. - PubMed
MeSH terms
LinkOut - more resources
Full Text Sources
Other Literature Sources
Medical
