A fast and selective near-infrared fluorescent sensor for multicolor imaging of biological nitroxyl (HNO)
- PMID: 24564324
- PMCID: PMC3985477
- DOI: 10.1021/ja500315x
A fast and selective near-infrared fluorescent sensor for multicolor imaging of biological nitroxyl (HNO)
Abstract
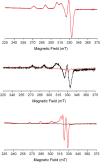
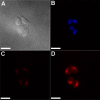
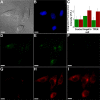
The first near-infrared fluorescent turn-on sensor for the detection of nitroxyl (HNO), the one-electron reduced form of nitric oxide (NO), is reported. The new copper-based probe, CuDHX1, contains a dihydroxanthene (DHX) fluorophore and a cyclam derivative as a Cu(II) binding site. Upon reaction with HNO, CuDHX1 displays a five-fold fluorescence turn-on in cuvettes and is selective for HNO over thiols and reactive nitrogen and oxygen species. CuDHX1 can detect exogenously applied HNO in live mammalian cells and in conjunction with the zinc-specific, green-fluorescent sensor ZP1 can perform multicolor/multianalyte microscopic imaging. These studies reveal that HNO treatment elicits an increase in the concentration of intracellular mobile zinc.
Figures


Similar articles
-
Metal-based optical probes for live cell imaging of nitroxyl (HNO).Acc Chem Res. 2015 Nov 17;48(11):2927-34. doi: 10.1021/acs.accounts.5b00388. Epub 2015 Nov 9. Acc Chem Res. 2015. PMID: 26550842
-
Development of large Stokes shift, near-infrared fluorescence probe for rapid and bioorthogonal imaging of nitroxyl (HNO) in living cells.Talanta. 2019 Feb 1;193:152-160. doi: 10.1016/j.talanta.2018.09.062. Epub 2018 Sep 24. Talanta. 2019. PMID: 30368285
-
Physical and structural properties of [Cu(BOT1)Cl]Cl, a fluorescent imaging probe for HNO.J Inorg Biochem. 2013 Jan;118:162-70. doi: 10.1016/j.jinorgbio.2012.08.025. Epub 2012 Oct 5. J Inorg Biochem. 2013. PMID: 23102502
-
Recent advances in the chemical biology of nitroxyl (HNO) detection and generation.Nitric Oxide. 2016 Jul 1;57:1-14. doi: 10.1016/j.niox.2016.04.006. Epub 2016 Apr 20. Nitric Oxide. 2016. PMID: 27108951 Free PMC article. Review.
-
Reaction-Based Fluorescent Probes for the Imaging of Nitroxyl (HNO) in Biological Systems.ACS Chem Biol. 2018 Jul 20;13(7):1714-1720. doi: 10.1021/acschembio.7b00901. Epub 2017 Dec 15. ACS Chem Biol. 2018. PMID: 29210560 Review.
Cited by
-
In Vitro and in Vivo Imaging of Nitroxyl with Copper Fluorescent Probe in Living Cells and Zebrafish.Molecules. 2018 Oct 6;23(10):2551. doi: 10.3390/molecules23102551. Molecules. 2018. PMID: 30301224 Free PMC article.
-
Recent Advances in Fluorescent Probes for Detection of HOCl and HNO.ACS Omega. 2020 Jan 21;5(4):1730-1742. doi: 10.1021/acsomega.9b03420. eCollection 2020 Feb 4. ACS Omega. 2020. PMID: 32039308 Free PMC article. Review.
-
Azanone (HNO): generation, stabilization and detection.Chem Sci. 2021 Jul 5;12(31):10410-10425. doi: 10.1039/d1sc02236a. eCollection 2021 Aug 11. Chem Sci. 2021. PMID: 34447533 Free PMC article. Review.
-
NitroxylFluor: A Thiol-Based Fluorescent Probe for Live-Cell Imaging of Nitroxyl.J Am Chem Soc. 2017 Dec 27;139(51):18476-18479. doi: 10.1021/jacs.7b11471. Epub 2017 Dec 14. J Am Chem Soc. 2017. PMID: 29239609 Free PMC article.
-
Nitroxyl (HNO): A Reduced Form of Nitric Oxide with Distinct Chemical, Pharmacological, and Therapeutic Properties.Oxid Med Cell Longev. 2016;2016:4867124. doi: 10.1155/2016/4867124. Epub 2015 Dec 7. Oxid Med Cell Longev. 2016. Retraction in: Oxid Med Cell Longev. 2016;2016:4018417. doi: 10.1155/2016/4018417. PMID: 26770654 Free PMC article. Retracted. Review.
References
-
- Cannon R. O. III Clin. Chem. 1998, 44, 1809–1819. - PubMed
-
- Bogdan C. Nat. Immunol. 2001, 2, 907–916. - PubMed
-
- Bredt D. S.; Hwang P. M.; Snyder S. H. Nature 1990, 347, 768–770. - PubMed
-
- Palmer R. M. J.; Ferrige A. G.; Moncada S. Nature 1987, 327, 524–526. - PubMed
-
- Bult H.; Boeckxstaens G. E.; Pelckmans P. A.; Jordaens F. H.; Van Maercke Y. M.; Herman A. G. Nature 1990, 345, 346–347. - PubMed
Publication types
MeSH terms
Substances
Grants and funding
LinkOut - more resources
Full Text Sources
Other Literature Sources

