

Diamidine compounds for selective inhibition of protein arginine methyltransferase 1
- PMID: 24564570
- PMCID: PMC3983339
- DOI: 10.1021/jm401884z
Diamidine compounds for selective inhibition of protein arginine methyltransferase 1
Abstract
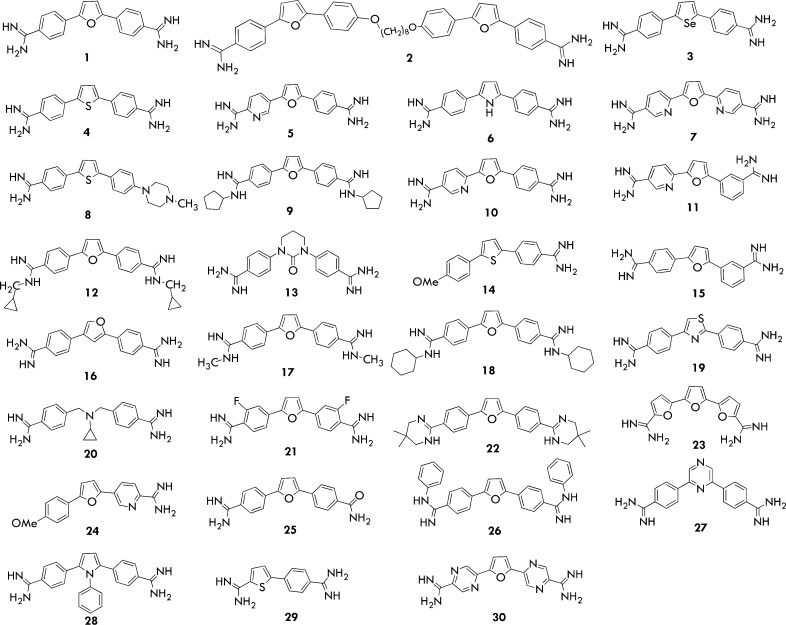
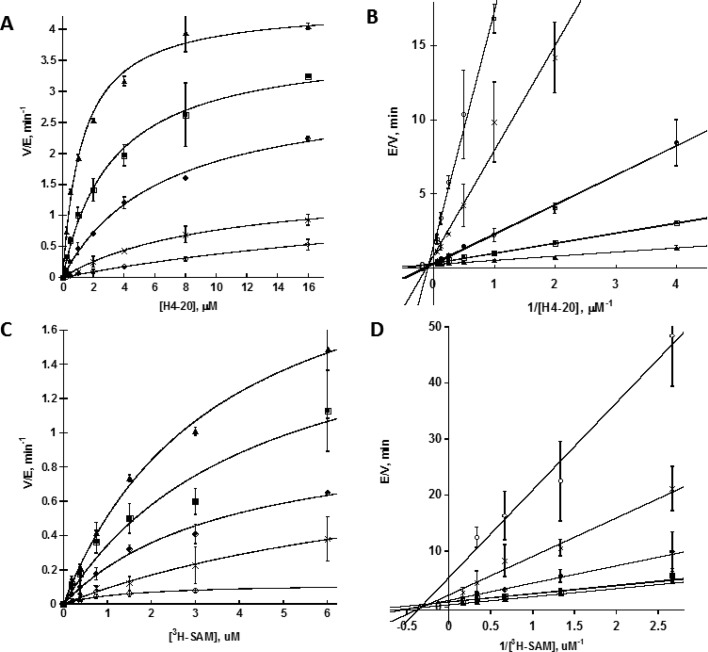
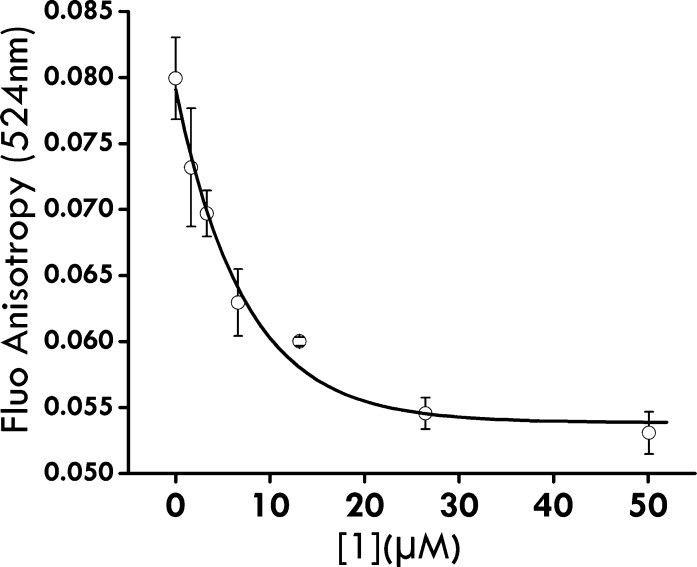
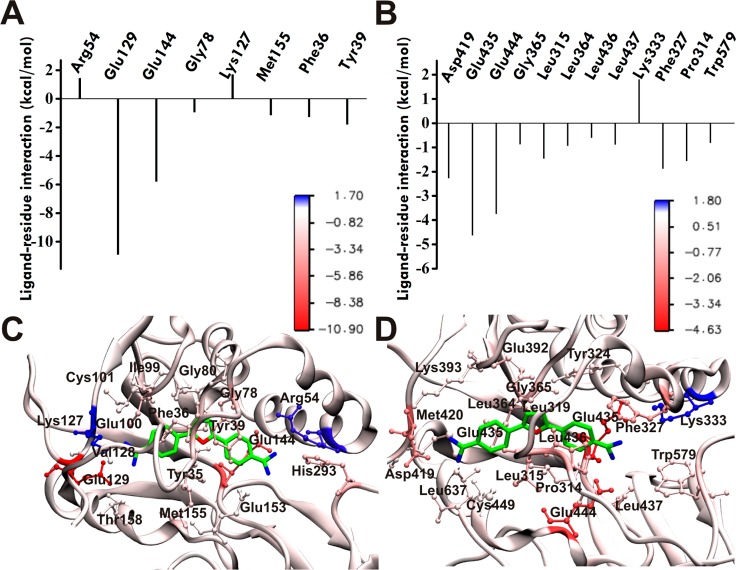
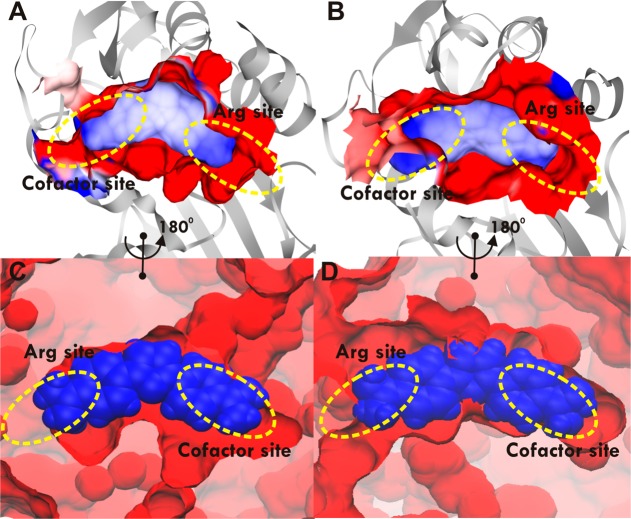
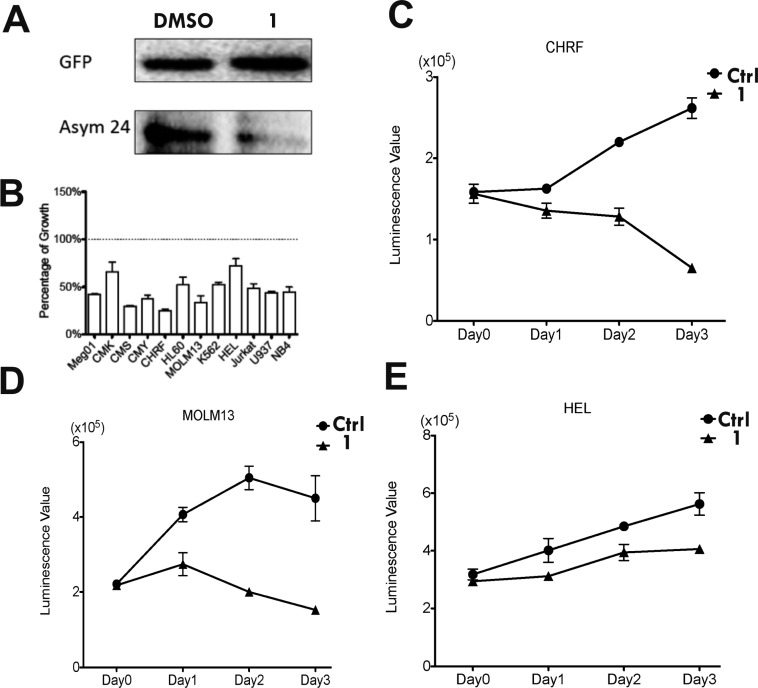
Protein arginine methylation is a posttranslational modification critical for a variety of biological processes. Misregulation of protein arginine methyltransferases (PRMTs) has been linked to many pathological conditions. Most current PRMT inhibitors display limited specificity and selectivity, indiscriminately targeting many methyltransferase enzymes that use S-adenosyl-l-methionine as a cofactor. Here we report diamidine compounds for specific inhibition of PRMT1, the primary type I enzyme. Docking, molecular dynamics, and MM/PBSA analysis together with biochemical assays were conducted to understand the binding modes of these inhibitors and the molecular basis of selective inhibition for PRMT1. Our data suggest that 2,5-bis(4-amidinophenyl)furan (1, furamidine, DB75), one leading inhibitor, targets the enzyme active site and is primarily competitive with the substrate and noncompetitive toward the cofactor. Furthermore, cellular studies revealed that 1 is cell membrane permeable and effectively inhibits intracellular PRMT1 activity and blocks cell proliferation in leukemia cell lines with different genetic lesions.
Figures
Similar articles
-
The Development of Tetrazole Derivatives as Protein Arginine Methyltransferase I (PRMT I) Inhibitors.Int J Mol Sci. 2019 Aug 6;20(15):3840. doi: 10.3390/ijms20153840. Int J Mol Sci. 2019. PMID: 31390828 Free PMC article.
-
Design and synthesis of novel PRMT1 inhibitors and investigation of their binding preferences using molecular modelling.Bioorg Med Chem Lett. 2017 Oct 15;27(20):4635-4642. doi: 10.1016/j.bmcl.2017.09.016. Epub 2017 Sep 8. Bioorg Med Chem Lett. 2017. PMID: 28927791
-
Exploration of cyanine compounds as selective inhibitors of protein arginine methyltransferases: synthesis and biological evaluation.J Med Chem. 2015 Feb 12;58(3):1228-43. doi: 10.1021/jm501452j. Epub 2015 Jan 21. J Med Chem. 2015. PMID: 25559100 Free PMC article.
-
Structure, Function, and Activity of Small Molecule and Peptide Inhibitors of Protein Arginine Methyltransferase 1.J Med Chem. 2024 Sep 26;67(18):15931-15946. doi: 10.1021/acs.jmedchem.4c00490. Epub 2024 Sep 9. J Med Chem. 2024. PMID: 39250434 Free PMC article. Review.
-
Overview of PRMT1 modulators: Inhibitors and degraders.Eur J Med Chem. 2024 Dec 5;279:116887. doi: 10.1016/j.ejmech.2024.116887. Epub 2024 Sep 19. Eur J Med Chem. 2024. PMID: 39316844 Review.
Cited by
-
The Development of Tetrazole Derivatives as Protein Arginine Methyltransferase I (PRMT I) Inhibitors.Int J Mol Sci. 2019 Aug 6;20(15):3840. doi: 10.3390/ijms20153840. Int J Mol Sci. 2019. PMID: 31390828 Free PMC article.
-
Protein arginine methyltransferases: insights into the enzyme structure and mechanism at the atomic level.Cell Mol Life Sci. 2019 Aug;76(15):2917-2932. doi: 10.1007/s00018-019-03145-x. Epub 2019 May 23. Cell Mol Life Sci. 2019. PMID: 31123777 Free PMC article. Review.
-
Computer-Aided Drug Design in Epigenetics.Front Chem. 2018 Mar 12;6:57. doi: 10.3389/fchem.2018.00057. eCollection 2018. Front Chem. 2018. PMID: 29594101 Free PMC article. Review.
-
Detection of PRMT1 inhibitors with stopped flow fluorescence.Signal Transduct Target Ther. 2018 Mar 9;3:6. doi: 10.1038/s41392-018-0009-6. eCollection 2018. Signal Transduct Target Ther. 2018. PMID: 29535867 Free PMC article.
-
Nuclear PRMT1 expression is associated with poor prognosis and chemosensitivity in gastric cancer patients.Gastric Cancer. 2016 Jul;19(3):789-97. doi: 10.1007/s10120-015-0551-7. Epub 2015 Oct 15. Gastric Cancer. 2016. PMID: 26472729
References
-
- Spannhoff A.; Sippl W.; Jung M. Cancer Treatment of the Future: Inhibitors of Histone Methyltransferases. Int. J. Biochem. Cell Biol. 2009, 41, 4–11. - PubMed
-
- Krause C. D.; Yang Z.; Kim Y. S.; Lee J. H.; Cook J. R.; Pestka S. Protein Arginine Methyltransferases: Evolution and Assessment of Their Pharmacological and Therapeutic Potential. Pharmacol. Ther. 2007, 113, 50–87. - PubMed
-
- Lin W.-J.; Gary J. D.; Yang M. C.; Clarke S.; Herschman H. R. The Mammalian Immediate-Early Tis21 Protein and the Leukemia-Associated Btg1 Protein Interact with a Protein-Arginine N-Methyltransferase. J. Biol. Chem. 1996, 271, 15034–15044. - PubMed
Publication types
MeSH terms
Substances
Grants and funding
LinkOut - more resources
Full Text Sources
Other Literature Sources
Chemical Information
Miscellaneous
