

Regulation of the human cathelicidin antimicrobial peptide gene by 1α,25-dihydroxyvitamin D3 in primary immune cells
- PMID: 24565560
- PMCID: PMC4127358
- DOI: 10.1016/j.jsbmb.2014.02.004
Regulation of the human cathelicidin antimicrobial peptide gene by 1α,25-dihydroxyvitamin D3 in primary immune cells
Abstract
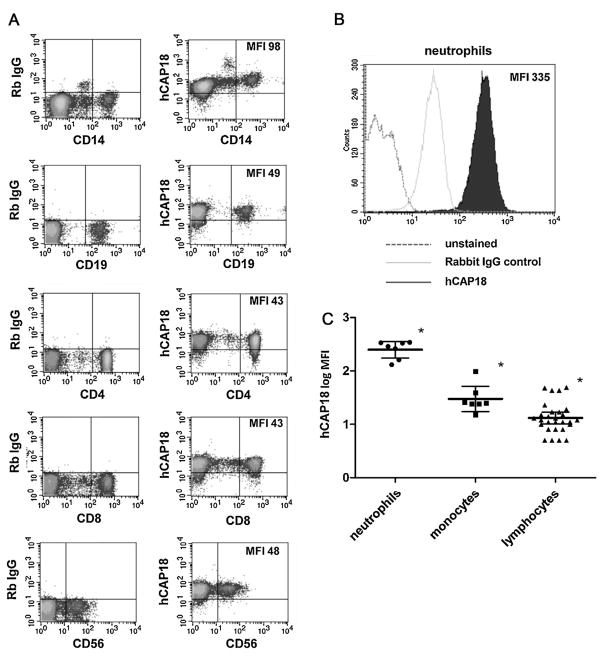
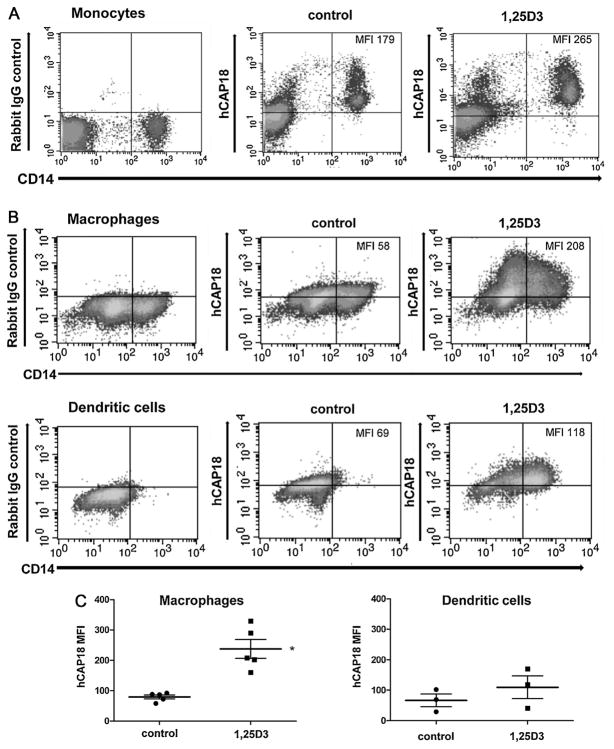
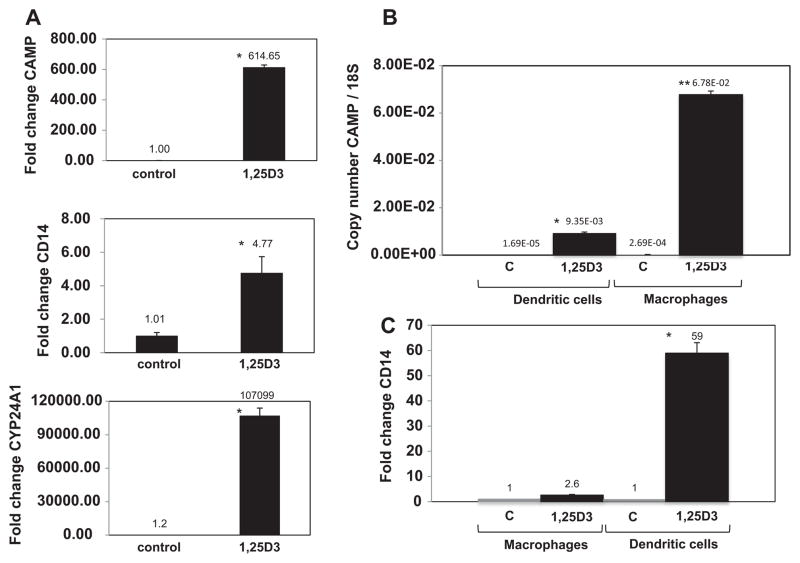
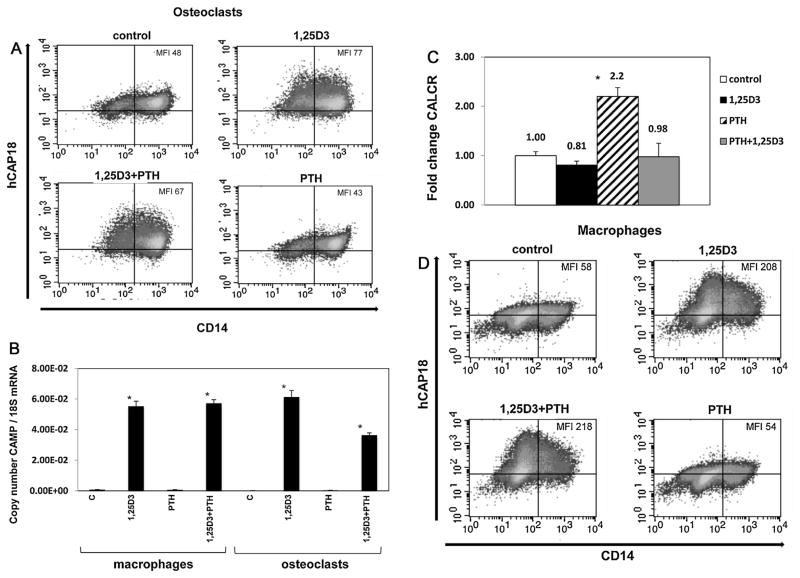
Production of the human cathelicidin antimicrobial peptide gene (hCAP18/LL-37), is regulated by 1α,25-dihydroxyvitamin D3 (1,25D3) and is critical in the killing of pathogens by innate immune cells. In addition, secreted LL-37 binds extracellular receptors and modulates the recruitment and activity of both innate and adaptive immune cells. Evidence suggests that during infections activated immune cells locally produce increased levels of 1,25D3 thus increasing production of hCAP18/LL-37. The relative expression levels of hCAP18/LL-37 among different immune cell types are not well characterized. The aim of this study was to determine the relative levels of hCAP18/LL-37 in human peripheral blood immune cells and determine to what extent 1,25D3 increased its expression in peripheral blood-derived cells. We show for the first time, a hierarchy of expression of hCAP18 in freshly isolated cells with low levels in lymphocytes, intermediate levels in monocytes and the highest levels found in neutrophils. In peripheral blood-derived cells, the highest levels of hCAP18 following treatment with 1,25D3 were in macrophages, while comparatively lower levels were found in GM-CSF-derived dendritic cells and osteoclasts. We also tested whether treatment with parathyroid hormone in combination with 1,25D3 would enhance hCAP18 induction as has been reported in skin cells, but we did not find enhancement in any immune cells tested. Our results indicate that hCAP18 is expressed at different levels according to cell type and lineage. Furthermore, potent induction of hCAP18 by 1,25D3 in macrophages and dendritic cells may modulate functions of both innate and adaptive immune cells at sites of infection.
Keywords: Dendritic cells; LL-37; Macrophage; Osteoclasts; Parathyroid hormone; hCAP18.
Copyright © 2014 Elsevier Ltd. All rights reserved.
Conflict of interest statement
The authors have no financial conflicts of interest.
Figures
Similar articles
-
Tumor-produced versican V1 enhances hCAP18/LL-37 expression in macrophages through activation of TLR2 and vitamin D3 signaling to promote ovarian cancer progression in vitro.PLoS One. 2013;8(2):e56616. doi: 10.1371/journal.pone.0056616. Epub 2013 Feb 12. PLoS One. 2013. PMID: 23424670 Free PMC article.
-
LL-37, the neutrophil granule- and epithelial cell-derived cathelicidin, utilizes formyl peptide receptor-like 1 (FPRL1) as a receptor to chemoattract human peripheral blood neutrophils, monocytes, and T cells.J Exp Med. 2000 Oct 2;192(7):1069-74. doi: 10.1084/jem.192.7.1069. J Exp Med. 2000. PMID: 11015447 Free PMC article.
-
Interleukin 13 exposure enhances vitamin D-mediated expression of the human cathelicidin antimicrobial peptide 18/LL-37 in bronchial epithelial cells.Infect Immun. 2012 Dec;80(12):4485-94. doi: 10.1128/IAI.06224-11. Epub 2012 Oct 8. Infect Immun. 2012. PMID: 23045480 Free PMC article.
-
The human cathelicidin hCAP18/LL-37: a multifunctional peptide involved in mycobacterial infections.Peptides. 2010 Sep;31(9):1791-8. doi: 10.1016/j.peptides.2010.06.016. Epub 2010 Jun 25. Peptides. 2010. PMID: 20600427 Review.
-
Vitamin D3 modulates the innate immune response through regulation of the hCAP-18/LL-37 gene expression and cytokine production.Inflamm Res. 2016 Jan;65(1):25-32. doi: 10.1007/s00011-015-0884-z. Epub 2015 Oct 3. Inflamm Res. 2016. PMID: 26433491 Review.
Cited by
-
The roles of vitamin D and cathelicidin in type 1 diabetes susceptibility.Endocr Connect. 2021 Jan;10(1):R1-R12. doi: 10.1530/EC-20-0484. Endocr Connect. 2021. PMID: 33263562 Free PMC article. Review.
-
Vitamin D sufficiency and Staphylococcus aureus infection in children.Pediatr Infect Dis J. 2015 May;34(5):544-5. doi: 10.1097/INF.0000000000000667. Pediatr Infect Dis J. 2015. PMID: 25860535 Free PMC article.
-
Regulation of calcitriol biosynthesis and activity: focus on gestational vitamin D deficiency and adverse pregnancy outcomes.Nutrients. 2015 Jan 9;7(1):443-80. doi: 10.3390/nu7010443. Nutrients. 2015. PMID: 25584965 Free PMC article. Review.
-
Local effects of adipose tissue in psoriasis and psoriatic arthritis.Psoriasis (Auckl). 2017 Feb 3;7:17-25. doi: 10.2147/PTT.S122959. eCollection 2017. Psoriasis (Auckl). 2017. PMID: 29387604 Free PMC article. Review.
-
Significance of LL-37 on Immunomodulation and Disease Outcome.Biomed Res Int. 2020 May 16;2020:8349712. doi: 10.1155/2020/8349712. eCollection 2020. Biomed Res Int. 2020. PMID: 32509872 Free PMC article. Review.
References
-
- Lehrer RI, Ganz T. Cathelicidins: a family of endogenous antimicrobial peptides. Curr Opin Hematol. 2002;9:18–22. - PubMed
-
- White JH. Vitamin D as an inducer of cathelicidin antimicrobial peptide expression: past, present and future. J Steroid Biochem Mol Biol. 2010;121:234–238. - PubMed
-
- Wang TT, Nestel FP, Bourdeau V, Nagai Y, Wang Q, et al. Cutting edge: 1,25-dihydroxyvitamin D3 is a direct inducer of antimicrobial peptide gene expression. J Immunol. 2004;173:2909–2912. - PubMed
-
- Gombart AF, Borregaard N, Koeffler HP. Human cathelicidin antimicrobial peptide (CAMP) gene is a direct target of the vitamin D receptor and is strongly up-regulated in myeloid cells by 1,25-dihydroxyvitamin D3. FASEB J. 2005;19:1067–1077. - PubMed
Publication types
MeSH terms
Substances
Grants and funding
LinkOut - more resources
Full Text Sources
Other Literature Sources
Medical
Research Materials
