

Evaluation of intrarenal oxygenation in iodinated contrast-induced acute kidney injury-susceptible rats by blood oxygen level-dependent magnetic resonance imaging
- PMID: 24566288
- PMCID: PMC4944390
- DOI: 10.1097/RLI.0000000000000031
Evaluation of intrarenal oxygenation in iodinated contrast-induced acute kidney injury-susceptible rats by blood oxygen level-dependent magnetic resonance imaging
Abstract
Objectives: The objectives of this study were to evaluate differences in intrarenal oxygenation as assessed by blood oxygen level-dependent (BOLD) magnetic resonance imaging in contrast-induced acute kidney injury (CIAKI)-susceptible rats when using 4 contrast media with different physicochemical properties and to demonstrate the feasibility of acquiring urinary neutrophil gelatinase-associated lipocalin (NGAL) levels as a marker of CIAKI in this model.
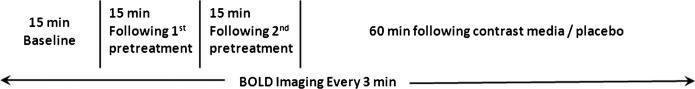
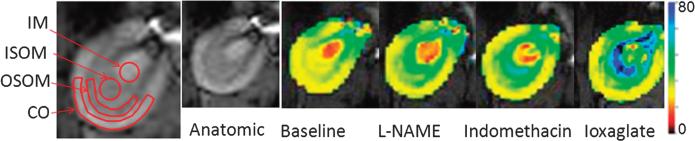
Materials and methods: Our institutional animal care and use committee approved the study. Sixty-six Sprague-Dawley rats were divided into CIAKI-susceptible groups (received nitric oxide synthase inhibitor N-nitro-L-arginine methyl ester [10 mg/kg] and cycloxygenase inhibitor indomethacin [10mg/kg]) and control groups (received saline instead). One of the 4 iodinated contrast agents (iothalamate, iohexol, ioxaglate, or iodixanol) was then administered (1600-mg organic iodine per kilogram of body weight). Multiple blood oxygen level-dependent magnetic resonance images were acquired on a Siemens 3.0-T scanner using a multiple gradient recalled echo sequence at baseline, after N-nitro-L-arginine methyl ester (or saline), indomethacin (or saline), and iodinated contrast agent (or placebo). R2* (R2*=1/T2*) maps were generated inline on the scanner. A mixed-effects growth curve model with first-order autoregressive variance-covariance was used to analyze the temporal data. Urinary NGAL, a marker of kidney injury (unlike serum creatinine), was measured 4 hours after contrast injection in the 2 subgroups.
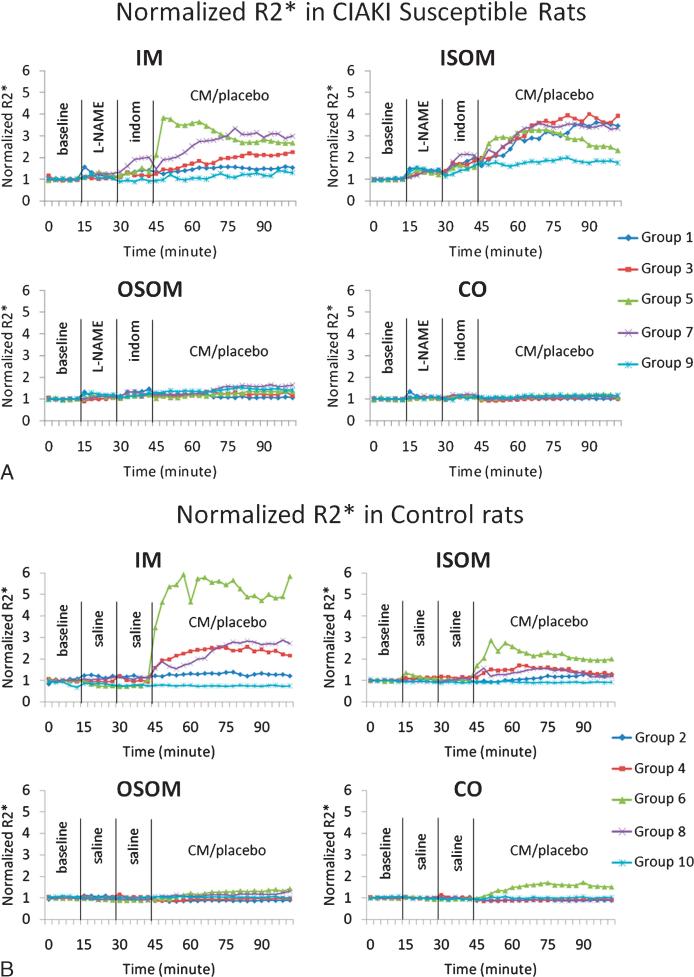
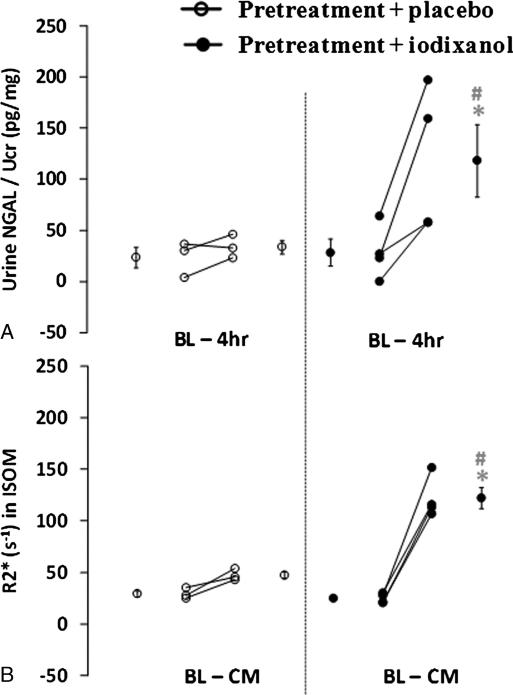
Results: Differences in blood oxygen level-dependent magnetic resonance imaging results between the contrast media were observed in all 4 renal regions. However, the inner stripe of the outer medulla (ISOM) showed the most pronounced changes in the CIAKI-susceptible group and R2* increased significantly (P<0.01) over time with all 4 contrast media. In the control groups, only iodixanol showed an increase in R2* (P<0.05) over time. There was an agreement between increases in NGAL and R2* values in ISOM.
Conclusions: In rats susceptible to CIAKI, those receiving contrast media had significant increases in R2* in renal ISOM compared with those receiving placebo. The agreement between NGAL and R2* values in the ISOM suggests that the observed immediate increase in R2* after contrast injection may be the earliest biomarker of renal injury. Further studies are necessary to establish threshold values of R2* associated with acute kidney injury and address the specificity of R2* to renal oxygenation status.
Figures
References
-
- Seeliger E, Sendeski M, Rihal CS, et al. Contrast-induced kidney injury: mechanisms, risk factors, and prevention. Eur Heart J. 2012;33:2007–2015. - PubMed
-
- Heyman SN, Reichman J, Brezis M. Pathophysiology of radiocontrast nephropathy: a role for medullary hypoxia. Invest Radiol. 1999;34:685–691. - PubMed
-
- Heyman SN, Rosen S, Rosenberger C. Renal parenchymal hypoxia, hypoxia adaptation, and the pathogenesis of radiocontrast nephropathy. Clin J Am Soc Nephrol. 2008;3:288–296. - PubMed
-
- Wong PC, Li Z, Guo J, et al. Pathophysiology of contrast-induced nephropathy. Int J Cardiol. 2012;158:186–192. - PubMed
Publication types
MeSH terms
Substances
Grants and funding
LinkOut - more resources
Full Text Sources
Other Literature Sources
Medical
Miscellaneous
