

Impact of MRI head placement on glioma response assessment
- PMID: 24566765
- PMCID: PMC4026260
- DOI: 10.1007/s11060-014-1403-8
Impact of MRI head placement on glioma response assessment
Abstract
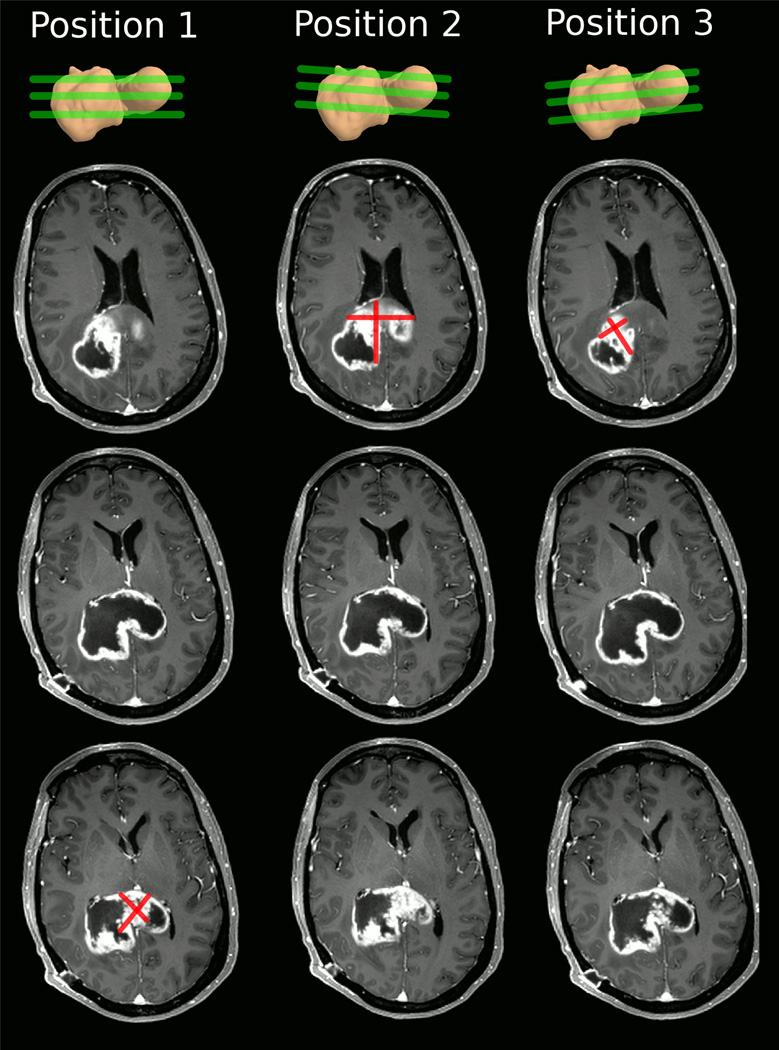
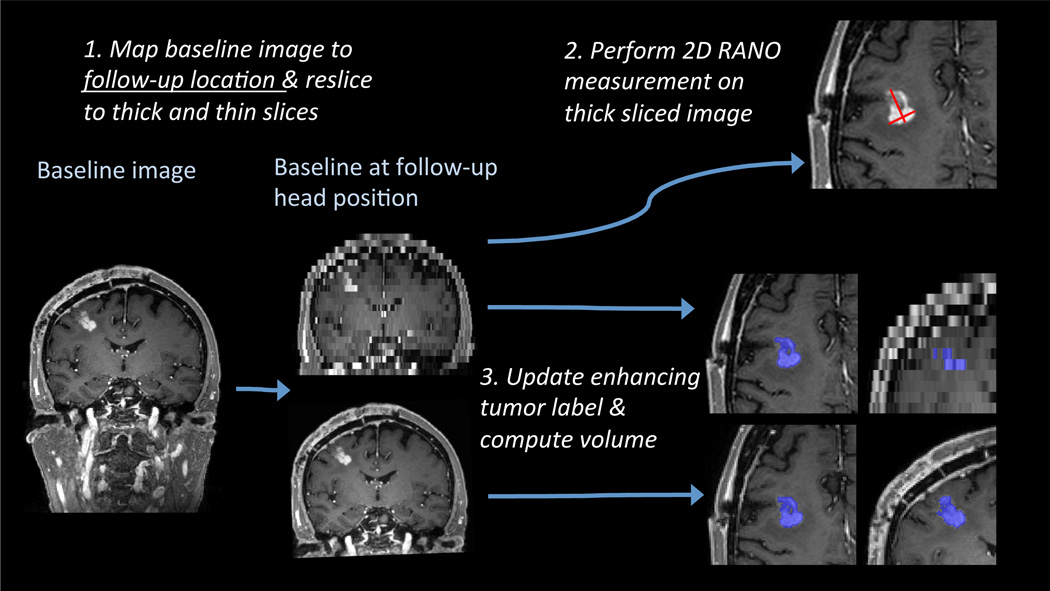
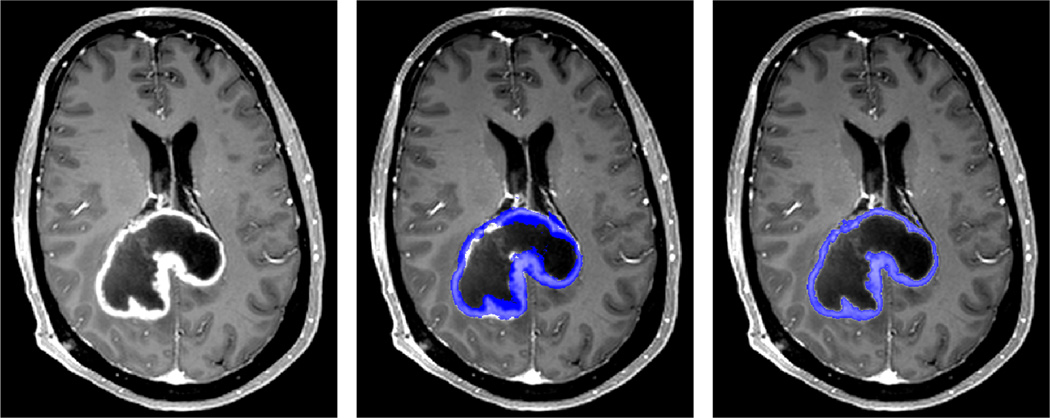
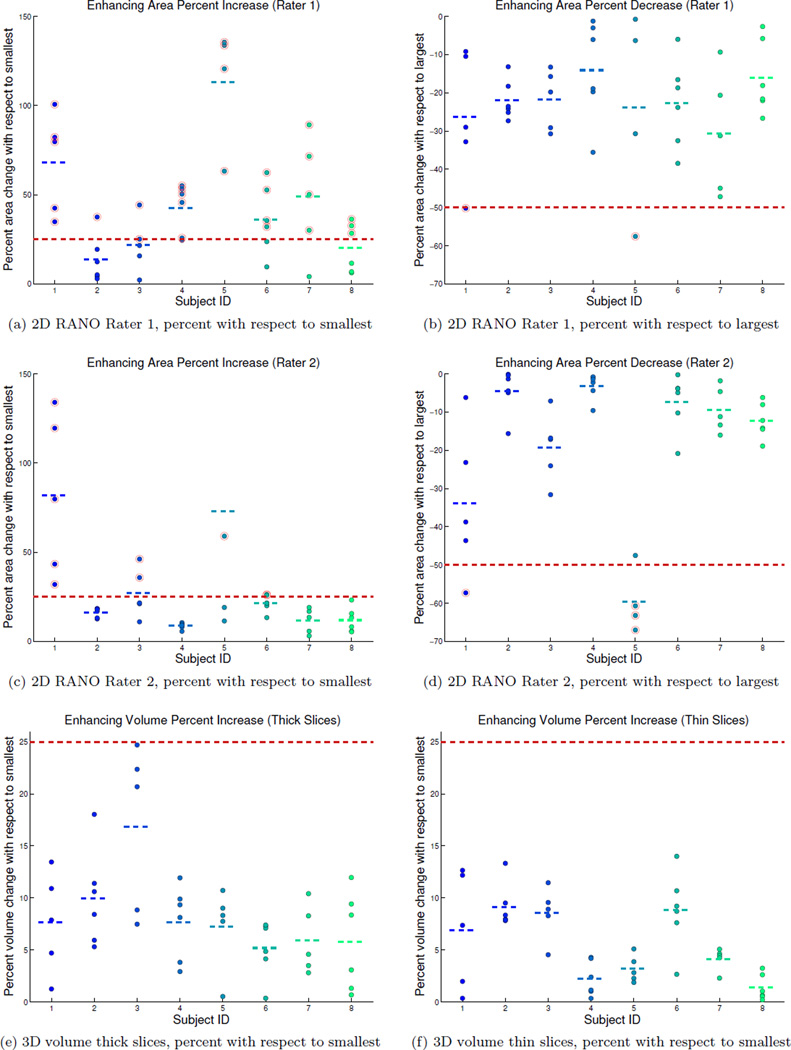
Diagnosis of progressive disease or (partial) response during tumor treatment is based on manual size estimates of enhancing tumor area: an expert measures two perpendicular diameters of the enhancing tumor region in a single MRI slice with the largest enhancing area. This paper analyzes the reliability of the area measure with respect to head placement in the MRI scanner and compares it with 3D volume measures in a dataset of eight subjects (5-7 follow-up scans each) with high-grade glioma. We show that the manual area measure is highly sensitive to head position changes, with a root mean squared error of 22%, compared to volume estimates with less than 5% error. In our simulated study using the 2D manual measurements, the majority of subjects would have been incorrectly diagnosed with progressive disease without any true anatomical changes. These results highlight the urgent need for revised and more reliable response assessment criteria, for example, based on increased slice resolution, 3D volume analysis and percent change computation with respect to an average of patient specific longitudinal measurements instead of a single measurement to define progression or response.
Conflict of interest statement
Figures
References
-
- Benner T, Wisco JJ, van der Kouwe AJW, Fischl B, Vangel MG, Hochberg FH, Sorensen AG. Comparison of manual and automatic section positioning of brain MR images. Radiology. 2006;239(1):246–254. http://dx.doi.org/10.1148/radiol.2391050221. - DOI - PubMed
-
- van den Bent MJ, Wefel JS, Schiff D, Taphoorn MJ, Jaeckle K, Junck L, Armstrong T, Choucair A, Waldman AD, Gorlia T, Chamberlain M, Baumert BG, Vogelbaum MA, Macdonald DR, Reardon DA, Wen PY, Chang SM, Jacobs AH. Response assessment in neuro-oncology (a report of the RANO group): assessment of outcome in trials of diffuse low-grade gliomas. Lancet Oncol. 2011;12(6):583–593. http://dx.doi.org/10.1016/S1470-2045(11)70057-2. - DOI - PubMed
-
- van der Kouwe AJ, Benner T, Fischl B, Schmitt F, Salat DH, Harder M, Sorensen AG, Dale AM. On-line automatic slice positioning for brain MR imaging. Neuroimage. 2005;27(1):222–230. http://dx.doi.org/10.1016/j.neuroimage.2005.03.035. - DOI - PubMed
-
- van der Kouwe AJ, Benner T, Salat DH, Fischl B. Brain Morphometry with Multiecho MPRAGE. NeuroImage. 2008;40(2):559–569. http://dx.doi.org/10.1016/j.neuroimage.2007.12.025. - DOI - PMC - PubMed
-
- Lin L. A concordance correlation coefficient to evaluate reproducibility. Biometrics. 1989;45(1):255–268. http://www.jstor.org/stable/2532051. - PubMed
Publication types
MeSH terms
Grants and funding
- U24 RR021382/RR/NCRR NIH HHS/United States
- 1R01-NS070963/NS/NINDS NIH HHS/United States
- RC1-AT005728-01/AT/NCCIH NIH HHS/United States
- 5U01-CA154601-03/CA/NCI NIH HHS/United States
- R01 NS052585/NS/NINDS NIH HHS/United States
- R01-NS052585-01/NS/NINDS NIH HHS/United States
- AG022381/AG/NIA NIH HHS/United States
- R01 AG008122/AG/NIA NIH HHS/United States
- 5P41-EB015896-15/EB/NIBIB NIH HHS/United States
- R01-EB006758/EB/NIBIB NIH HHS/United States
- UL1 RR025758/RR/NCRR NIH HHS/United States
- S10 RR023043/RR/NCRR NIH HHS/United States
- R01 EB006758/EB/NIBIB NIH HHS/United States
- R01 AG022381/AG/NIA NIH HHS/United States
- U01 MH093765/MH/NIMH NIH HHS/United States
- R01 NS070963/NS/NINDS NIH HHS/United States
- P41-RR14075/RR/NCRR NIH HHS/United States
- 1R21-NS072652-01/NS/NINDS NIH HHS/United States
- N01-CM-2008-00060C/CM/NCI NIH HHS/United States
- S10 RR019307/RR/NCRR NIH HHS/United States
- 1S10-RR019307/RR/NCRR NIH HHS/United States
- K12 CA090354/CA/NCI NIH HHS/United States
- P41 RR014075/RR/NCRR NIH HHS/United States
- K24 CA125440/CA/NCI NIH HHS/United States
- 1UL1-RR025758-01/RR/NCRR NIH HHS/United States
- RC1 AT005728/AT/NCCIH NIH HHS/United States
- 5R01-AG008122-22/AG/NIA NIH HHS/United States
- U01 CA154601/CA/NCI NIH HHS/United States
- 1S10-RR023401/RR/NCRR NIH HHS/United States
- U24-RR021382/RR/NCRR NIH HHS/United States
- 1S10-RR023043/RR/NCRR NIH HHS/United States
- 5U01-MH093765/MH/NIMH NIH HHS/United States
- R21 NS072652/NS/NINDS NIH HHS/United States
- P41 EB015896/EB/NIBIB NIH HHS/United States
- S10 RR023401/RR/NCRR NIH HHS/United States
LinkOut - more resources
Full Text Sources
Other Literature Sources
Medical
