

High-resolution melting analysis for accurate detection of BRAF mutations: a systematic review and meta-analysis
- PMID: 24566771
- PMCID: PMC3933866
- DOI: 10.1038/srep04168
High-resolution melting analysis for accurate detection of BRAF mutations: a systematic review and meta-analysis
Abstract
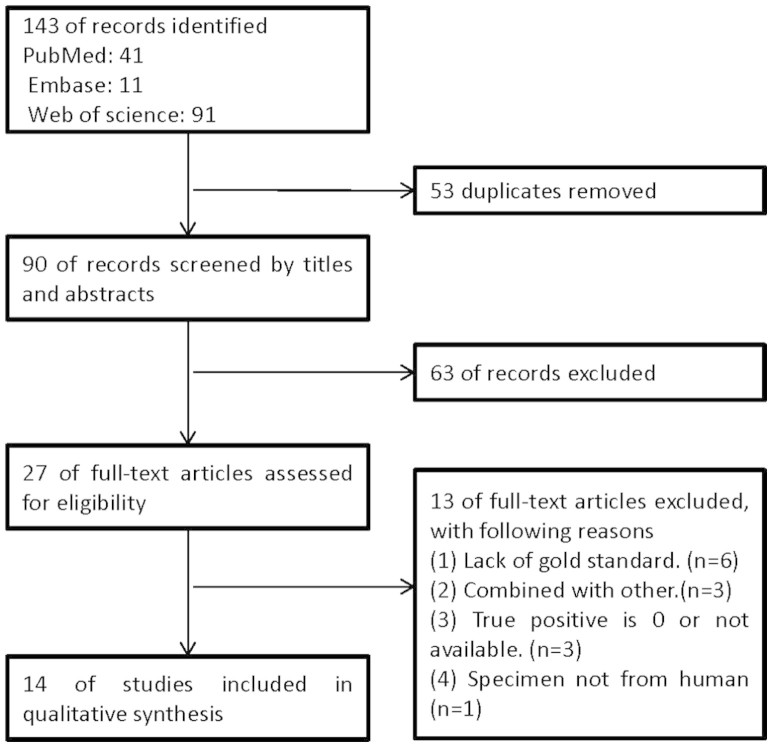
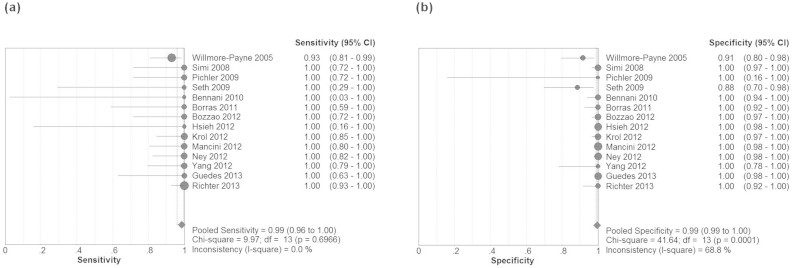
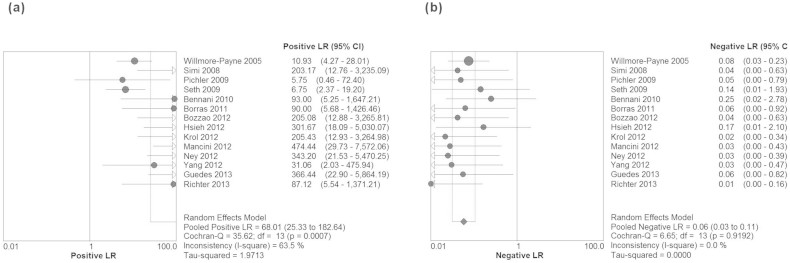
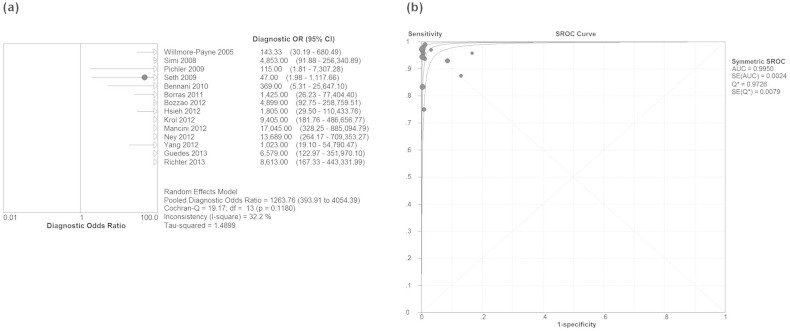
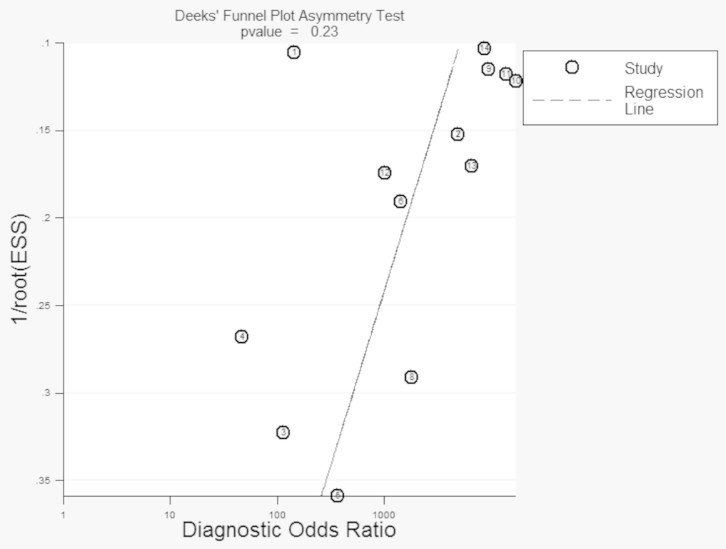
The high-resolution melting curve analysis (HRMA) might be a good alternative method for rapid detection of BRAF mutations. However, the accuracy of HRMA in detection of BRAF mutations has not been systematically evaluated. We performed a systematic review and meta-analysis involving 1324 samples from 14 separate studies. The overall sensitivity of HRMA was 0.99 (95% confidence interval (CI) = 0.75-0.82), and the overall specificity was very high at 0.99 (95% CI = 0.94-0.98). The values for the pooled positive likelihood ratio, negative likelihood ratio, and diagnostic odds ratio were 68.01 (95% CI = 25.33-182.64), 0.06 (95% CI = 0.03-0.11), and 1263.76 (95% CI = 393.91-4064.39), respectively. The summary receiver operating characteristic curve for the same data shows an area of 1.00 and a Q* value of 0.97. The high sensitivity and specificity, simplicity, low cost, less labor or time and rapid turnaround make HRMA a good alternative method for rapid detection of BRAF mutations in the clinical practice.
Figures
References
-
- Pao W. & Girard N. New driver mutations in non-small-cell lung cancer. Lancet Oncol. 12, 175–180 (2011). - PubMed
-
- Sclafani F., Gullo G., Sheahan K. & Crown J. BRAF mutations in melanoma and colorectal cancer: A single oncogenic mutation with different tumour phenotypes and clinical implications. Crit Rev Oncol Hematol. 87, 55–68 (2013). - PubMed
-
- Tol J., Nagtegaal I. D. & Punt C. J. BRAF mutation in metastatic colorectal cancer. N Engl J Med. 361, 98–99 (2009). - PubMed
-
- Kumar R. et al. BRAF mutations in metastatic melanoma: a possible association with clinical outcome. Clin Cancer Res. 9, 3362–3368 (2003). - PubMed
Publication types
MeSH terms
Substances
LinkOut - more resources
Full Text Sources
Other Literature Sources
Research Materials
