. 2014 Apr;164(4):2139-56.
doi: 10.1104/pp.113.235119. Epub 2014 Feb 24.

Origin of β-carotene-rich plastoglobuli in Dunaliella bardawil

Affiliations

Origin of β-carotene-rich plastoglobuli in Dunaliella bardawil

Lital Davidi et al. Plant Physiol. 2014 Apr.

Abstract

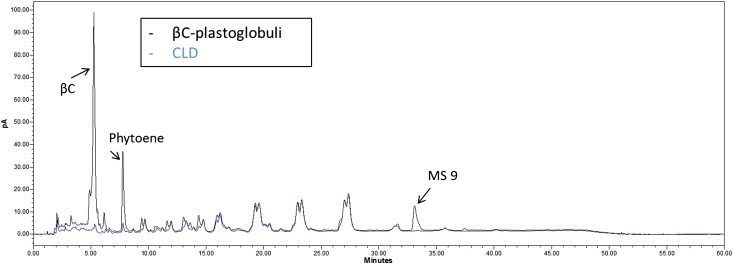
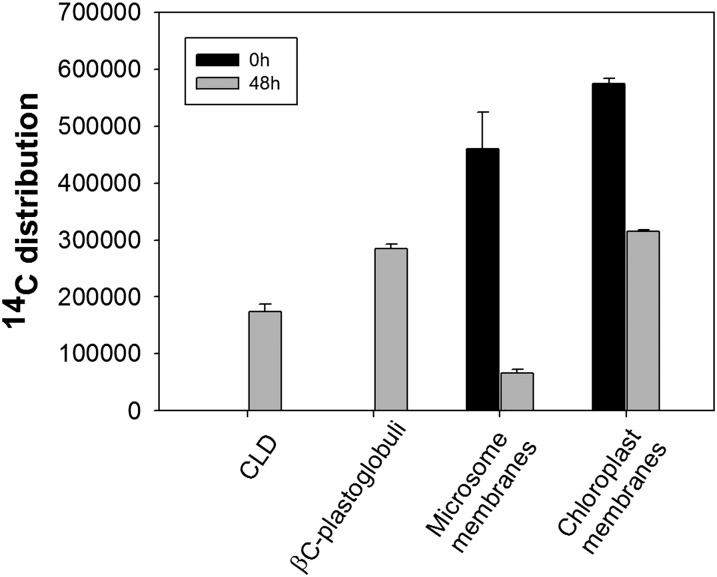
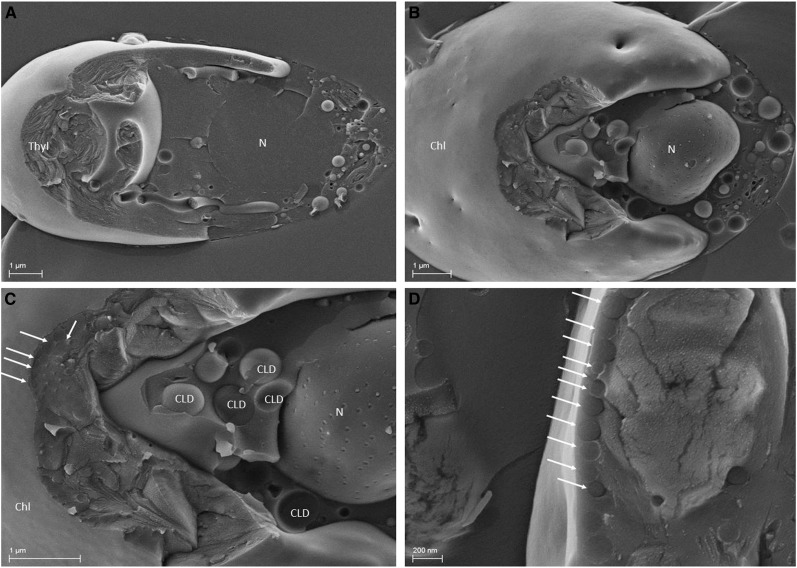
The halotolerant microalgae Dunaliella bardawil accumulates under nitrogen deprivation two types of lipid droplets: plastoglobuli rich in β-carotene (βC-plastoglobuli) and cytoplasmatic lipid droplets (CLDs). We describe the isolation, composition, and origin of these lipid droplets. Plastoglobuli contain β-carotene, phytoene, and galactolipids missing in CLDs. The two preparations contain different lipid-associated proteins: major lipid droplet protein in CLD and the Prorich carotene globule protein in βC-plastoglobuli. The compositions of triglyceride (TAG) molecular species, total fatty acids, and sn-1+3 and sn-2 positions in the two lipid pools are similar, except for a small increase in palmitic acid in plastoglobuli, suggesting a common origin. The formation of CLD TAG precedes that of βC-plastoglobuli, reaching a maximum after 48 h of nitrogen deprivation and then decreasing. Palmitic acid incorporation kinetics indicated that, at early stages of nitrogen deprivation, CLD TAG is synthesized mostly from newly formed fatty acids, whereas in βC-plastoglobuli, a large part of TAG is produced from fatty acids of preformed membrane lipids. Electron microscopic analyses revealed that CLDs adhere to chloroplast envelope membranes concomitant with appearance of small βC-plastoglobuli within the chloroplast. Based on these results, we propose that CLDs in D. bardawil are produced in the endoplasmatic reticulum, whereas βC-plastoglobuli are made, in part, from hydrolysis of chloroplast membrane lipids and in part, by a continual transfer of TAG or fatty acids derived from CLD.


Figures

Figure 1.
Figure 1.
TLC and Nile red analysis of isolated lipid droplets. A, Nile red (NR) fluorescence emission spectra of D. bardawil control cells (DB+N), nitrogen-deprived cells (DB-N), and purified CLD and βC-plastoglobuli. B, TLC analysis of neutral lipids in lipid extracts from D. bardawil control cells (lane 1), nitrogen-deprived cells (lane 2), purified CLD (lane 3), purified βC-plastoglobuli (lane 4), and 1 µg of triolein standard (lane 5). C, TLC analysis of polar lipids in extracts from D. bardawil chloroplasts (lane 1), 1 µg of diacylglyceride standard (lane 2), purified βC-plastoglobuli (lane 3), and purified CLD (lane 4) after iodine staining (Left) and galactolipid staining (Right). The major polar lipids of CLD and βC-plastoglobuli are marked in arrowheads. TLC and Nile red analysis were conducted in samples normalized to equal cell number. DGDG, Digalactosyldiacylglycerol; SQDG, sulfoquinovosyldiacylglycerol. [See online article for color version of this figure.]
Figure 2.
Figure 2.
HPLC chromatogram of lipid extracts from cytoplasmic droplets and βC-plastoglobuli. The chromatogram represents lipid extraction fractions from cytoplasmic droplets (blue) and βC-plastoglobuli (black) and was compared with TAG standards. βC, β-Carotene; MS-9, TAG peak that was collected and sent to MS and FAME analysis. [See online article for color version of this figure.]
Figure 3.
Figure 3.
Fatty acid composition and positional analysis of D. bardawil isolated lipid droplets. A, Total fatty acid composition analysis of DB+N and DB-N cells together with isolated lipid droplets (CLD and βC-plastoglobuli). Fatty acid compositions of TAG sn-1+3 (B) or sn-2 (C) positions from CLD and βC-plastoglobuli are shown. The values shown represent means and SDs of three to five replicates.
Figure 4.
Figure 4.
Time course of formation of CLD and βC-plastoglobuli TAG. A, Total TAG contents. D. bardawil cells were grown in nitrogen-deficient media. At each indicated time, the cytoplasm and chloroplast fractions were separated, and TAGs were extracted from each fraction. The values shown represent means and SDs of three replicates. B, Incorporation of 14C-PA during nitrogen deprivation into cytoplasmic and chloroplast membranes and lipid droplets. Cells were labeled with 14C-PA for 4 h starting 12 h after the onset of nitrogen deprivation. Cell samples taken at 0, 24, 48, or 72 h after labeling were fractionated, and the 14C in each fraction was determined. Numbers represent averages of three repeats. C, Turnover of polar lipids cytoplasmic and chloroplastic membranes. 14C contents in cytoplasmic and chloroplastic membrane fractions are expressed as percent from 0 time at the end of labeling with 14C-PA. The chloroplast corrected plot shows the ratio of counts divided by chlorophyll contents in the fraction (also expressed as percentage from 0 time).
Figure 5.
Figure 5.
Changes in distribution of 14C-labeled lipids during nitrogen deprivation. Cells were labeled with 14C-PA before the onset of nitrogen deprivation and then deprived of nitrogen for 48 h in the absence of 14C-PA. Black and gray bars represent the levels of 14C in the different lipid fractions before and after nitrogen deprivation, respectively.
Figure 6.
Figure 6.
Protein profiles and western-blot analysis of major lipid-associated proteins in CLD and βC-plastoglobuli. A, Protein analysis of CLD and βC-plastoglobuli by SDS-PAGE. Lane 1, Molecular mass standards. Lane 2, Proteins from βC-plastoglobuli. Lane 3, Proteins from CLD. Twenty micrograms of proteins was loaded on each lane. The results shown are representative of three experiments. B, Western blot on purified CLD (lane 1), βC-plastoglobuli (lane 2), and pure chloroplasts (lane 3) proteins with anti-Rubisco (dilution 1:20,000), anti-MLDP (dilution 1:1,000), and anti-CGP (dilution 1:2,000) antibodies (Abs). [See online article for color version of this figure.]
Figure 7.
Figure 7.
CGP amino acid sequence, paralogs, and phylogenetic tree. A, CGP amino acid sequence. Pro residues are shadowed yellow. Prorich basic domains are marked by lines 1 to 3. The arrow indicates putative cleavage site of the transit peptide. B, Multiple alignment of CGP with three paralogs. C, Phylogenic tree of CGP with SOUL domain proteins from algae and Arabidopsis. The alignment was generated by the CLUSTAL W program, and the phylogram was constructed by the neighbor-joining method using MEGA5 software (Tamura et al., 2011). CGP and orthologs (followed by National Center for Biotechnology Information accession numbers in parentheses): SOUL domain-containing protein (Coccomyxa subellipsoidea; EIE18519.1), hypothetical protein (C. reinhardtii; XP_001691398.1), hypothetical protein (Volvox carteri; XP_002947474.1), predicted protein (Ostreococcus lucimarinus; XP_001418356.1), SOUL heme-binding protein (Arabidopsis; NP_001190345.1), hypothetical protein (Chlorella variabilis; EFN56543.1), SOUL domain-containing protein in plastoglobules (Arabidopsis; ABG48434.1), and MLDP (D. bardawil; AEW43285.1). [See online article for color version of this figure.]
Figure 8.
Figure 8.
Localization of MLDP and CGP by Gold immunolabeling. Algae were cultured in DB+N or DB-N for 6 d. Cryosections of fixed cells were treated with anti-MLDP or anti-CGP polyclonal rabbit antibodies followed by incubation with 10 nm gold-conjugated goat anti-rabbit antibodies. A, DB+N cells treated with anti-MLDP antibodies. B, DB-N cells treated with anti-MLDP antibodies. C, Enlarged view of B showing high concentration of gold particles (white arrows) in the periphery of the CLD but not in the contact area of the chloroplast. D, DB+N cells treated with anti-CGP antibodies. E, DB-N cells treated with anti-CGP antibodies. F, Enlarged view of E showing gold particles in the periphery of the βC-plastoglobuli (white arrows). N, Nucleus; St, starch. Bars in A, B, D, and E = 2 µm. Bars in C and E = 200 nm.
Figure 9.
Figure 9.
Time courses of mRNA and protein expression of MLDP and CGP. A, mRNA expression of MLDP and CGP. PCR was conducted on complementary DNA (cDNA) extracted from nitrogen-deprived cells at the indicated times with MLDP and CGP complete gene-specific primers, respectively, and 18S primers as control. B, Protein expression of MLDP and CGP was conducted by western-blot analysis. D. bardawil was grown in nitrogen-deficient media during 7 d of culturing. Each lane contains proteins extracted from 2 × 10⁶ cells. Dilution of anti-MLDP antibody was 1:1,000 and anti-CGP antibody was 1:2,000. The results shown are representative of three experiments. Ab, Antibody.
Figure 10.
Figure 10.
Rates of accumulation of TAG and β-carotene and decrease in chlorophyll during nitrogen deprivation in D. bardawil. D. bardawil cells were cultured in DB+N or DB-N media for 10 d. A, TAG content of DB+N and DB-N cells. Quantification of TAG by TLC analysis of lipid extracts (Fig. 1B) was by reference to 1 µg of triolein standard. B, β-Carotene content of DB+N and DB-N cells. β-Carotene content was calculated from the absorbance of the cell lipid extracts at 480 nm. C, Chlorophyll content of DB+N and DB-N cells. Chlorophyll content was calculated from the absorbance of the cell lipid extracts at 663 nm. The values shown represent means and SDs of three replicates.
Figure 11.
Figure 11.
Cryo-SEM images of D. bardawil control and nitrogen-deprived cells. A, D. bardawil cell grown in complete medium (control cell). B, D. bardawil cells after 2 d of nitrogen deprivation. C, Enlarged view of B showing CLD in the cytoplasm and high cluster of βC-plastoglobuli in the chloroplast (white arrows). D, Section of chloroplast showing an array of βC-plastoglobuli (white arrows). Chl, Chloroplast; N, nucleus; Thyl, thylakoid membranes.
Figure 12.
Figure 12.
Tomographic reconstruction of D. bardawil cell after 1 d of nitrogen deprivation. A, TEM image of control cell grown in nitrogen-sufficient medium. Bar = 1 µm. B, TEM image of cell grown in nitrogen-deficient medium for 1 d. It should be noted that this thick (470-nm) slice was used for tomographic analysis (C and D) compared with the standard 70 nm in A. Bar = 2 µm. C, Tomographic view of a cell section containing four CLD and βC-plastoglobuli. Bar = 500 nm. D, Enlarged view of B showing two CLDs surrounded by a nonuniformly stained chloroplast envelope membranes (arrowheads) and adjacent βC-plastoglobuli (red arrows). Bar = 200 nm. M, Mitochondrion; N, nucleus; P, pyranoid; St, starch. [See online article for color version of this figure.]

Similar articles

Cited by

References

    1. Al-Hasan RH, Ghannoum MA, Sallal AK, Abu-Elteen KH, Radwan SS. (1987) Correlative changes of growth, pigmentation and lipid composition of Dunaliella salina in response to halostress. J Gen Microbiol 133: 2607–2616
    1. Altschul SF, Madden TL, Schäffer AA, Zhang J, Zhang Z, Miller W, Lipman DJ. (1997) Gapped BLAST and PSI-BLAST: a new generation of protein database search programs. Nucleic Acids Res 25: 3389–3402 - PMC - PubMed
    1. Austin JR, II, Frost E, Vidi PA, Kessler F, Staehelin LA. (2006) Plastoglobules are lipoprotein subcompartments of the chloroplast that are permanently coupled to thylakoid membranes and contain biosynthetic enzymes. Plant Cell 18: 1693–1703 - PMC - PubMed
    1. Avron A, Ben-Amotz A. (1992) Dunaliella: Physiology, Biochemistry and Biotechnology. CRC Press, Boca Raton, FL
    1. Bates PD, Durrett TP, Ohlrogge JB, Pollard M. (2009) Analysis of acyl fluxes through multiple pathways of triacylglycerol synthesis in developing soybean embryos. Plant Physiol 150: 55–72 - PMC - PubMed

Publication types

MeSH terms

LinkOut - more resources