. 2014 Apr 11;289(15):10831-10842.
doi: 10.1074/jbc.M113.536391. Epub 2014 Feb 24.

Coordinated nuclear and synaptic shuttling of afadin promotes spine plasticity and histone modifications

Affiliations

Coordinated nuclear and synaptic shuttling of afadin promotes spine plasticity and histone modifications

Jon-Eric VanLeeuwen et al. J Biol Chem. .

Abstract

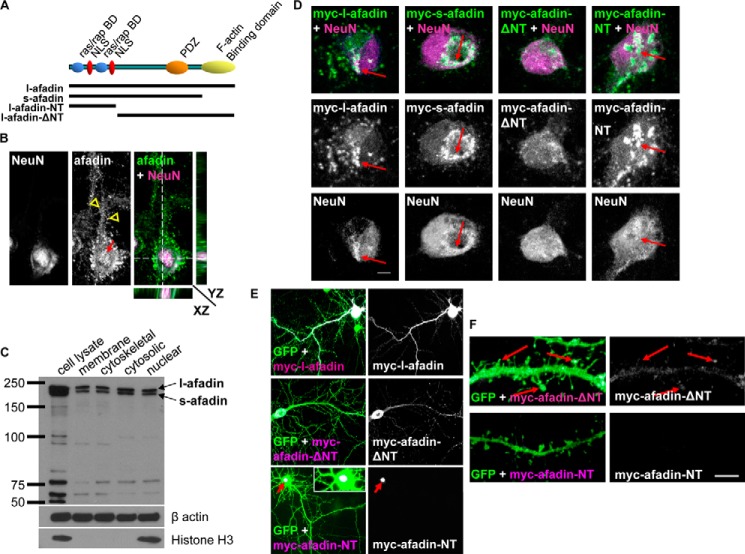
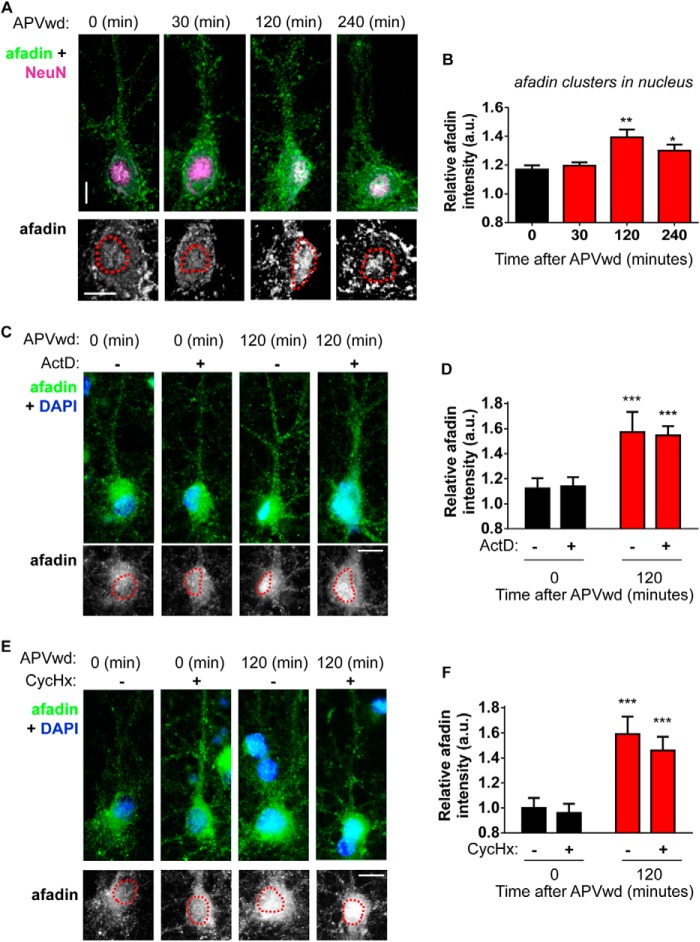
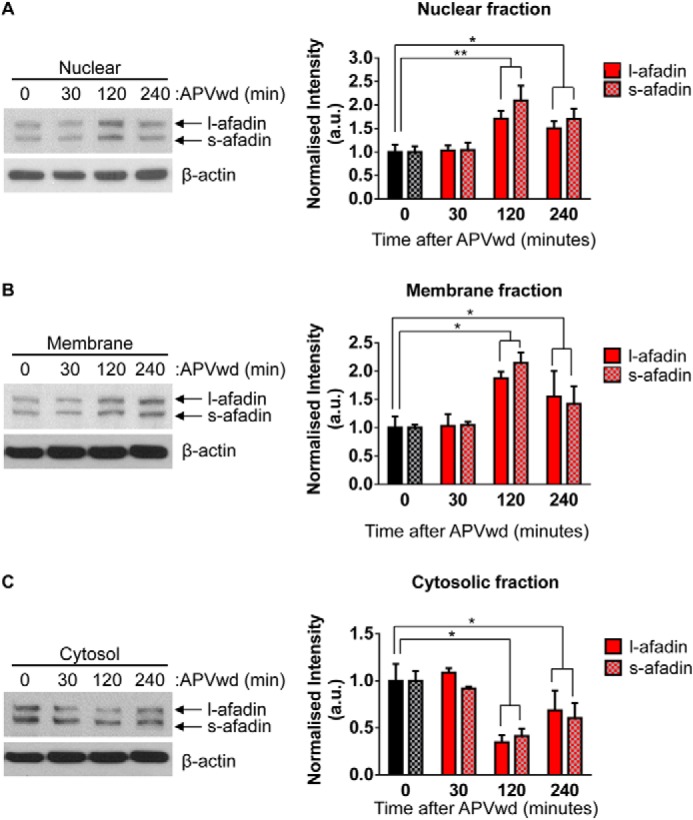
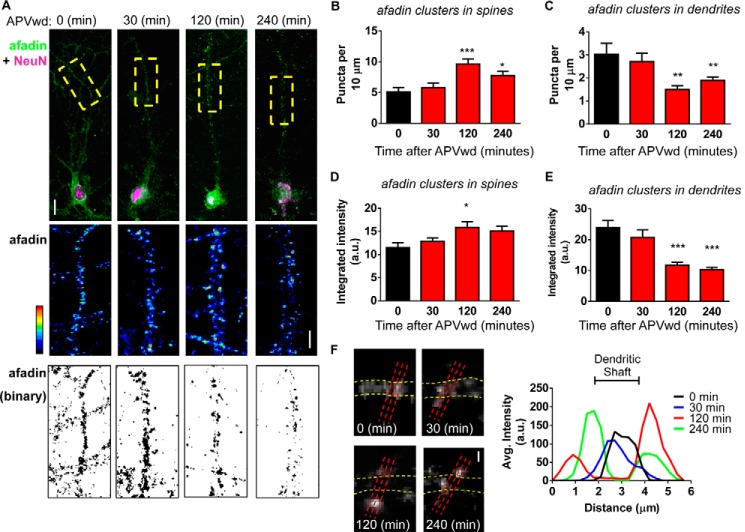
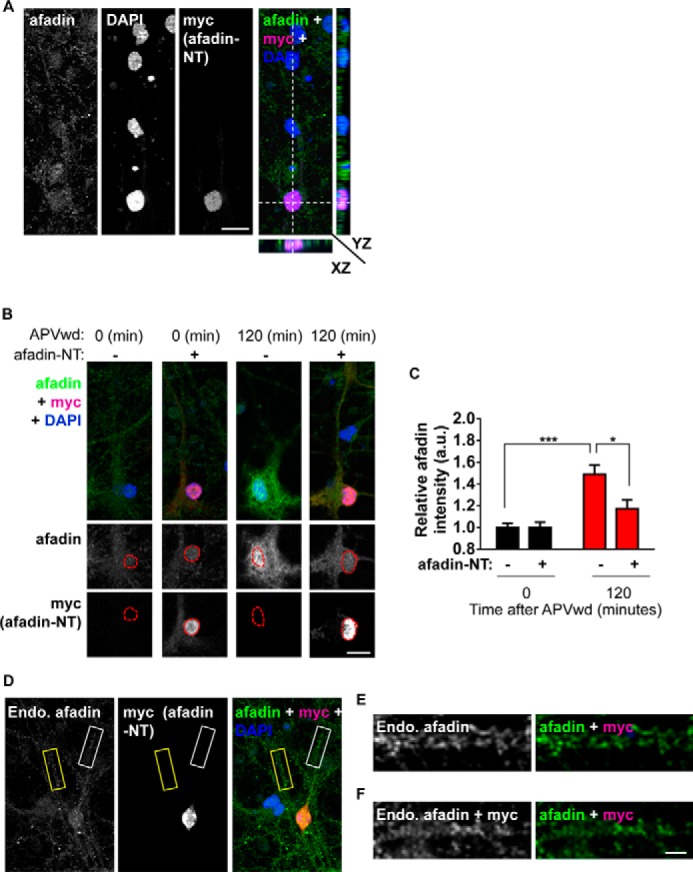
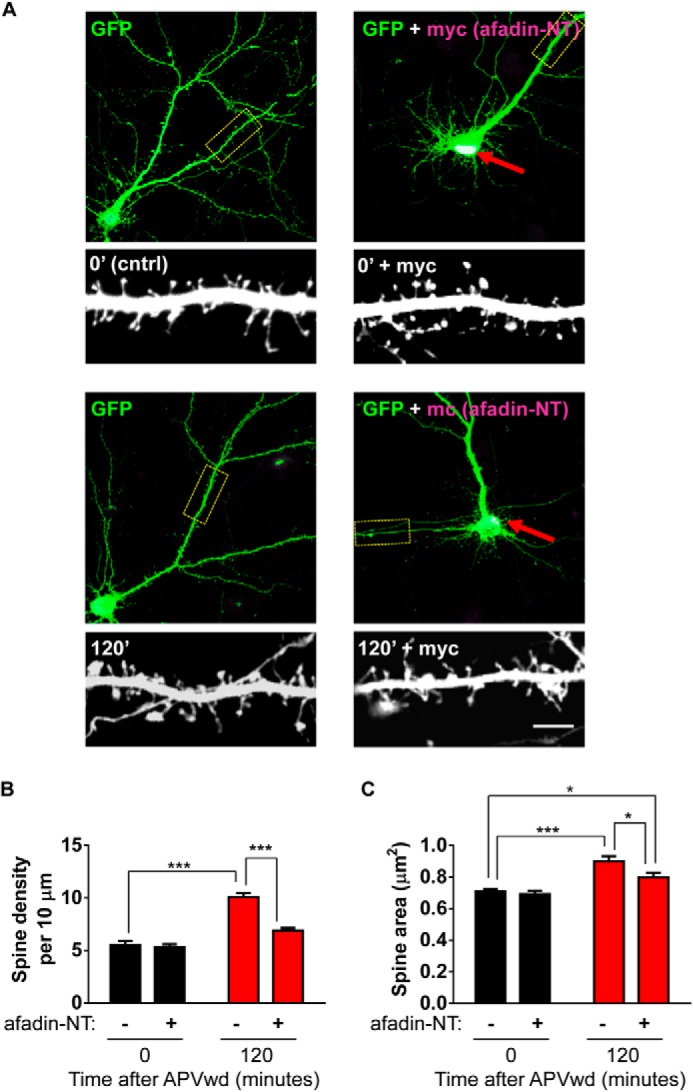
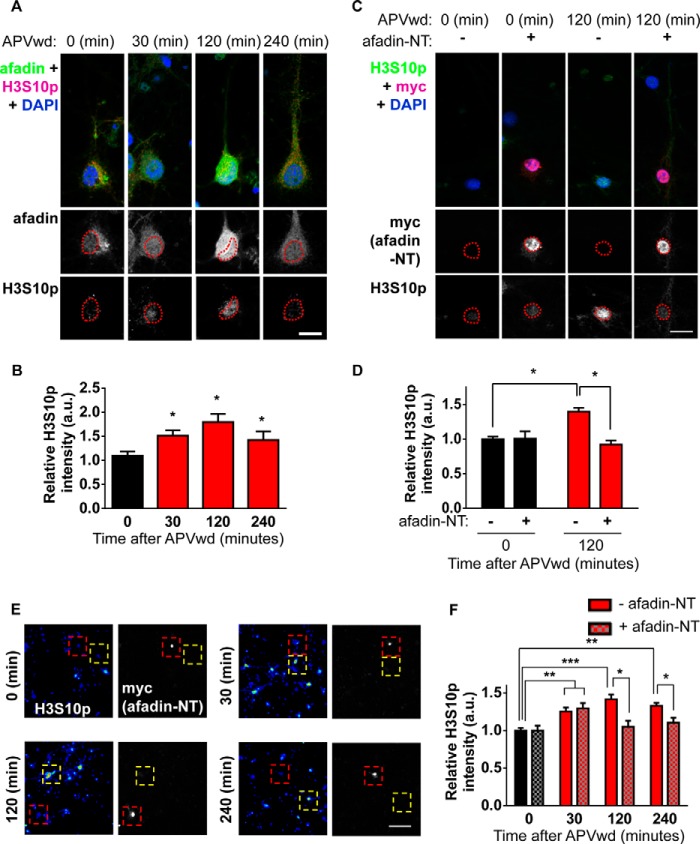
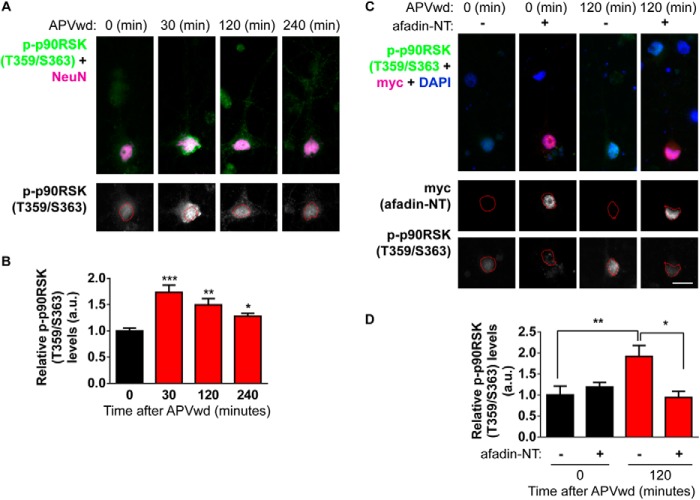
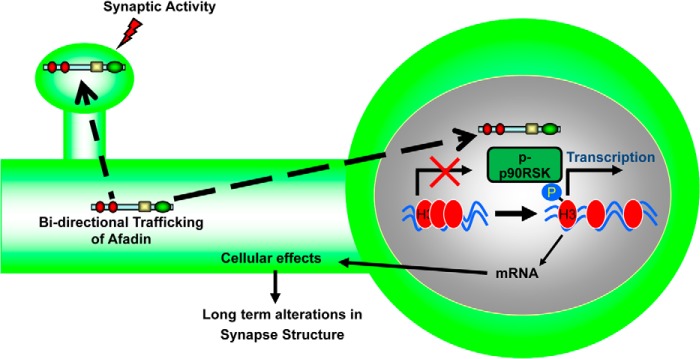
The ability of a neuron to transduce extracellular signals into long lasting changes in neuronal morphology is central to its normal function. Increasing evidence shows that coordinated regulation of synaptic and nuclear signaling in response to NMDA receptor activation is crucial for long term memory, synaptic tagging, and epigenetic signaling. Although mechanisms have been proposed for synapse-to-nuclear communication, it is unclear how signaling is coordinated at both subcompartments. Here, we show that activation of NMDA receptors induces the bi-directional and concomitant shuttling of the scaffold protein afadin from the cytosol to the nucleus and synapses. Activity-dependent afadin nuclear translocation peaked 2 h post-stimulation, was independent of protein synthesis, and occurred concurrently with dendritic spine remodeling. Moreover, activity-dependent afadin nuclear translocation coincides with phosphorylation of histone H3 at serine 10 (H3S10p), a marker of epigenetic modification. Critically, blocking afadin nuclear accumulation attenuated activity-dependent dendritic spine remodeling and H3 phosphorylation. Collectively, these data support a novel model of neuronal nuclear signaling whereby dual-residency proteins undergo activity-dependent bi-directional shuttling from the cytosol to synapses and the nucleus, coordinately regulating dendritic spine remodeling and histone modifications.

Keywords: AF-6; Cell Biology; Chromatin Histone Modification; Dendritic Spine; Neurobiology; Nucleus; Signaling; Small GTPase; Synapses; Synaptic Plasticity.


Figures

FIGURE 1.
FIGURE 1.
Afadin nuclear localization is dependent on its N-terminal domain. A, schematic diagram depicting the structure and important domains of l- and s-afadin and truncated constructs. B, confocal image of cortical neuron (DIV 25) immunostained for endogenous l/s-afadin. Red arrow indicates nuclear afadin; yellow open arrowheads indicate dendritic afadin. Orthogonal projections show afadin colocalized with the nuclear marker NeuN. C, Western blot of neuronal subcellular fractionations confirmed l-/s-afadin was present in multiple subcellular compartments. D, representative images of Myc-l-afadin, Myc-s-afadin, Myc-afadin-ΔNT, or Myc-afadin-NT expression in neurons. E, cultured cortical neurons (DIV 25) expressing enhanced GFP and either Myc-l-afadin or Myc-afadin-NT constructs; red arrow highlights restricted localization of Myc-afadin-NT to the nucleus. Inset image shows Myc-afadin-NT localization to the nucleus. F, Myc-afadin-ΔNT, but not Myc-afadin-NT, is found at spines. Scale bars, 5 μm.
FIGURE 2.
FIGURE 2.
Activity-dependent afadin nuclear accumulation. A, representative images of afadin nuclear accumulation following treatment. Red dashed lines indicate the nucleus. B, time course of afadin nuclear accumulation in all neurons 30, 120, and 240 min after activity-dependent simulation or control (0 min)-treated cells. Activity-dependent afadin nuclear localization peaked 120 min post-activation (*, p < 0.05; **, p < 0.01, ANOVA). C, representative immunofluorescence images of cortical neurons staining for afadin, subjected to NMDA receptor activation (120 min) or not, in the presence or absence of 20 μm ActD. Nuclei were identified by DAPI staining, and are indicated by the red dashed line in lower panels. D, quantification of C demonstrated that nuclear localization of afadin increases 120 min post-activation in the presence or absence of ActD (***, p < 0.001, two-way ANOVA). E, endogenous afadin staining in cortical neurons following NMDA receptor activation, in the presence or absence of 0.5 μm CycHx. The nucleus, identified by DAPI, is indicated by the red dashed line in lower panels. F, quantification of E revealed increased afadin nuclear accumulation 120 min post-activation, regardless of CycHx treatment (***, p < 0.001, two-way ANOVA). APVwd, activity-dependent stimulation.
FIGURE 3.
FIGURE 3.
Altered afadin presence in distinct subcompartments following activity-dependent stimulation. A, assessment of l- and s-afadin presence in nuclear (A), membrane (B). and cytosol (C) of cortical neurons before and after NMDA receptor stimulation by Western blotting. Quantification reveals a significant increase in l/s-afadin presence in nuclear and membrane fractions 120 and 240 min post-treatment (A and B; *, p < 0.05; **, p < 0.01, two-way ANOVA). Conversely, a significant decrease in both l- and s-afadin levels was observed in cytosol fractions 120 and 240 min following activity-dependent stimulation (C; *, p < 0.05, two-way ANOVA). APVwd, activity-dependent stimulation.
FIGURE 4.
FIGURE 4.
Bi-directional translocation of afadin following activity-dependent stimulation. A, representative images of afadin nuclear and dendritic localization in neurons with increased nuclear content following NMDA receptor activation. Insets show magnified regions of dendrites outlined by yellow boxes; images were pseudo-colored or binarized to demonstrate endogenous afadin puncta in dendrites and synapses of control and treated neurons. B and C, quantification of afadin puncta linear density at synapses or within dendrites following activity-dependent stimulation. At 120 and 240 min post-treatment, a significant increase in afadin puncta linear density at synapses (B) concurrent with a decrease of afadin puncta in dendrites (C) is observed (*, p < 0.05; **, p < 0.01; ***, p < 0.001, ANOVA). D and E, quantification of afadin puncta intensity at synapses and dendrites following activity-dependent stimulation reveals an increase in afadin puncta intensity at synapses (D) and concomitant decrease in dendrites (E) (*, p < 0.05; ***, p < 0.001, ANOVA). F, high magnification images of endogenous afadin following NMDA receptor activation. Yellow dotted lines outline the dendritic shaft; red lines represent line scans taken through dendritic spines and shaft. Graphical representation of line scans of endogenous afadin localization following treatment was produced by averaging values of three line scans (6 μm) performed at three different sections of the dendrite, of equal width, from six cells per condition. Values were then averaged and plotted; region where line scans pass through dendrites (dendritic shaft) is indicated. Scale bars, 10 and 5 μm (A) and 1 μm (F). APVwd, activity-dependent stimulation.
FIGURE 5.
FIGURE 5.
Myc-afadin-NT blocks activity-dependent afadin nuclear accumulation. A, confocal image of cortical neuron costained for endogenous l/s-afadin, DAPI, and Myc (afadin-NT). Orthogonal projections of XZ and YZ planes reveal that afadin-NT colocalizes with DAPI, demonstrating restricted localization of afadin-NT to the nucleus. B, representative images of control (0 min) or NMDA receptor-activated (120 min) neurons expressing, or not, Myc-afadin-NT. C, quantification of afadin nuclear content in B (*, p < 0.05; ***, p < 0.001, two-way ANOVA). Scale bars, 15 μm. D, representative image of cortical neurons expressing, or not, Myc-afadin-NT. Yellow box indicates a dendrite from a cell not expressing Myc-afadin-NT; white box indicates a dendrite from a Myc-afadin-NT positive cell. E, high magnification image of dendrite from a non-Myc-afadin-NT positive cell, outlined by a yellow box in D. D, high magnification image of dendrite from a Myc-afadin-NT positive cell, outlined by a white box in D. Scale bar, 15 μm (A and B) and 5 μm (F). APVwd, activity-dependent stimulation.
FIGURE 6.
FIGURE 6.
Afadin nuclear accumulation contributes to activity-dependent spine remodeling. A, representative images of treated cortical neurons expressing enhanced GFP with or without Myc-afadin-NT; red arrows indicate restricted nuclear expression of Myc-afadin-NT. Insets are representative of high magnification images of secondary dendrites and dendritic spines. B and C, quantification of spine morphology and linear density. B, NMDA receptor activation (120 min) results in an increase in dendritic spine linear density; this effect is attenuated in neurons expressing Myc-afadin-NT (***, p < 0.001, two-way ANOVA). C, examination of dendritic spine area reveals an increase in spine area following treatment. In neurons expressing Myc-afadin-NT, activity-dependent stimulation increased spine area compared with control but was significantly reduced compared with control stimulated cells (*, p < 0.05; ***, p < 0.001, two-way ANOVA). Scale bars, 5 μm. APVwd, activity-dependent stimulation.
FIGURE 7.
FIGURE 7.
Activity-dependent phosphorylation of histone H3 at serine 10 requires afadin nuclear translocation. A, representative high magnification images of cortical neurons costained for H3S10p and afadin following activity-dependent stimulation. Red dashed lines outline the nucleus (DAPI) in lower panels. B, quantification of H3S10p in afadin-positive cells revealed an increase in H3 phosphorylation 30, 120, and 240 min post-stimulation; neurons also display an increase in afadin nuclear content 120 min post-treatment (*, p < 0.05, ANOVA). C, representative high magnification images of neurons overexpressing, or not, Myc-afadin-NT and costained for H3S10p, following NMDA receptor activation. Red dashed lines outline the nucleus (DAPI) in lower panels. D, quantification of H3S10p in C revealed that in cells expressing Myc-afadin-NT H3 phosphorylation levels are significantly decreased compared with nonexpressing cells (*, p < 0.05; ANOVA). E, low magnification images of H3S10p and Myc-stained cortical neurons following activity-dependent stimulation for 0, 30, 120, or 240 min. Cortical neurons (DIV 25) were transfected with Myc-afadin-NT or not and probed with H3S10p. Red dashed boxes indicate cells expressing Myc-afadin-NT, and yellow dashed boxes enclose cells not expressing Myc-afadin-NT. H3S10p (images are pseudo-colored) increases in a time-dependent manner after activity-dependent stimulation in non-Myc-afadin-NT expressing cells. In Myc-afadin-NT expressing cells, H3S10p levels are significantly increased after 30 min but not at 120 or 240 min. F, quantification of relative H3S10p intensity in stimulated nontransfected and Myc-afadin-NT expressing cells shown in yellow boxes (nontransfected) or red boxes (transfected) in E. (**, p < 0.01; ***, p < 0.001, two-way ANOVA.) Scale bar, 15 μm. APVwd, activity-dependent stimulation.
FIGURE 8.
FIGURE 8.
Afadin nuclear shuttling is required for long term phosphorylation of nuclear p90RSK following activity-dependent stimulation. A, representative high magnification images of cortical neurons costained for p-p90RSK (Thr-359/Ser-363) and NeuN; red dashed lines outline the nucleus (NeuN) in lower panels. B, quantification of p-p90RSK (Thr-359/Ser-363) following activity-dependent simulation revealed an increase in p90RSK phosphorylation 30, 120, and 240 min post-stimulation (*, p < 0.05; **, p < 0.01; ***, p < 0.001, ANOVA). C, representative high magnification images of neurons overexpressing, or not, Myc-afadin-NT and costained for p-p90RSK (Thr-359/Ser-363), following NMDA receptor activation. Red dashed lines outline the nucleus (DAPI) in lower panels. D, quantification of p-p90RSK (Thr-359/Ser-363) in C revealed that in cells expressing Myc-afadin-NT H3 phosphorylation levels are significantly decreased compared with nonexpressing cells (*, p < 0.05; **, p < 0.01, ANOVA). APVwd, activity-dependent stimulation.
FIGURE 9.
FIGURE 9.
Model of afadin nuclear shuttling. Following activity-dependent stimulation, a mobile pool of afadin located in the cytosol is bi-directionally trafficked to both synapses as well to the nucleus in a time-dependent manner. In the nucleus, afadin's presence is required for the late phosphorylation of p90RSK that can directly phosphorylate histone H3 at serine 10. This in turn contributes to long term alterations in synapse structure.

References

    1. Jordan B. A., Kreutz M. R. (2009) Nucleocytoplasmic protein shuttling: The direct route in synapse-to-nucleus signaling. Trends Neurosci. 32, 392–401 - PubMed
    1. Greer P. L., Greenberg M. E. (2008) From synapse to nucleus: Calcium-dependent gene transcription in the control of synapse development and function. Neuron 59, 846–860 - PubMed
    1. Ch'ng T. H., Martin K. C. (2011) Synapse-to-nucleus signaling. Curr. Opin. Neurobiol. 21, 345–352 - PMC - PubMed
    1. Berger S. L. (2007) The complex language of chromatin regulation during transcription. Nature 447, 407–412 - PubMed
    1. Riccio A. (2010) Dynamic epigenetic regulation in neurons: Enzymes, stimuli and signaling pathways. Nat. Neurosci. 13, 1330–1337 - PubMed

Publication types

LinkOut - more resources