. 2014 Mar 3;204(5):777-92.
doi: 10.1083/jcb.201307055. Epub 2014 Feb 24.

Caveolae regulate the nanoscale organization of the plasma membrane to remotely control Ras signaling

Affiliations

Caveolae regulate the nanoscale organization of the plasma membrane to remotely control Ras signaling

Nicholas Ariotti et al. J Cell Biol. .

Abstract

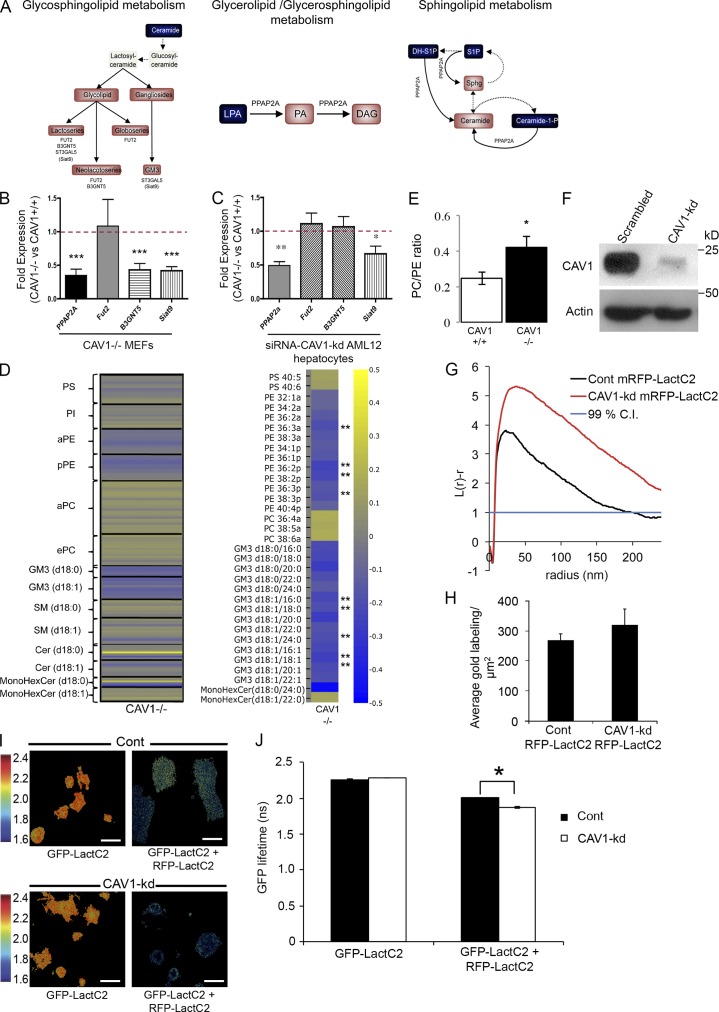
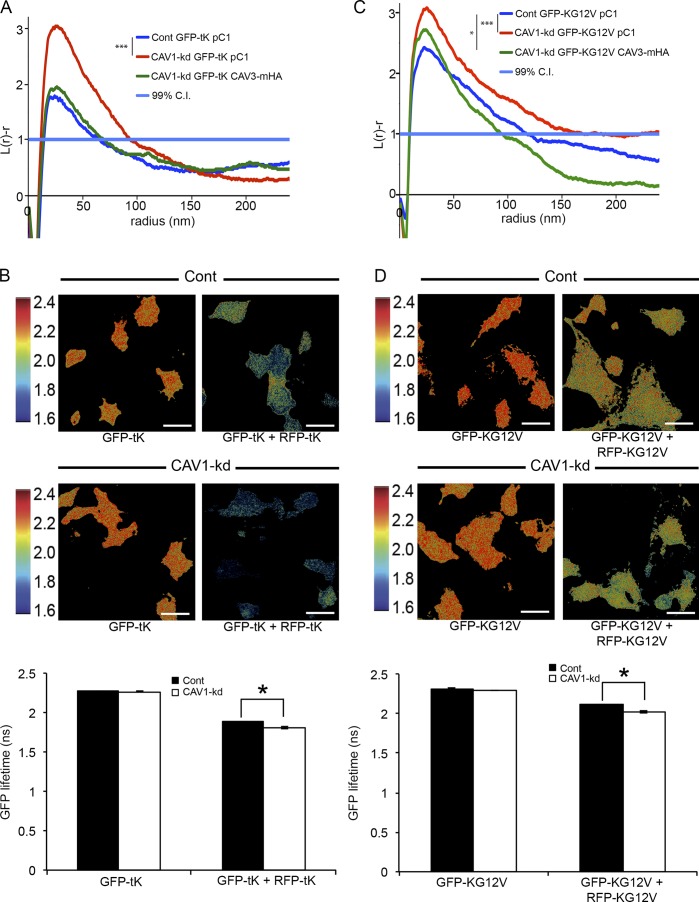
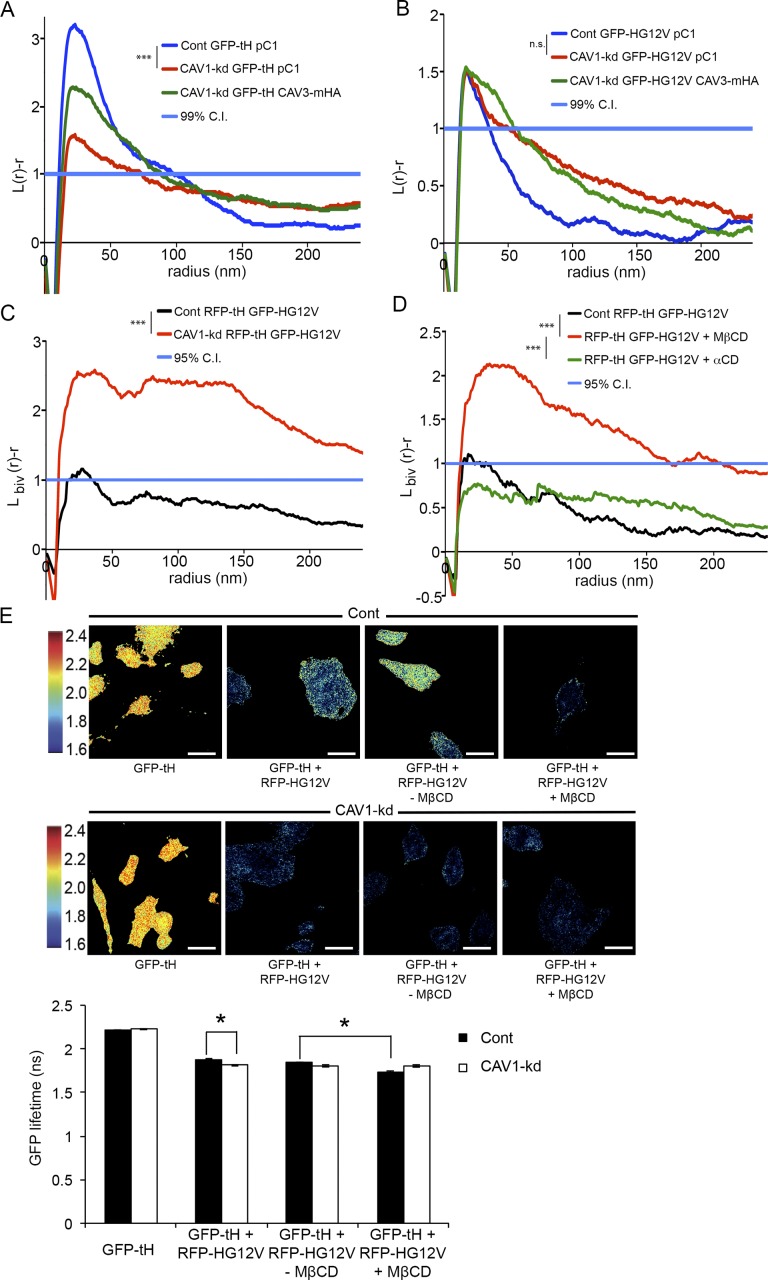
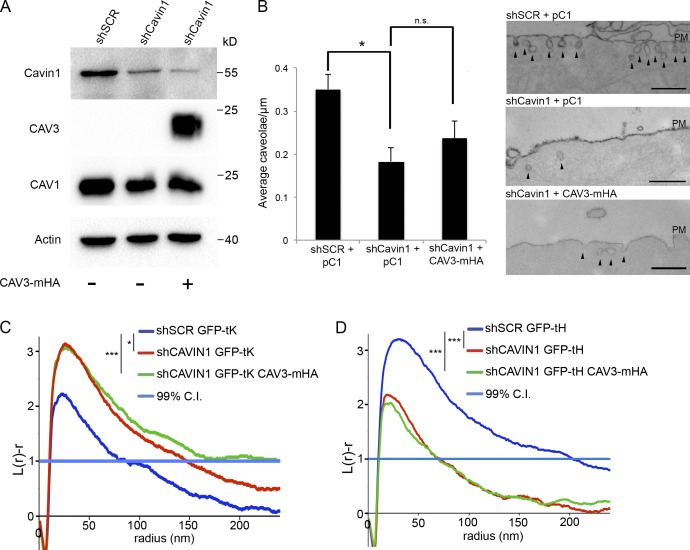
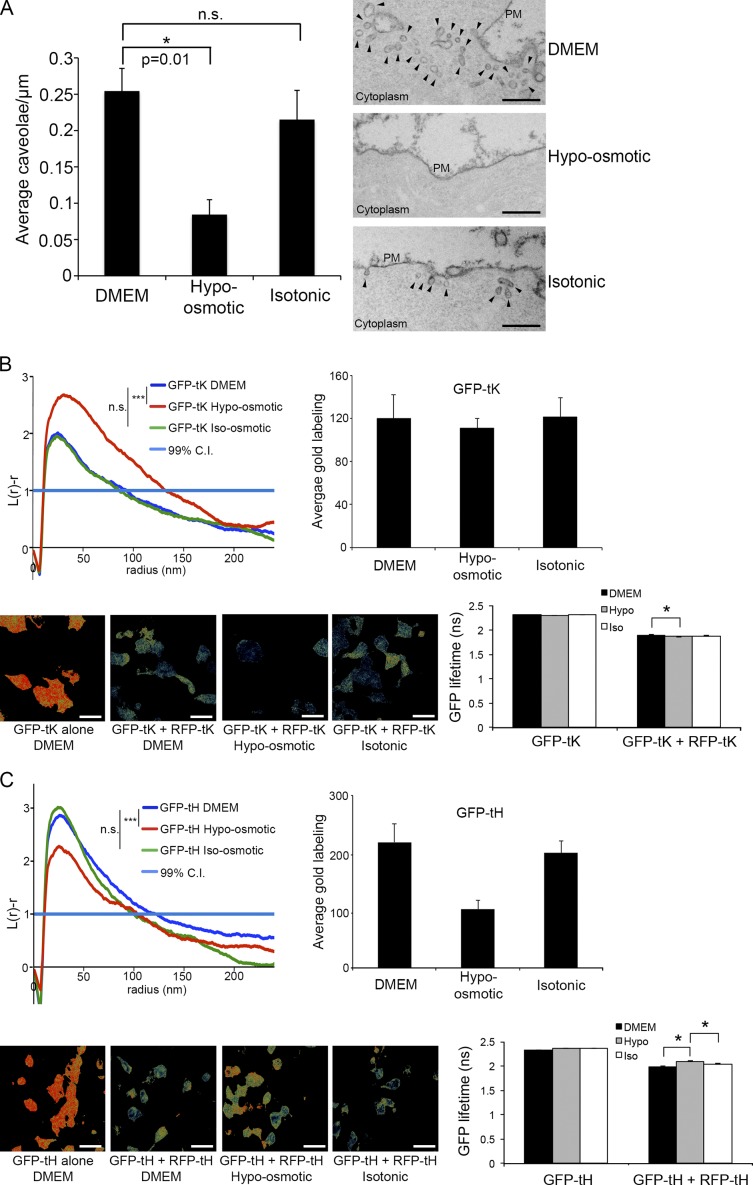
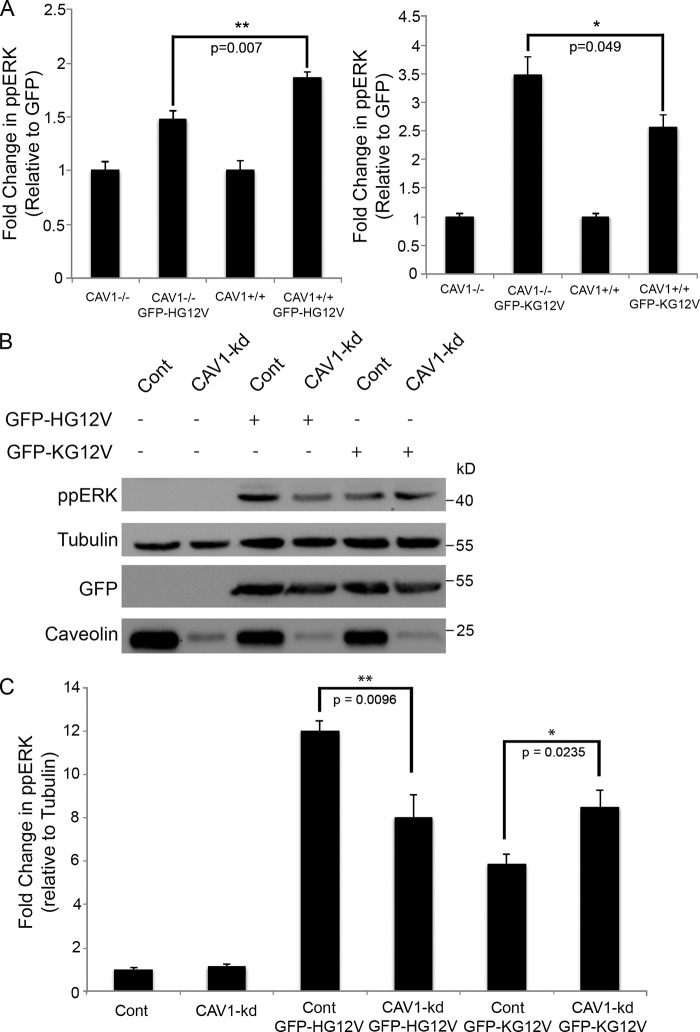
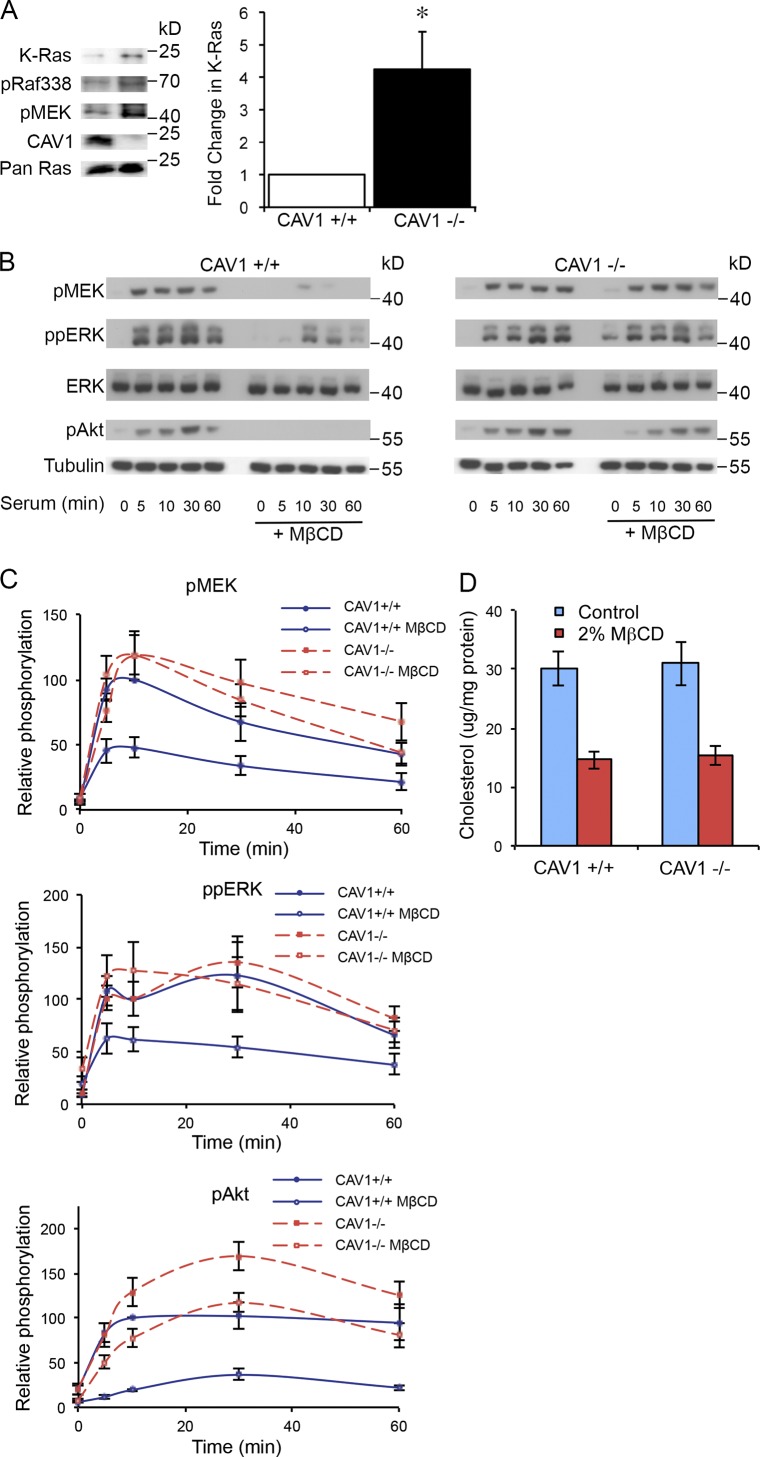
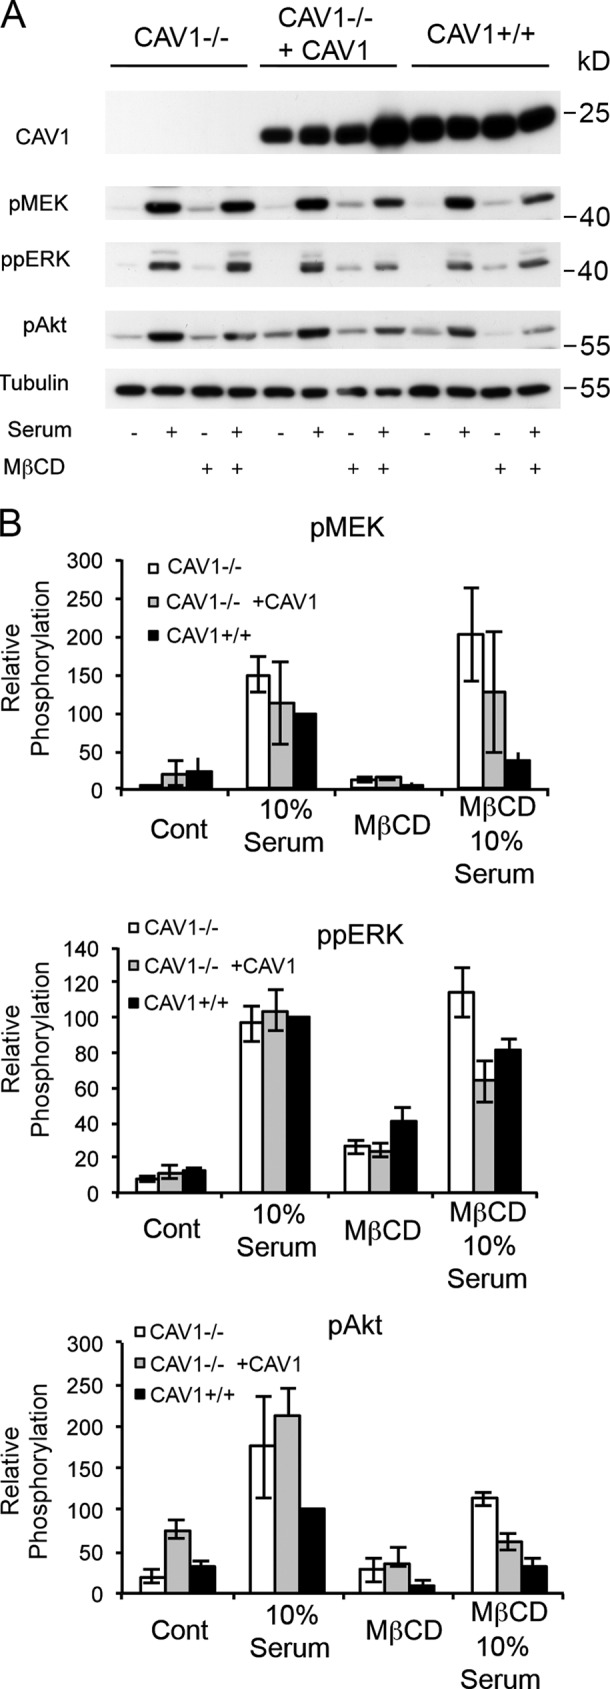
The molecular mechanisms whereby caveolae exert control over cellular signaling have to date remained elusive. We have therefore explored the role caveolae play in modulating Ras signaling. Lipidomic and gene array analyses revealed that caveolin-1 (CAV1) deficiency results in altered cellular lipid composition, and plasma membrane (PM) phosphatidylserine distribution. These changes correlated with increased K-Ras expression and extensive isoform-specific perturbation of Ras spatial organization: in CAV1-deficient cells K-RasG12V nanoclustering and MAPK activation were enhanced, whereas GTP-dependent lateral segregation of H-Ras was abolished resulting in compromised signal output from H-RasG12V nanoclusters. These changes in Ras nanoclustering were phenocopied by the down-regulation of Cavin1, another crucial caveolar structural component, and by acute loss of caveolae in response to increased osmotic pressure. Thus, we postulate that caveolae remotely regulate Ras nanoclustering and signal transduction by controlling PM organization. Similarly, caveolae transduce mechanical stress into PM lipid alterations that, in turn, modulate Ras PM organization.


Figures

Figure 1.
Figure 1.
CAV1 deficiency impairs glycosphingolipid and glycerolipid synthesis, levels, and distribution. (A) Lipid metabolism gene pathways affected by CAV1 deficiency in MEFs (adapted from Kyoto Encyclopedia of Genes and Genomes; http://www.genome.jp/kegg). (B) Reduced expression of Ppap2A, B3GNT5, and Siat9 in CAV1−/− MEFs (n = 5). (C) siRNA-CAV1 knockdown in AML12 hepatocytes decreased Siat9 and Ppap2A expression (n = 4). (D, left) Heat-plot representing global changes to lipid species (decreased lipids colored blue and increased lipids colored yellow) in CAV1−/− MEFs relative to the average value obtained from CAV1+/+ MEFs. Values are relative to internal standards and the total amount of lipids: heat plots are represented as a ratio of log (KO/WT). (Right) Expanded heat-plot representing lipid species that were significantly affected (P < 0.05) in the CAV1−/− MEFs relative to CAV1+/+ MEFs (n = 6). The double asterisk denotes lipid species with a P-value < 0.01. (E) Ratio of abundance of PC to PE between CAV1+/+ MEFs and CAV1−/− MEFs (n = 6). In B, C, and E the data represent the mean ± SEM, and for B–E statistical significance was determined by two-tailed Student’s t test analyses. *, P < 0.05; **, P < 0.01; ***, P < 0.001. (F) Western blot demonstrating CAV1 protein levels between lentiviral shRNA-scrambled control BHK cells and shRNA-CAV1 knockdown BHK cells. (G) Down-regulation of CAV1 (red line) results in increased nanoclustering of PS (mRFP-LactC2) in BHK cells (Cont represents shScrambled—black line; n = 11 for control and n = 19 for CAV1-kd). Univariate analysis of spatial point patterns was conducted and statistical significance was determined by bootstrap analysis (P = 0.001). 99% confidence interval (C.I., light blue line) represents the threshold value at which sets of spatial point patterns are clustered. (H) Quantification of amount of gold labeling per 1 µm2; equivalent levels of mRFP-LactC2 were observed on PM lawns derived from control and CAV1-kd BHK cells. (I) FLIM-FRET images of Cont and CAV1-kd BHK cells expressing either GFP-LactC2 alone or GFP-LactC2 and RFP-LactC2. (J) Quantification demonstrating an increase in the nanoclustering of PS represented by a significant reduction in GFP lifetime in CAV1-kd cells. The data are averaged (±SEM) from at least 60 whole-cell GFP lifetimes and statistical significance was determined using one-way ANOVA. Bar, 20 µm.
Figure 2.
Figure 2.
Caveolin is essential for the regulation of K-Ras nanoclustering on the PM. (A) PM sheets were prepared from cells expressing GFP-tK cotransfected with a control plasmid (empty vector, pC1) or CAV3-mHA (n = 11, n = 12, and n = 12 for control, CAV1-kd, and CAV1-kd + CAV3-mHA, respectively) and univariate spatial point pattern analysis. The nanoclustering of GFP-tK was increased in CAV1-kd cells compared with control, an effect that was rescued by expression of CAV3-mHA. (B) FLIM-FRET analysis of GFP-tK also demonstrated a significant increase in nanoclustering of tK in CAV1-kd cells compared with control. Bars, 20 µm. (C) GFP-K-RasG12V nanoclustering was similarly increased in CAV1-kd cells and was partially rescued toward control nanoclustering levels by CAV3-mHA expression (n = 9, n = 11, and n = 12 for control, CAV1-kd, and CAV1-kd + CAV3-mHA, respectively). (D) Increased nanoclustering of K-RasG12V was confirmed by FLIM-FRET analysis. Bars, 20 µm. Statistical significance was determined by bootstrap analysis for A and C (*, P < 0.05; ***, P < 0.001) and by one-way ANOVA for B and D.
Figure 3.
Figure 3.
Caveolin is essential for the correct lateral segregation of H-Ras on the PM. PM sheets were prepared from cells expressing (A) GFP-tH or (B) GFP-H-RasG12V cotransfected with pC1 or CAV3-mHA (n = 12, n = 10, and n = 11 for control, CAV1-kd, and CAV1-kd + CAV3-mHA, respectively). (A) A significant decrease in nanoclustering of GFP-tH was observed in CAV1-kd cells when compared with control cells—an effect that was rescued by the expression of CAV3-mHA. (B) Control and CAV1-kd cells expressing GFP-H-RasG12V demonstrated similar nanoclustering levels (n = 15, n = 10, and n = 12 for control, CAV1-kd, and CAV1-kd + CAV3-mHA, respectively). (C) Bivariate analysis of immunogold-labeled spatial point patterns of control and CAV1-kd cells cotransfected with RFP-tH and GFP-H-RasG12V. A significant increase in co-clustering was observed between tH and H-RasG12V in CAV1-kd cells compared with control (n = 13), indicating a disruption to the lateral segregation of H-Ras in the absence of CAV1. (D) Treatment of wild-type BHK cells with MβCD expressing RFP-tH and GFP-H-RasG12V significantly increased the colocalization between tH and H-Ras.GTP (n = 12 for untreated control, n = 14 for MβCD treatment, and n = 15 for αCD treatment). (E) FLIM-FRET analysis confirming an increase in colocalization between tH and H-RasG12V in CAV1-kd BHK cells and a specific reduction in GFP lifetime in control cells after MβCD treatment. Bars, 20 µm. Statistical significance was determined by bootstrap analyses (*, P < 0.05; ***, P < 0.001) for A–D and one-way ANOVA for E.
Figure 4.
Figure 4.
Down-regulation of Cavin1 reorganizes Ras isoforms similar to CAV1-kd. (A) Western blot analysis demonstrating significant knockdown of Cavin1 by shRNA-Cavin1 transient transfection. shCavin1 resulted in a slight decrease in CAV1 protein levels; to rescue total caveolin levels back toward control levels, CAV3-mHA was expressed. (B) Loss of Cavin1 resulted in a demonstrable reduction in caveolae at the PM by electron microscopy. (Left) Quantification of caveolae numbers per micrometer of PM from BHK cells (n = 3). (Right) Representative electron micrographs from cells stained with ruthenium red and prepared as described in Materials and methods. Black arrowheads denote caveolae. Bars, 500 nm. Statistical significance was determined by two-tailed Student’s t tests. (C) Increased nanoclustering of GFP-tK was observed in Cavin1-kd cells when comparing scrambled control to Cavin1-kd. No rescue was observed upon expression of CAV3-mHA (n = 8, n = 12, and n = 11 for control, shCavin1, and shCavin1 + CAV3-mHA, respectively). (D) Conversely, GFP-tH nanoclustering was reduced by Cavin1 down-regulation. Expression of CAV3-mHA did not return the nanoclustering of shCavin1 back to control levels (n = 12, n = 11, and n = 13 for control, shCavin1, and shCavin1 + CAV3-mHA, respectively). Statistical significance was determined by bootstrap analysis. *, P < 0.05; ***, P < 0.001.
Figure 5.
Figure 5.
Loss of caveolae by modulation of cellular osmotic pressure results in similar reorganization of Ras isoforms at the PM. (A) Wild-type BHK cells were subjected to iso-osmotic, hypo-osmotic, and isotonic conditions and assayed for density of caveolae by electron microscopy. (Left) Quantification of caveolae numbers per micrometer of PM from BHK cells (n = 3). (Right) representative electron micrographs from cells stained with ruthenium red and prepared as described in Materials and methods. Black arrowheads denote caveolae. Bars, 500 nm. (B, top left) Increased nanoclustering of GFP-tK was observed in cells treated with hypo-osmotic medium (n = 13) when compared with DMEM (n = 14). No differences were observed when cells were subjected to isotonic medium (n = 20). (Top right) Quantification of the average amount of labeling per 1 µm2 of PM lawns in cells transfected with GFP-tK. (Bottom left) FLIM-FRET images of BHK cells expressing tK and treated with different osmotic conditions. Bars, 20 µm. (Bottom right) A significant increase in the nanoclustering of tK was observed under hypo-osmotic conditions, indicated by a significant reduction in GFP lifetime (P = 0.04). (C, top left) Decreased nanoclustering of GFP-tH was observed in cells treated with hypo-osmotic medium (n = 11) when compared with DMEM (n = 14). No change to the levels of nanoclustering was observed in cells treated with isotonic medium (n = 14). (Top right) Quantification of the average amount of labeling per 1 µm2 of PM lawns in cells transfected with GFP-tH. Although a reduction in the total GFP-tH labeling at the PM was observed, these changes in nanoclustering were independent of this decrease, as selection of equivalently labeled spatial point patterns (comparing DMEM to control) demonstrated similar deviations in nanoclustering (Fig. S3, A and B). (Bottom left) FLIM-FRET images of tH-expressing BHK cells under various osmotic conditions. Bars, 20 µm. (Bottom right) A significant increase in GFP lifetime was observed in tH-expressing hypo-osmotic–treated BHK cells, indicating a reduction in nanoclustering. Statistical significance was determined by two-tailed Student’s t tests in A, bootstrap analyses in the top left panels of B and C, and one-way ANOVA in the bottom right panels of B and C. *, P < 0.05; ***, P < 0.001.
Figure 6.
Figure 6.
Differential sensitivity of H-Ras and K-Ras signaling to caveolin loss. (A) Quantification of Western blots of CAV1−/− MEFs showing enhanced ERK phosphorylation from lentivirus-mediated expression of GFP-K-RasG12V (compared with WT expressing K-RasG12V, P = 0.049) but reduced signal output from H-RasG12V (compared with WT expressing H-RasG12V, P = 0.0069; n = 4). Quantification was normalized to GFP levels and performed as described in Abankwa et al. (2008). Statistical significance was determined by two-tailed Student’s t tests. (B) Western blot analysis of BHK cells transfected with activated Ras isoforms, GFP-H-RasG12V and GFP-K-RasG12V, showing differential and opposing activation of the MAP kinase pathway in response to the expression of each construct (n = 4). (C) Quantification indicates that a loss of CAV1 results in a significant reduction in MAP kinase signaling through H-Ras and a concurrent increase in K-Ras–mediated MAP kinase signaling (independently compared with scrambled controls). Statistical significance was determined by two-tailed Student’s t test analyses.
Figure 7.
Figure 7.
Cholesterol depletion in MEFs causes loss of MAP kinase activation in WT but not CAV1−/− cells. (A) Western blot analysis of K-Ras in MEFs demonstrates an approximately fourfold increase in protein level that translates into downstream up-regulation of MAPK signaling in CAV1−/− cells. Statistical significance was determined by two-tailed Student’s t test analysis. *, P < 0.05 (n = 3). (B) MEFs were serum starved overnight, treated with 2% MβCD for 30 min, and stimulated with 10% FCS for various times. CAV1+/+ and CAV1−/− MEFs respond to serum stimulation in a similar manner. Cholesterol depletion before serum stimulation inhibited phosphorylation of pMEK, ppERK, and pAkt in CAV1+/+ MEFs but not in CAV1−/− MEFs (n = 3). (C) Activation profiles of CAV1+/+ and CAV1−/− MEFs after serum stimulation with or without cholesterol depletion. (D) Cholesterol levels are equivalent between untreated and cholesterol-depleted CAV1+/+ and CAV1−/− cells (n = 3).
Figure 8.
Figure 8.
Re-expression of CAV1 rescues sensitivity to cholesterol depletion in CAV1−/− MEFs. (A) Adenoviral expression of CAV1 in CAV1−/− MEFs rescues the sensitivity of the MAPK pathway signaling to cholesterol depletion. (B) Quantification of ppERK, pMEK, and pAkt levels in CAV1+/+, CAV1−/−, and CAV1−/− expressing CAV1 MEFs (n = 3).

References

    1. Abankwa D., Gorfe A.A., Hancock J.F. 2007. Ras nanoclusters: molecular structure and assembly. Semin. Cell Dev. Biol. 18:599–607 10.1016/j.semcdb.2007.08.003 - DOI - PMC - PubMed
    1. Abankwa D., Gorfe A.A., Hancock J.F. 2008. Mechanisms of Ras membrane organization and signalling: Ras on a rocker. Cell Cycle. 7:2667–2673 10.4161/cc.7.17.6596 - DOI - PMC - PubMed
    1. Belanis L., Plowman S.J., Rotblat B., Hancock J.F., Kloog Y. 2008. Galectin-1 is a novel structural component and a major regulator of h-ras nanoclusters. Mol. Biol. Cell. 19:1404–1414 10.1091/mbc.E07-10-1053 - DOI - PMC - PubMed
    1. Berchtold D., Piccolis M., Chiaruttini N., Riezman I., Riezman H., Roux A., Walther T.C., Loewith R. 2012. Plasma membrane stress induces relocalization of Slm proteins and activation of TORC2 to promote sphingolipid synthesis. Nat. Cell Biol. 14:542–547 10.1038/ncb2480 - DOI - PubMed
    1. Bligh E.G., Dyer W.J. 1959. A rapid method of total lipid extraction and purification. Can. J. Biochem. Physiol. 37:911–917 10.1139/o59-099 - DOI - PubMed

Publication types