. 2014 Mar 3;204(5):669-82.
doi: 10.1083/jcb.201308029. Epub 2014 Feb 24.

Nuclear lamin stiffness is a barrier to 3D migration, but softness can limit survival

Affiliations

Nuclear lamin stiffness is a barrier to 3D migration, but softness can limit survival

Takamasa Harada et al. J Cell Biol. .

Abstract

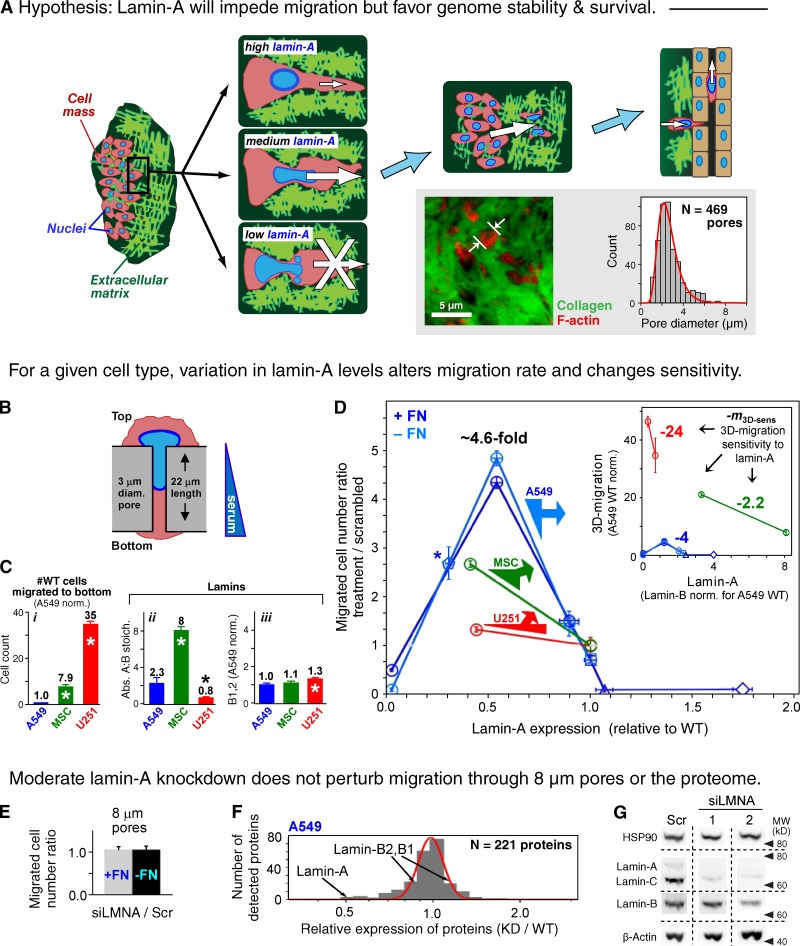
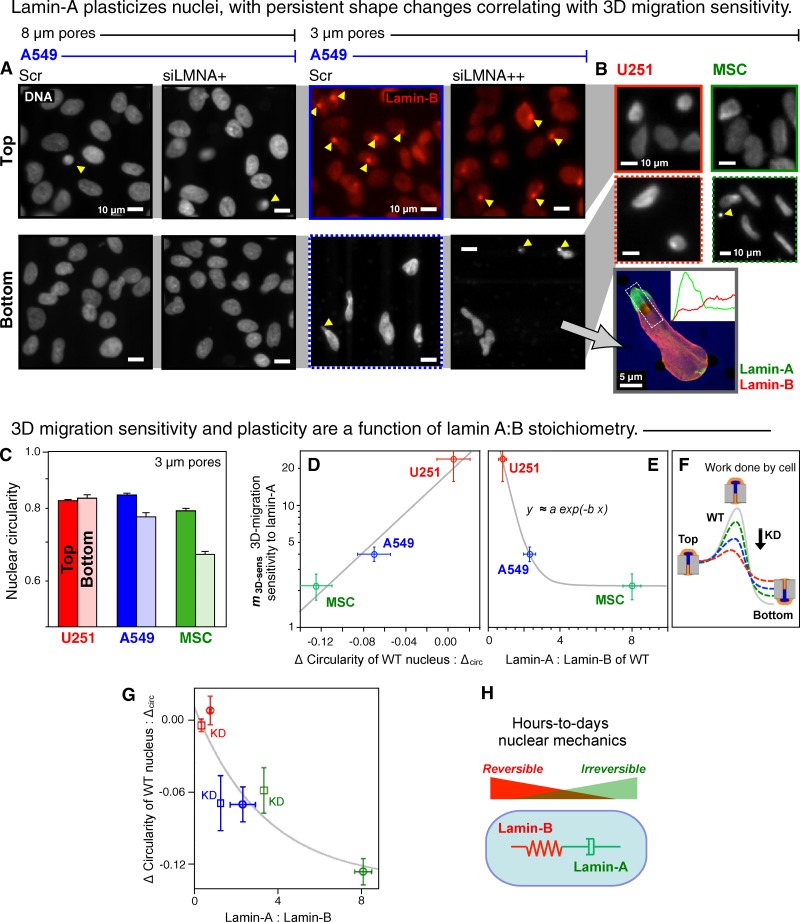
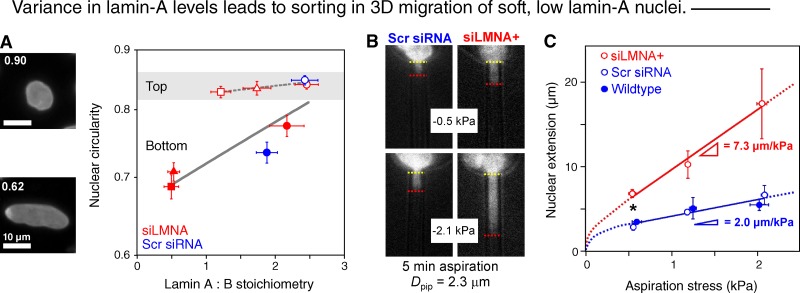
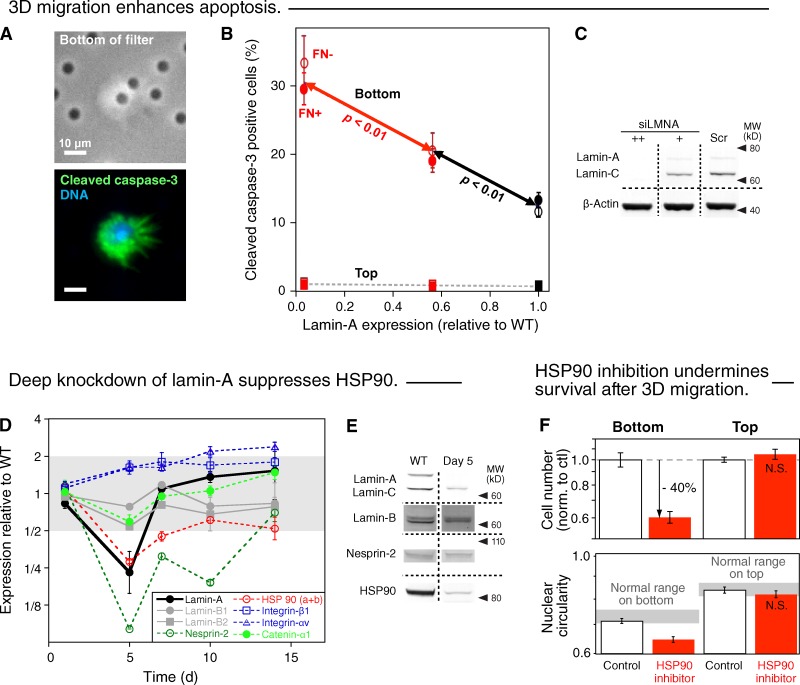
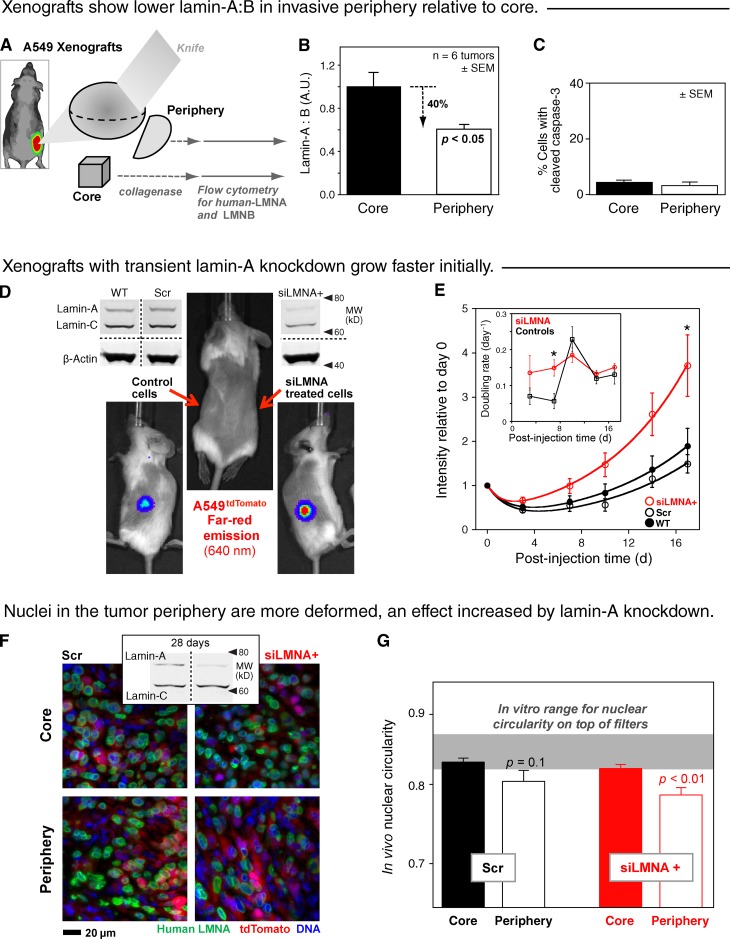
Cell migration through solid tissue often involves large contortions of the nucleus, but biological significance is largely unclear. The nucleoskeletal protein lamin-A varies both within and between cell types and was shown here to contribute to cell sorting and survival in migration through constraining micropores. Lamin-A proved rate-limiting in 3D migration of diverse human cells that ranged from glioma and adenocarcinoma lines to primary mesenchymal stem cells (MSCs). Stoichiometry of A- to B-type lamins established an activation barrier, with high lamin-A:B producing extruded nuclear shapes after migration. Because the juxtaposed A and B polymer assemblies respectively conferred viscous and elastic stiffness to the nucleus, subpopulations with different A:B levels sorted in 3D migration. However, net migration was also biphasic in lamin-A, as wild-type lamin-A levels protected against stress-induced death, whereas deep knockdown caused broad defects in stress resistance. In vivo xenografts proved consistent with A:B-based cell sorting, and intermediate A:B-enhanced tumor growth. Lamins thus impede 3D migration but also promote survival against migration-induced stresses.


Figures

Figure 1.
Figure 1.
3D migration is sensitive to lamin-A levels even in the absence of major proteomic changes. (A) Hypothesis for the impact of lamin-A levels on migration. Whereas moderate expression permits migration, cells with low levels cannot withstand the stress and high levels impede migration. Inset shows confocal image of a model lung tumor in an NSG mouse and a histogram of the measured pores filled with cytoplasm. (B) Schematic of a cell passing through a filter pore. (C) Wild-type 3D migration (i) and lamina parameters (ii and iii) for human-derived cancer cells (A549, U251) and adult stem cells (MSCs). (n ≥ 3; ±SEM; *, P ≤ 0.05). (D) Lamin-A dependence of net cell migration to the filter bottom (n ≥ 3; ±SEM). Normalization is done to scrambled siRNA-treated cells, with lamin-A level determined by immunoblot. Filters were pre-coated with fibronectin (+FN) unless indicated (−FN). Circles, siLMNA-treated cells; asterisk, shLMNA-treated cells, normalized against wild type; squares, wild type; triangle and diamond, A549 cells transduced with GFP-lamin-A with low and high levels, respectively. Based on analyses of individual cells, siLMNA++ gave a monomodal, low variance population of cells and did not affect lamin-B (Fig. S2). Inset plot: net migration results rescaled to absolute lamin-A levels with migration normalized to wild-type A549 cells (Fig. 1 Ci). Slopes represent the 3D migration sensitivity to moderate lamin-A changes. (E) Net migration ratio with 8-µm pore filters shows no effects of knockdown regardless of fibronectin. (n ≥ 3; ±SEM). (F) Negligible effect on the A549 proteome after ∼50% knockdown of lamin-A, C is evident in a narrow, log-normal distribution relative to wild type. (G) Immunoblot shows little to no change in lamin-B, HSP90, and β-actin after knockdown with two different siLMNAs (1 and 2) compared with scrambled (Scr).
Figure 2.
Figure 2.
Lamin-A plasticizes nuclei, with persistent shape changes correlating with both 3D migration sensitivity to lamin-A and also with the lamin-A:B ratio. (A) A549 nuclei on the filters stained for either lamin-B or DNA. Arrowheads indicate a nucleus in a pore. Knockdown with siLMNA was >95% (3 µm) or 60% (8 µm). Inset: confocal image of siLMNA cell on the bottom of 3-µm pore filter showing segregation of lamins, with intensity profiles quantified from z-stacks. (B) U251 and MSC cells imaged on the top and bottom of 3-µm pore filters. (C) Circularity of wild-type nuclei on the top versus bottom of 3-µm filters (log scale). (D) Exponential correlation between 3D migration sensitivity to lamin-A levels (values in Fig. 1 C) and the difference in circularity (n > 3 repeats; ±SEM). The three datapoints were fitted to an exponential, y = α exp(−β x1) with two parameters: α = 19, β = 19 (R2 > 0.95). (E) For 3D migration sensitivity to lamin-A:B ratio, we fit a similar exponential y = a exp(−b x2) + c with similar fit parameters: a (∼α) = 80, b = 2, c << a (R2 > 0.94). (F) Scheme illustrates migration through a pore as an activated process in which an equi-mass knockdown of lamin-A suppresses the barrier and facilitates migration as U251 > A549 > MSC. (G) Migration-induced nuclear circularity change is also nonlinear in lamin-A:B for both wild-type and knockdown cells (KD, squares), with a fit based on the previous fits. (H) Schematic illustrates distinct physical roles of lamin-A in nuclear viscosity (dash pot) and lamin-B in nuclear elasticity (spring).
Figure 3.
Figure 3.
Variations in lamin-A lead to cell sorting in 3D migration, consistent with lamin-A:B regulation of nuclear response time. (A) Nuclei on the bottom of 3-µm filters compared with the top in A549 cells show lower absolute ratio of lamin-A:B and lower nuclear circularity (n ≥ 50 cells in 3 experiments; ±SEM), consistent with segregation in 3D migration based on softness of the nucleus. Immunofluorescence intensities of lamin-A (shown) and lamin-B were rescaled to the absolute ratio of 2.3 (Fig. 1 Cii). Red circle, triangle, and square symbols correspond to high, medium, and low doses of siLMNA, respectively. Results are fit segmentally to exponentials: y = 0.81 exp(0.015 x) (top, R2 = 0.86) and y = 0.66 exp(0.083 x) (bottom, R2 = 0.78). (B) Nucleus of A549 pulled into a micropipette of similar diameter as the filters after disrupting the actin cytoskeleton. Fluorescent DNA images are at low and high aspiration pressures. (C) Plot shows nuclear extension at each pressure after 5 min (n = 4; ±SEM; *, P < 0.01). Controls are both scrambled siRNA-treated and nontreated cells fitted to single line.
Figure 4.
Figure 4.
3D migration enhances apoptosis, and ablation of lamin-A compromises HSP90-dependent stress protection. (A) Images of A549 cell partially in a 3-µm pore (top) and staining positive for the apoptosis marker cleaved caspase-3 (green, bottom; blue, DNA Hoechst 33342). (B) Increased frequency of apoptotic A549 cells on the bottom of 3-µm filter after lamin-A knockdown. Cells on top show a negligible dependence of apoptosis on lamin-A. (n = 3; ±SEM). (C) Measurements were made by immunoblotting. (D) Changes in the expression levels of proteins of interest, detected by quantitative mass spectrometry, after transient lamin-A knockdown and recovery over 14 d (n = 3; ±SEM). Although up-regulation of the fibronectin receptor integrin α5:β1 in epithelial cells can favor mesenchymal-like motility (Friedl et al., 1997), correlations of levels with extents of cell behaviors remain controversial (Desgrosellier and Cheresh, 2010) and, more importantly, FN coating of filters had no effect in our studies (Fig. 1, D and E). Likewise, while decreases in α-catenin (by > 25%) also associate with an epithelial-mesenchymal transition (EMT; Yang et al., 2004), deep lamin-A knockdown suppresses net 3D migration (Fig. 1 D). (E) Changes in lamin-A, lamin-B, nesprin-2, and HSP90 were confirmed by immunoblot for wild-type and 5-d post-knockdown cells. (F) A549 cells pretreated for 24 h with HSP90 inhibitor (17-AAG, 90 nM in DMSO) or the same volume of DMSO (control) were plated in the same solutions on the top of 3-µm filters and allowed to migrate for 24 h. Cells were fixed, immunostained for lamin-A, imaged, and measured (n = 3; ±SEM); drug gave fewer cells on bottom and nuclei were less circular (P < 0.01; log scales).
Figure 5.
Figure 5.
Cells in the tumor periphery show low lamin-A:B in more deformed nuclei, consistent with enhanced tumor growth after moderate knockdown of lamin-A. (A) Immunostaining of lamins in A549 cells isolated from core and periphery tumor sections (of relative width: ∼1/4, ∼1/2, ∼1/4) from wild-type xenografts followed by flow cytometry. (B) A549 cells were distinguished from mouse cells based on positive staining with human specific lamin-A primary antibody. lamin-A:B intensity ratio showed a statistically significant difference between core and periphery (n = 6 mice; ±SEM). (C) Frequencies of cleaved caspase-3–positive tumor-derived A549 cells were obtained by imaging cells positively stained for human lamin-A (n = 3; ±SEM). (D) In situ imaging of A549 xenografts that were stably expressing tdTomato. Each mouse received siLMNA-treated cells in one side and control cells on the opposite side: wild-type (WT) or scrambled-RNA (Scr). Knockdown was confirmed by immunoblot. (E) Tumor propagation measured by tdTomato signal from tumors up to 17 d post-engraftment, with double exponential fits (n = 10 for siLMNA+, n = 5 for NT and Scr; ±SEM). Inset: growth rates as reciprocal doubling times calculated from consecutive time points (n = 10; ±SEM; P < 0.05). (F) Representative fluorescence images of cells in core and periphery regions of tumor tissue sections, stained for DNA (Hoechst 33342) and anti–(human lamin-A) with red fluorescence from tdTomato. Inset: immunoblots of tumors with anti–(human lamin-A) and constant total protein show lamin-A:C has recovered after moderate knockdown. (G) Circularity of A549 nuclei in control or lamin-A knockdown tumor slices (n ≥ 25 cells; ±SEM; log scale). Cell populations were again divided into core or periphery (n = 4 tumors).

References

    1. Barnes H.A. 2000. Handbook of Elementary Rheology. University of Wales, Institute of Non-Newtonian Fluid Mechanics, Cardiff, UK: 204 pp
    1. Beadle C., Assanah M.C., Monzo P., Vallee R., Rosenfeld S.S., Canoll P. 2008. The role of myosin II in glioma invasion of the brain. Mol. Biol. Cell. 19:3357–3368 10.1091/mbc.E08-03-0319 - DOI - PMC - PubMed
    1. Belt E.J., Fijneman R.J., van den Berg E.G., Bril H., Delis-van Diemen P.M., Tijssen M., van Essen H.F., de Lange-de Klerk E.S., Beliën J.A., Stockmann H.B., et al. 2011. Loss of lamin A/C expression in stage II and III colon cancer is associated with disease recurrence. Eur. J. Cancer. 47:1837–1845 10.1016/j.ejca.2011.04.025 - DOI - PubMed
    1. Chamberlain J.K., Lichtman M.A. 1978. Marrow cell egress: specificity of site if penetration into sinus. Blood. 52:959–968 - PubMed
    1. Cheng G., Tse J., Jain R.K., Munn L.L. 2009. Micro-environmental mechanical stress controls tumor spheroid size and morphology by suppressing proliferation and inducing apoptosis in cancer cells. PLoS ONE. 4:e4632 10.1371/journal.pone.0004632 - DOI - PMC - PubMed

Publication types