. 2014 May;34(9):1659-69.
doi: 10.1128/MCB.00969-13. Epub 2014 Feb 24.

The myc 3' wnt-responsive element suppresses colonic tumorigenesis

Affiliations

The myc 3' wnt-responsive element suppresses colonic tumorigenesis

Wesley M Konsavage Jr et al. Mol Cell Biol. 2014 May.

Abstract

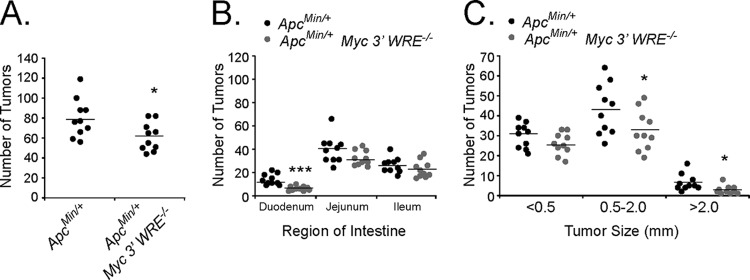
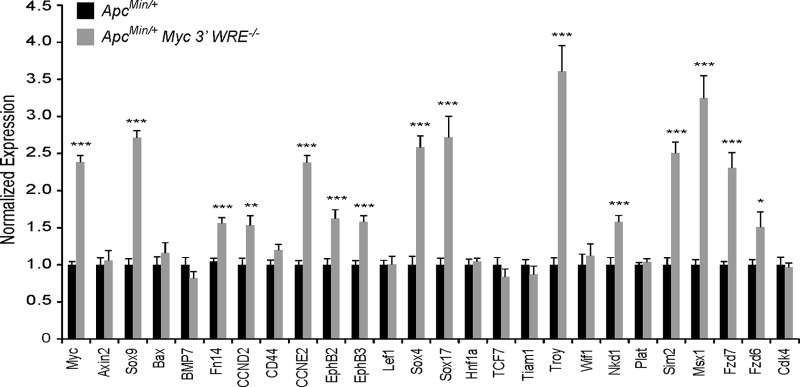
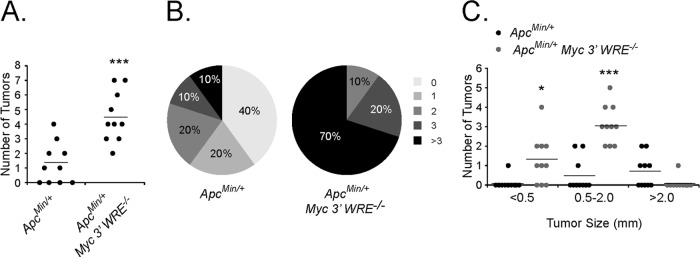
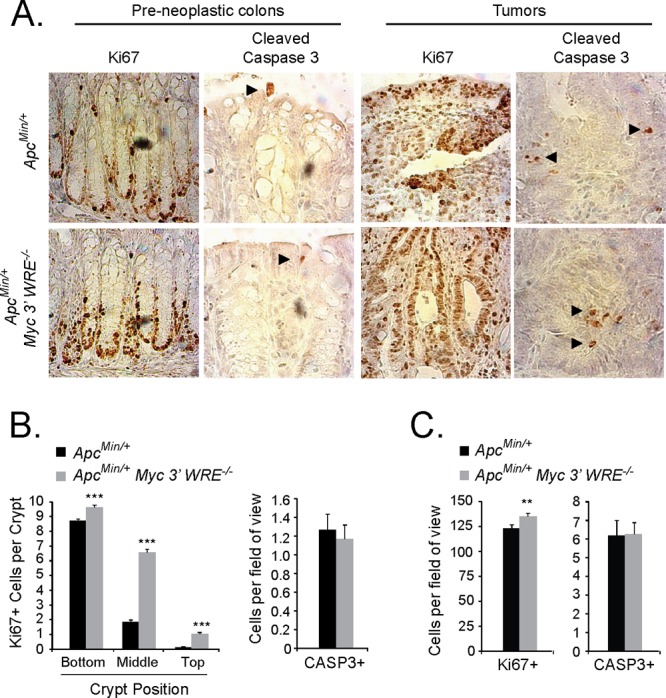
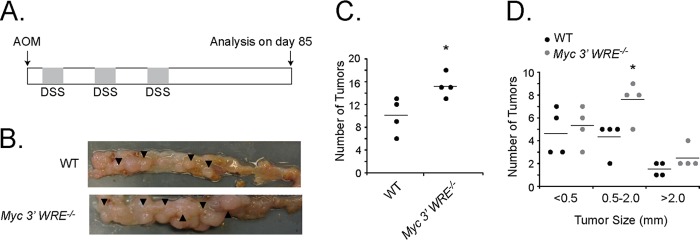
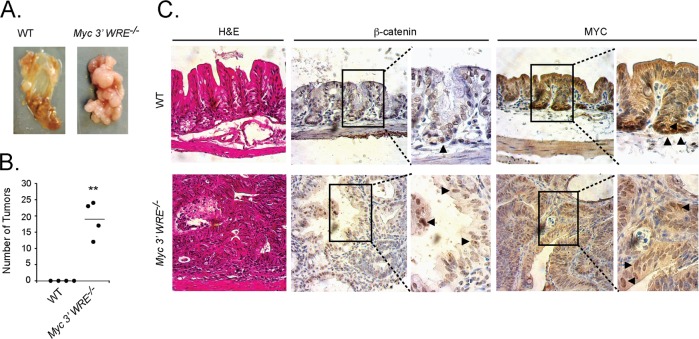
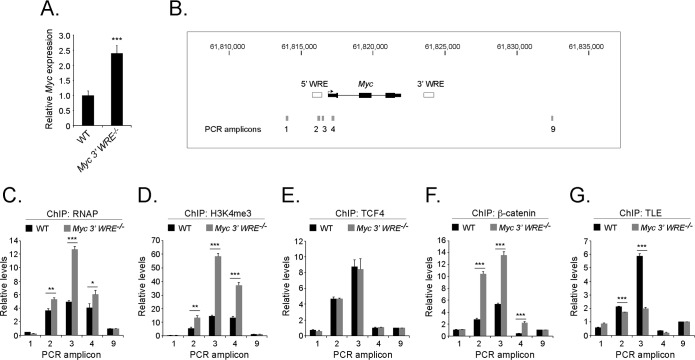
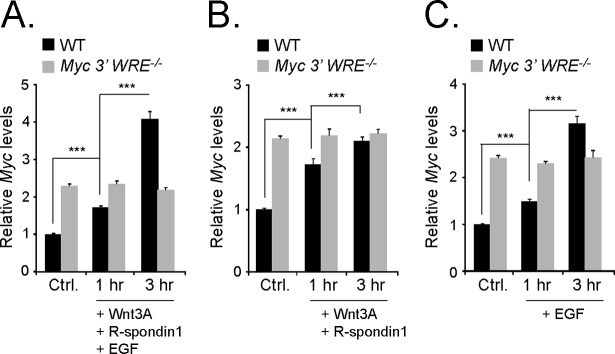
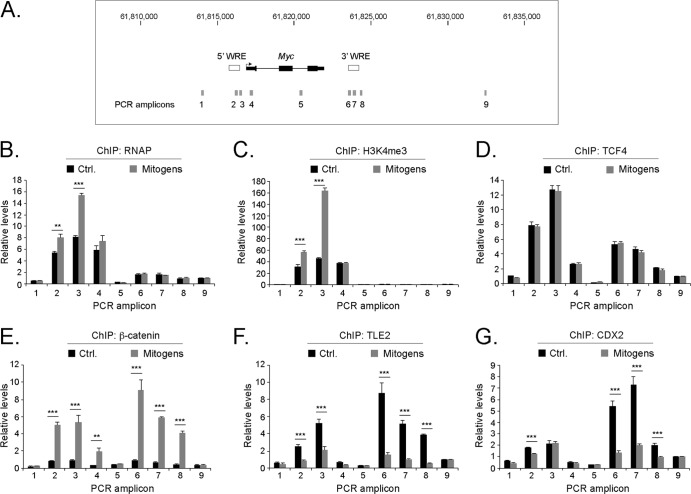
Mutations in components of the Wnt/β-catenin signaling pathway are commonly found in colorectal cancers, and these mutations cause aberrant expression of genes controlled by Wnt-responsive DNA elements (WREs). While the c-Myc proto-oncogene (Myc) is required for intestinal phenotypes associated with pathogenic Wnt/β-catenin signaling in vivo, the WREs that control Myc expression in this setting have yet to be fully described. Previously, we demonstrated that the Myc 3' WRE was required for intestinal homeostasis and intestinal repair in response to damage. Here, we tested the role of the Myc 3' WRE in intestinal tumorigenesis using two independent mouse models. In comparison to Apc(Min/+) mice, Apc(Min/+) Myc 3' WRE(-/-) mice contained 25% fewer tumors in the small intestine. Deletion of the Myc 3' WRE(-/-) in the Apc(Min/+) background resulted in 4-fold more colonic tumors. In a model of colitis-associated colorectal cancer, the Myc 3' WRE suppressed colonic tumorigenesis, most notably within the cecum. Using chromatin immunoprecipitation and transcript analysis of purified colonic crypts, we found that the Myc 3' WRE is required for the transcriptional regulation of Myc expression in vivo. These results emphasize the critical role of the Myc 3' WRE in maintaining homeostatic Myc expression.


Figures

FIG 1
FIG 1
Deletion of the Myc 3′ WRE reduces the number of small intestinal tumors in ApcMin/+ mice. (A) Number of tumors in the small intestines of 14-week-old ApcMin/+ and ApcMin/+ Myc 3′ WRE−/− mice. (B) Number of tumors in the indicated region of the small intestines. (C) Size of tumors quantified within the small intestines of mice with the indicated genotypes. In panels A to C, tumors were quantified in 10 ApcMin/+ and 10 ApcMin/+ Myc 3′ WRE−/− mice. Errors are standard errors of the means (*, P < 0.05; ***, P < 0.001).
FIG 2
FIG 2
Expression of Wnt/β-catenin target genes in the colons of preneoplastic ApcMin/+ and ApcMin/+ Myc 3′ WRE−/− mice. RNAs were isolated from purified colonic crypts, and cDNAs were synthesized with reverse transcriptase. Expression levels of the indicated genes were assessed by using gene-specific oligonucleotides in quantitative and real-time PCRs (n = 3 mice per genotype and 12 PCR replicates per gene). The data are normalized to β-actin gene levels. The data are presented as relative expression levels in ApcMin/+ Myc 3′ WRE−/− crypts, with levels in ApcMin/+ crypts set to 1. Errors are standard errors of the means (*, P < 0.05; **, P < 0.01; ***, P < 0.001).
FIG 3
FIG 3
Deletion of the Myc 3′ WRE increases the number of colonic tumors in ApcMin/+ mice. (A) Number of tumors in the colons of 14-week-old ApcMin/+ and ApcMin/+ Myc 3′ WRE−/− mice (n = 10 mice analyzed per genotype). (B) Percentage of mice in each group that contained the indicated number of tumors. (C) Size of tumors quantified within the colons of mice with the indicated genotypes (n = 10 mice analyzed per genotype). In panels A and C, errors are standard errors of the means (*, P < 0.05; ***, P < 0.001).
FIG 4
FIG 4
The Myc 3′ WRE controls proliferation but not apoptosis in the colons of ApcMin/+ mice. (A) Ki67- and cleaved caspase 3 (CASP3)-stained sections of preneoplastic colons and colonic tumors from ApcMin/+ (top) and ApcMin/+ Myc 3′ WRE−/− (bottom) mice. Representative images are shown (n = 4 mice analyzed per genotype). Arrowheads indicate CASP3+ cells. (B) Quantification of Ki67+ (left) and CASP3+ (right) cells in preneoplastic colons of ApcMin/+ and ApcMin/+ Myc 3′ WRE−/− mice (n = 4 mice analyzed, with cells counted in a total of 100 crypts per genotype). (C) Same as panel B except that Ki67+ and CASP3+ cells were analyzed in tumor sections prepared from mice with the indicated genotypes (n = 4 mice, with 40 fields of view examined per genotype). In panels B and C, errors are standard errors of the means (**, P < 0.01; ***, P < 0.001).
FIG 5
FIG 5
The Myc 3′ WRE suppresses colitis-associated carcinogenesis (CAC). (A) Schematic of the CAC protocol. Myc 3′ WRE−/− mice and WT littermates were given a single intraperitoneal injection of azoxymethane (AOM) and then subjected to 3 cycles of DSS-induced colitis. After 85 days, mice were sacrificed, and tumors within the distal colon were tallied. (B) Representative images of colons isolated from WT and Myc 3′ WRE−/− mice subjected to the AOM/DSS protocol. (C) Numbers of tumors in the colons of WT and Myc 3′ WRE−/− mice subjected to the AOM/DSS protocol. (D) Size of tumors quantified within the colons of mice with the indicated genotypes. In panels C and D, 4 mice were examined per genotype, and errors are standard errors of the means (*, P < 0.05).
FIG 6
FIG 6
Myc 3′ WRE−/− mice subjected to the AOM/DSS carcinogenesis protocol develop numerous tumors in the cecum. (A) Representative images of ceca isolated from WT and Myc 3′ WRE−/− mice following AOM and DSS treatment. (B) Quantification of cecal tumors in mice with the indicated genotypes (n = 4 mice examined per group). Errors are standard errors of the means (**, P < 0.01). (C) Hematoxylin and eosin (H&E)-stained sections and immunohistochemical analysis of β-catenin- and MYC-expressing cells in the ceca of mice with the indicated genotypes. The arrowheads in the enlarged panels identify a subset of positive cells. Shown are representative images from 4 mice examined per genotype.
FIG 7
FIG 7
The Myc 3′ WRE is required for proper regulation of Myc gene expression in purified colonic crypts. (A) Relative levels of Myc mRNA, as assessed by quantitative reverse transcription-PCR, in purified colonic crypts from WT and Myc 3′ WRE−/− mice. (B) Schematic of the Myc gene locus, with its position on chromosome 15 indicated above and the Myc 5′ and 3′ WREs represented as white rectangles. Gray rectangles indicate the positions of the amplicons produced in the PCRs. (C to G) Colonic crypts were isolated from 7-week-old Myc 3′ WRE−/− mice and WT littermates and fixed in formaldehyde. ChIP assays were conducted by using the antibodies indicated, and the precipitated DNA was measured by using specific oligonucleotides to produce the indicated amplicons in quantitative and real-time PCR assays. Control primer sets 1 and 9 were used to monitor the level of background in the ChIP assays. In panels A and C to G, 3 mice per genotype were examined, with 12 total PCR replicates per sample. Errors are standard errors of the means (*, P < 0.05; **, P < 0.01; ***, P < 0.001).
FIG 8
FIG 8
The Myc 3′ WRE is required for mitogen-induced Myc gene expression. The proliferative regions of colonic crypts were isolated from 7-week-old Myc 3′ WRE−/− mice and WT littermates and were not treated (Ctrl.) or treated for 1 or 3 h with recombinant Wnt3A, R-spondin1, and EGF (A), Wnt3A and R-spondin1 (B), or EGF (C). RNAs were isolated, cDNAs were synthesized, and Myc expression levels were evaluated by using quantitative real-time PCR. Myc mRNA levels were normalized to β-actin gene levels (n = 3 mice analyzed per genotype, with 12 total PCR replicates per sample). Errors are standard errors of the means (***, P < 0.001).
FIG 9
FIG 9
Mitogens induce an exchange of transcriptional regulatory complexes at Myc 5′ and 3′ Wnt-responsive elements. (A) Diagram of the Myc locus, with the Myc 5′ and 3′ WREs indicated by white rectangles. Gray rectangles indicate the positions of the amplicons produced in quantitative real-time PCRs in panels B to G. (B) The proliferative region of colonic crypts were isolated from 7-week-old WT mice and were untreated (Ctrl.) or treated with recombinant Wnt3A, EGF, and R-spondin1 (mitogens) for 3 h. ChIP assays were performed by using antibodies directed against RNA polymerase 2 (RNAP), and the precipitated DNA was measured by using quantitative real-time PCR with oligonucleotides that hybridized to the regions indicated. Colonic crypts were isolated from 3 mice, and 12 PCR replicates were prepared for each sample. Errors are standard errors of the means (**, P < 0.01; ***, P < 0.001). (C to G) Same as panel B except that ChIP assays were conducted with antibodies directed against H3K4me3 (C), TCF4 (D), β-catenin (E), TLE2 (F), or CDX2 (G).

Similar articles

Cited by

References

    1. Archbold HC, Yang YX, Chen L, Cadigan KM. 2012. How do they do Wnt they do? Regulation of transcription by the Wnt/beta-catenin pathway. Acta Physiol. (Oxf.) 204:74–109. 10.1111/j.1748-1716.2011.02293.x - DOI - PubMed
    1. Yeung TM, Chia LA, Kosinski CM, Kuo CJ. 2011. Regulation of self-renewal and differentiation by the intestinal stem cell niche. Cell. Mol. Life Sci. 68:2513–2523. 10.1007/s00018-011-0687-5 - DOI - PMC - PubMed
    1. Clevers H, Nusse R. 2012. Wnt/beta-catenin signaling and disease. Cell 149:1192–1205. 10.1016/j.cell.2012.05.012 - DOI - PubMed
    1. MacDonald BT, Tamai K, He X. 2009. Wnt/beta-catenin signaling: components, mechanisms, and diseases. Dev. Cell 17:9–26. 10.1016/j.devcel.2009.06.016 - DOI - PMC - PubMed
    1. Mosimann C, Hausmann G, Basler K. 2009. Beta-catenin hits chromatin: regulation of Wnt target gene activation. Nat. Rev. Mol. Cell Biol. 10:276–286. 10.1038/nrm2654 - DOI - PubMed

Publication types

MeSH terms

LinkOut - more resources