

The ecology in the hematopoietic stem cell niche determines the clinical outcome in chronic myeloid leukemia
- PMID: 24567385
- PMCID: PMC3956166
- DOI: 10.1073/pnas.1317072111
The ecology in the hematopoietic stem cell niche determines the clinical outcome in chronic myeloid leukemia
Abstract
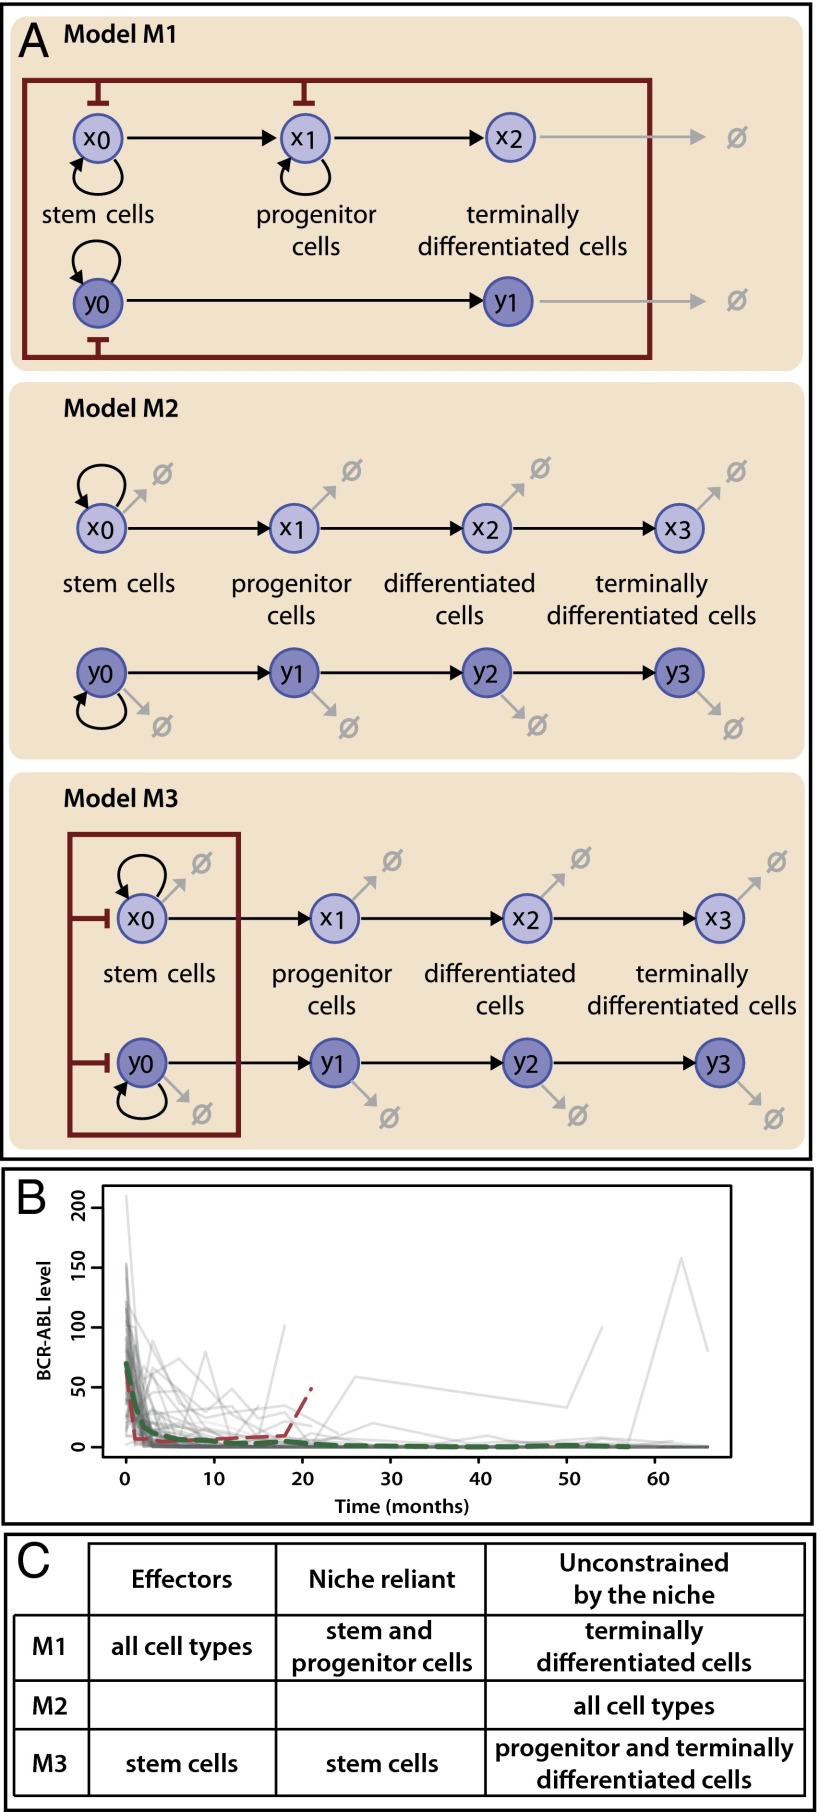
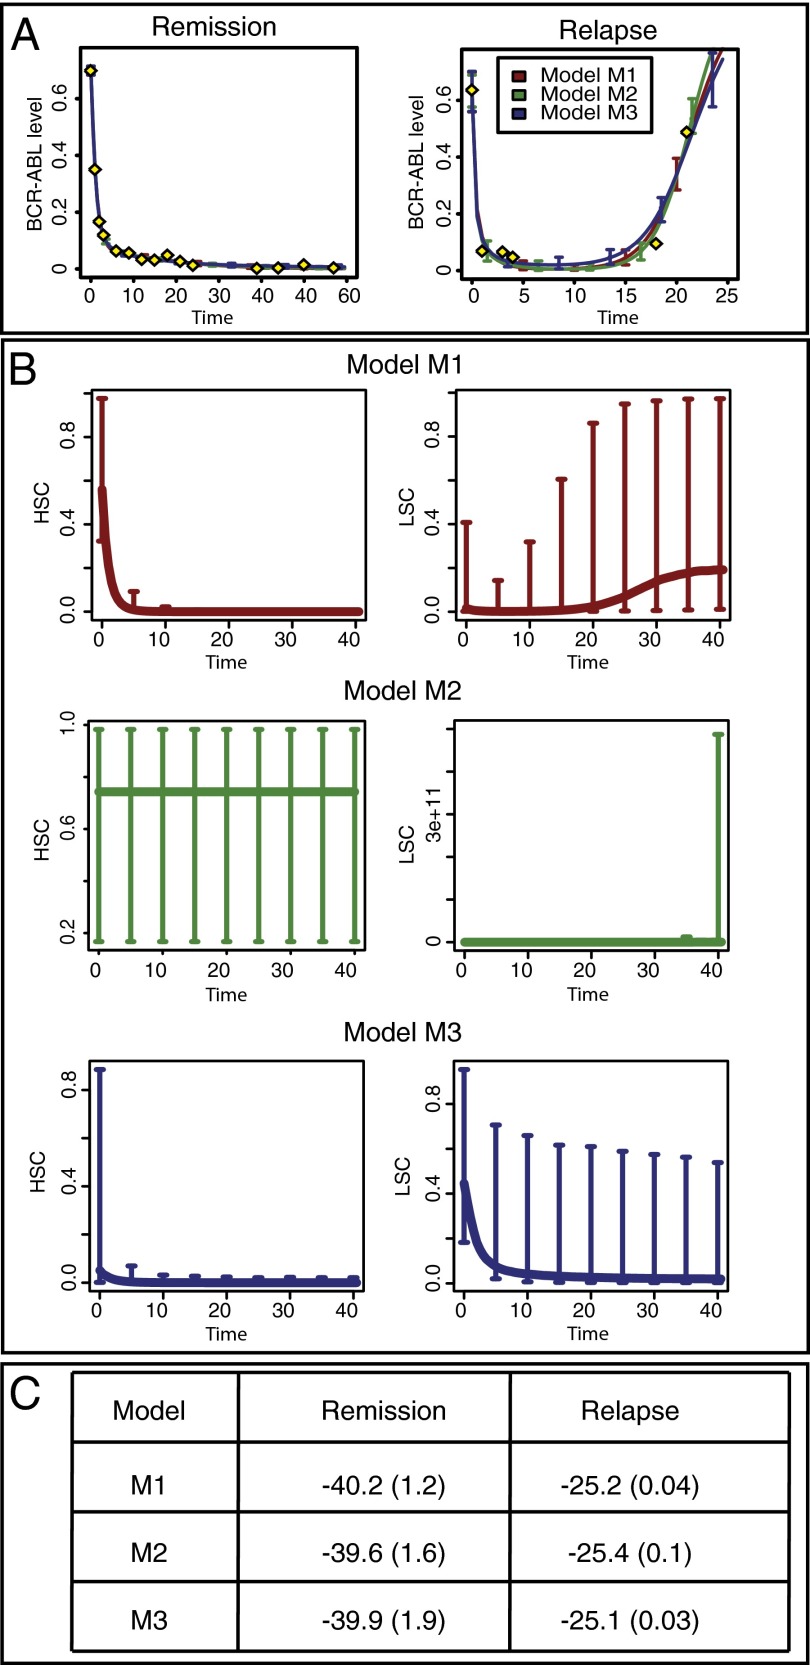
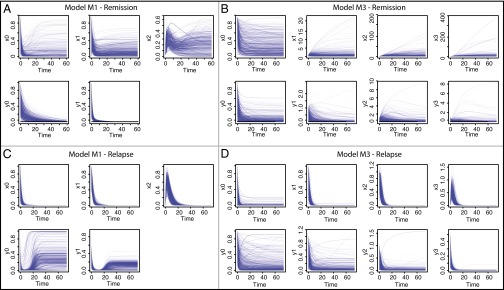
Chronic myeloid leukemia (CML) is a blood disease that disrupts normal function of the hematopoietic system. Despite the great progress made in terms of molecular therapies for CML, there remain large gaps in our understanding. By comparing mathematical models that describe CML progression and etiology we sought to identify those models that provide the best description of disease dynamics and their underlying mechanisms. Data for two clinical outcomes--disease remission or relapse--are considered, and we investigate these using Bayesian inference techniques throughout. We find that it is not possible to choose between the models based on fits to the data alone; however, by studying model predictions we can discard models that fail to take niche effects into account. More detailed analysis of the remaining models reveals mechanistic differences: for one model, leukemia stem cell dynamics determine the disease outcome; and for the other model disease progression is determined at the stage of progenitor cells, in particular by differences in progenitor death rates. This analysis also reveals distinct transient dynamics that will be experimentally accessible, but are currently at the limits of what is possible to measure. To resolve these differences we need to be able to probe the hematopoietic stem cell niche directly. Our analysis highlights the importance of further mapping of the bone marrow hematopoietic niche microenvironment as the "ecological" interactions between cells in this niche appear to be intricately linked to disease outcome.
Keywords: cancer progression; competition; model selection; niche dynamics.
Conflict of interest statement
The authors declare no conflict of interest.
Figures
 against
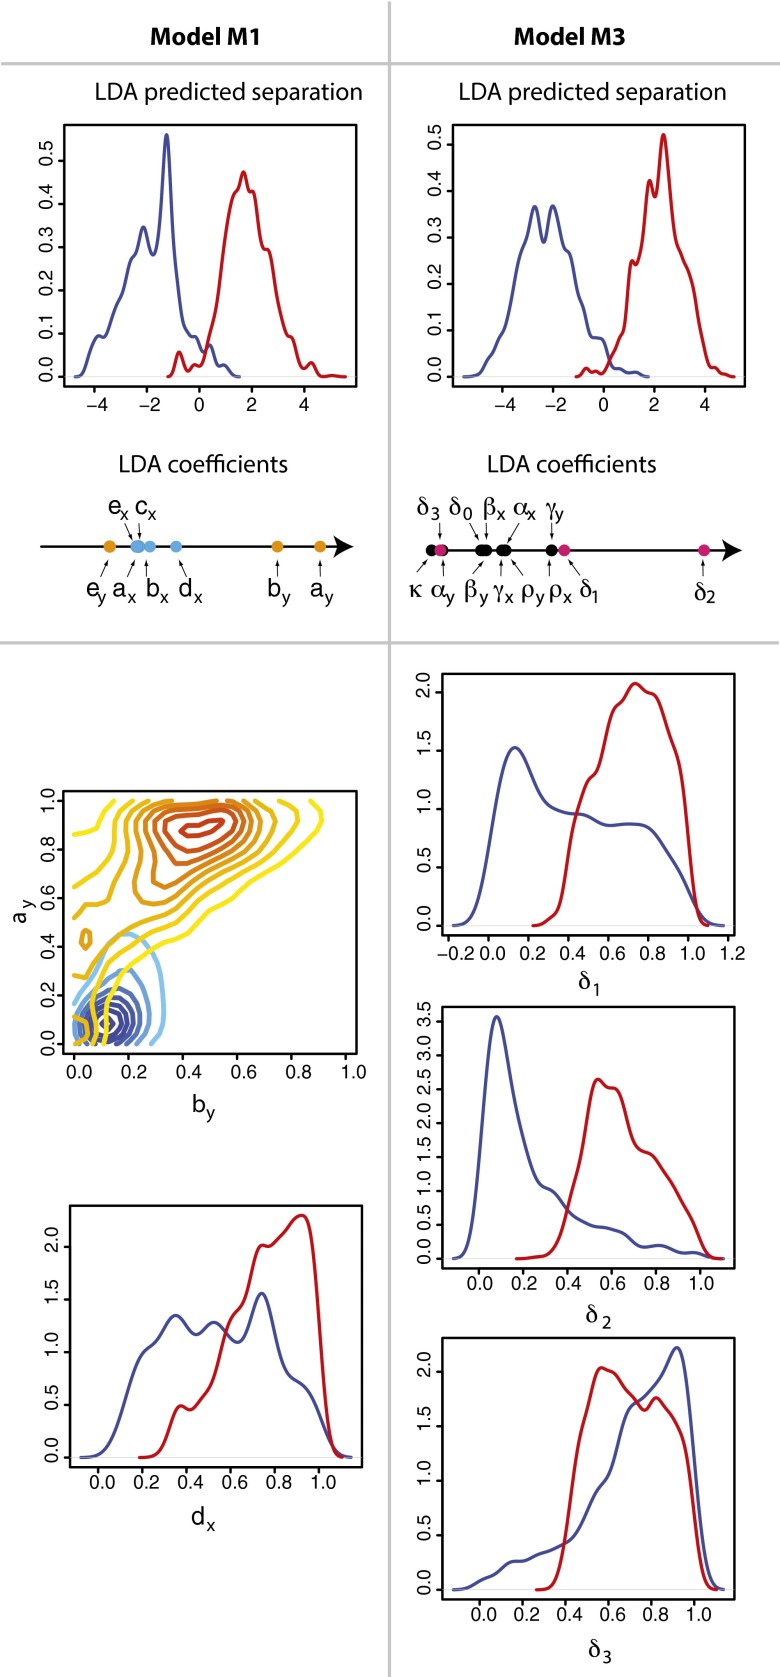
  with the location of remission outcomes marked in blue and the relapse outcomes in red: using only these two parameters a good separation is already achieved. We also show the posterior density distribution of parameter
  alone in case of remission (blue) and relapse (red)—moderate separability is observed. For M3 we show the posterior density distribution for each of the death rates and we see that for
  , remission (blue) and relapse (red) can be well distinguished.
References
-
- Morrison SJ, Uchida N, Weissman IL. The biology of hematopoietic stem cells. Annu Rev Cell Dev Biol. 1995;11:35–71. - PubMed
-
- Lapidot T, et al. A cell initiating human acute myeloid leukaemia after transplantation into SCID mice. Nature. 1994;367(6464):645–648. - PubMed
-
- Hope KJ, Jin L, Dick JE. Acute myeloid leukemia originates from a hierarchy of leukemic stem cell classes that differ in self-renewal capacity. Nat Immunol. 2004;5(7):738–743. - PubMed
Publication types
MeSH terms
Grants and funding
LinkOut - more resources
Full Text Sources
Other Literature Sources
Medical
